

North America Starter Cultures Market by Application (Alcoholic Beverages, and Non-Alcoholic Beverages), by Type (Yeast, Bacteria, and Molds), by Geography (U.S., Canada, and Mexico) - Analysis and Forecast to 2019
- Publish Date: May 2015


The North American starter cultures market is estimated to grow at a CAGR of 6.7%, during the forecast period of 2014 to 2019. The starter cultures usually consist of a cultivation medium, such as grains, seeds, or nutrient liquids that have been well colonized by microorganisms used for the fermentation. A wide range of grains, fruits, and vegetable by-products are used as a base to produce both alcoholic and non-alcoholic beverages.
Starter cultures are the microbial cultures that initiate the fermentation process. The purity of the culture is taken care of and the strains tend to mutate due to ex situ fermentation process Yeast, Bacteria, and Molds- different types of commonly used natural food colors. Cost to produce most of this culture depends on the relative easiness by which it can be ex situ cultured and the easiness by which they can be freeze dried without losing its strain quality and viability.
The North American starter cultures market is dominated by the U.S., followed by Canada. In the U.S., consumer health and wellness awareness is rapidly rising and so is the demand for healthy beverages. Therefore, there is intense competition among beverage manufacturers. The production of fermented beverages depends upon the type of starter culture used as it imparts healthy and appetizing characteristics to the drinks. The competition is influencing the development and increasing production of new and improved non-alcoholic fermented beverages that add value to the American consumers. For example, lactic acid bacteria used in drinking yogurt helps to restore the balance in the human intestinal system. Thus, with the growing production of non-alcoholic fermented beverages, the demand for the corresponding starter cultures in North America is also expanding.
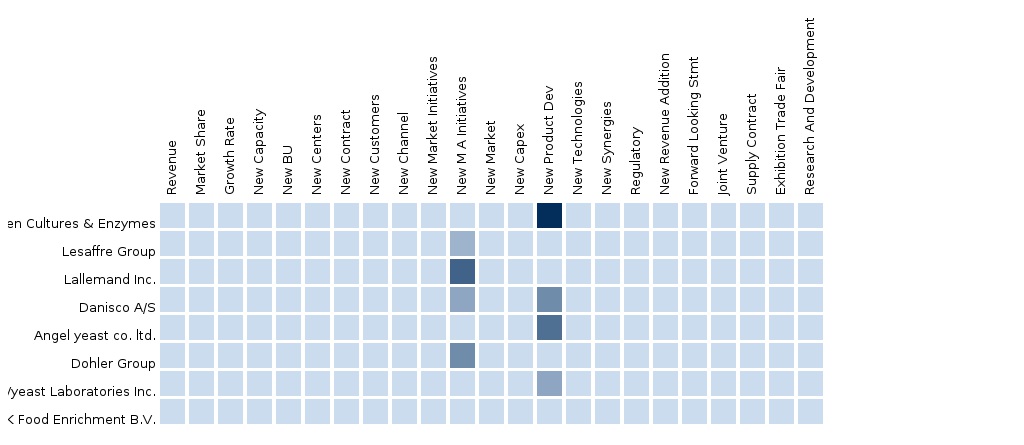
The North American starter cultures market is a competitive market, with firms such as Danisco A/S (Denmark), Chr. Hansen (Denmark), Lassafre Group (France) and Lallemand Inc.(Canada) among others expanding their market share in the North American region. To gain an increasing market share, these companies are adopting numerous market strategies including innovative product development, partnerships, mergers and acquisitions and expansion of existing facilities. Apart from these companies, there are a large number of small firms present in the North American market.
Scope of the report
This research report categorizes the North American starter cultures market into the following segments and sub-segments:
North American starter cultures market, by Type
- Yeast
- Bacteria
- Molds
- Others
North American starter cultures market, by Application
Alcoholic beverages
- Beer
- Wine
- Whisky
- Others
Non-alcoholic beverages
- Cereal based
- Dairy based
- Kombucha
- Others
North American starter cultures market, by Geography
- U.S.
- Canada
- Mexico
Table of Contents
1 Introduction (Page No. - 10)
1.1 Objectives of the Study
1.2 Market Segmentation & Coverage
1.3 Stakeholders
2 Research Methodology (Page No. - 12)
2.1 Integrated Ecosystem of Starter Cultures Market
2.2 Arriving at the Starter Cultures Market Size
2.2.1 Top-Down Approach
2.2.2 Bottom-Up Approach
2.2.3 Demand Side Approach
2.2.4 Macro Indicator-Based Approach
2.3 Assumptions
3 Executive Summary (Page No. - 20)
4 Market Overview (Page No. - 22)
4.1 Introduction
4.2 Starter Cultures Market: Comparison With Parent Market
4.3 Market Drivers and Inhibitors
4.4 Key Market Dynamics
4.5 Demand Side Analysis
5 Starter Cultures Market, By Application (Page No. - 31)
5.1 Introduction
5.2 Demand Side Analysis
5.3 Starter Cultures Market in Alcoholic Beverages, By Geography
6 Starter Cultures Market, By Type (Page No. - 39)
6.1 Introduction
6.2 North America Starter Cultures Market, Type Comparison With Food & Beverage Ingredients Market
6.3 North America Yeast Market, By Geography
6.4 North America Bacteria Market, By Geography
6.5 North America Molds Market, By Geography
6.6 Sneak View: North America Starter Cultures Market, By Type
7 Starter Cultures Market, By Geography (Page No. - 49)
7.1 Introduction
7.2 U.S. Starter Cultures Market
7.2.1 U.S. Starter Cultures Market, By Application
7.2.2 U.S. Starter Cultures Market, By Type
7.3 Canada Starter Cultures Market
7.3.1 Canada Starter Cultures Market, By Application
7.3.2 Canada Starter Cultures Market, By Type
7.4 Mexico Starter Cultures Market
7.4.1 Mexico Starter Cultures Market, By Application
7.4.2 Mexico Starter Cultures Market, By Type
8 Starter Cultures Market: Competitive Landscape (Page No. - 66)
8.1 Starter Cultures Market: Company Share Analysis
8.2 Company Presence in Starter Cultures Market, By Type
8.3 Mergers & Acquisitions
8.4 Expansions
8.5 Joint Ventures
9 Starter Cultures Market, By Company (Page No. - 70)
(Overview, Financials, Products & Services, Strategy, and Developments)*
9.1 Lesaffre Group
9.2 Chr. Hansen Holding A/S
9.3 Lallemand Inc.
9.4 Danisco A/S
9.5 Doehler Group
*Details on Overview, Financials, Product & Services, Strategy, and Developments Might Not Be Captured in Case of Unlisted Company
10 Appendix (Page No. - 82)
10.1 Customization Options
10.1.1 Technical Analysis
10.1.2 Product Type Offerings
10.1.3 Market Trends
10.1.4 Legislation Impact
10.1.5 Impact Analysis
10.2 Related Reports
10.3 Introducing RT: Real Time Market Intelligence
10.3.1 RT Snapshots
List of Tables (51 Tables)
Table 1 Global Starter Cultures Peer Market Size, 2014 (USD MN)
Table 2 North America Starter Cultures Market: By Application, 2014 (KT)
Table 3 North America Starter Cultures Market : Macro Indicators, By Geography, 2014 (’000 Units)
Table 4 North America Starter Cultures Market : Comparison With Parent Market, 2013 – 2019 (USD MN)
Table 5 North America Starter Cultures Market : Comparison With Parent Market, 2013 – 2019 (KT)
Table 6 North America Starter Cultures Market : Drivers and Inhibitors
Table 7 North America Starter Cultures Market: By Application,2013 - 2019 (USD MN)
Table 8 North America Starter Cultures Market: By Application, 2013 - 2019 (KT)
Table 9 North America Starter Cultures Market: By Type, 2013 - 2019 (USD MN)
Table 10 North America Starter Cultures Market, By Type, 2013 - 2019 (KT)
Table 11 North America Starter Cultures Market: By Geography,2013 - 2019 (USD MN)
Table 12 North America Starter Cultures Market: By Geography,2013 - 2019 (KT)
Table 13 North America Starter Cultures Market : Comparison With Application Markets, 2013 - 2019 (USD MN)
Table 14 North America Starter Cultures Market: By Application,2013 - 2019 (USD MN)
Table 15 North America Starter Cultures Market : Market, By Application,2013 - 2019 (KT)
Table 16 North America Starter Cultures Market in Alcoholic Beverages,By Geography, 2013 - 2019 (USD MN)
Table 17 North America Starter Cultures Market in Alcoholic Beverages,By Geography, 2013 - 2019 (KT)
Table 18 Starter Cultures Market in Non-Alcoholic Beverages, By Geography
Table 19 North America Starter Cultures Market in Non-Alcoholic Beverages,By Geography, 2013 - 2019 (USD MN)
Table 20 North America Starter Cultures Market in Non-Alcoholic Beverages,By Geography, 2013 - 2019 (KT)
Table 21 North America Starter Cultures Market: By Type, 2013 - 2019 (USD MN)
Table 22 North America Starter Cultures Market: By Type, 2013 - 2019 (KT)
Table 23 North America Starter Cultures Market: Type Comparison With Parent Market, 2013–2019 (USD MN)
Table 24 North America Yeast Market: By Geography, 2013–2019 (USD MN)
Table 25 North America Yeast Market: By Geography, 2013 - 2019 (KT)
Table 26 North America Bacteria Market: By Geography, 2013–2019 (USD MN)
Table 27 North America Bacteria Market, By Geography, 2013 - 2019 (KT)
Table 28 North America Molds Market: By Geography, 2013–2019 (USD MN)
Table 29 North America Molds Market: By Geography, 2013 - 2019 (KT)
Table 30 North America Starter Cultures Market:, By Geography,2013 - 2019 (USD MN)
Table 31 North America Starter Cultures Market: By Geography, 2013 - 2019 (KT)
Table 32 U.S. Starter Cultures Market: By Application, 2013-2019 (USD MN)
Table 33 U.S. Starter Cultures Market: By Application, 2013-2019 (KT)
Table 34 U.S. Starter Cultures Market: By Type, 2013 - 2019 (USD MN)
Table 35 U.S. Starter Cultures Market: By Type, 2013 - 2019 (KT)
Table 36 Canada Starter Cultures Market: By Application, 2013 - 2019 (USD MN)
Table 37 Canada Starter Cultures Market: By Application, 2013 - 2019 (KT)
Table 38 Canada Starter Cultures Market: By Type, 2013 - 2019 (USD MN)
Table 39 Canada Starter Cultures Market: By Type, 2013 - 2019 (KT)
Table 40 Mexico Starter Cultures Market: By Application, 2013 - 2019 (USD MN)
Table 41 Mexico Starter Cultures Market: By Application, 2013-2019 (KT)
Table 42 Mexico Starter Cultures : Market: By Type, 2013 - 2019 (USD MN)
Table 43 Mexico Starter Cultures Market: By Type, 2013 - 2019 (KT)
Table 44 Starter Cultures Market: Company Share Analysis, 2014 (%)
Table 45 North America Starter Cultures Market: Mergers & Acquisitions
Table 46 North America Starter Cultures Market: Expansions
Table 47 North America Starter Cultures Market: New Product Launch/ Agreements/ New Product Development
Table 48 Chr. Hansen Holding A/S: Key Operations Data, 2010 - 2014 (USD MN)
Table 49 Chr. Hansen Holding A/S: Key Financials Data, 2009 - 2013 (USD MN)
Table 50 E. I. Du Pont De Nemours and Company: Key Operations Data,2010 - 2014 (USD MN)
Table 51 E. I. Du Pont De Nemours and Company: Key Financials Data,2010 - 2014 (USD MN)
List of Figures (45 Figures)
Figure 1 North America Starter Cultures Market: Segmentation & Coverage
Figure 2 Starter Cultures Market: Integrated Ecosystem
Figure 3 Research Methodology
Figure 4 Top-Down Approach
Figure 5 Bottom-Up Approach
Figure 6 Demand Side Approach
Figure 7 Macro Indicator-Based Approach
Figure 8 North America Starter Cultures Market Snapshot
Figure 9 North America Starter Cultures Market: Growth Aspects
Figure 10 North America Starter Cultures Market: By Application, 2014 & 2019
Figure 11 North America Starter Cultures Market: Type By Geography, 2014 (USD MN)
Figure 12 North America Starter Cultures Market: Growth Analysis, By Type,2014–2019 (%)
Figure 13 North America Starter Cultures Market: Demand Side Analysis,By Application, 2014–2019 (USD MN)
Figure 14 Starter Cultures : Application Market Scenario
Figure 15 North America Starter Cultures Market: By Application,2014 - 2019 (USD MN)
Figure 16 North America Starter Cultures Market, By Application, 2014 - 2019 (KT)
Figure 17 North America Starter Cultures Market in Alcoholic Beverages,By Geography, 2013 - 2019 (USD MN)
Figure 18 North America Starter Cultures Market in Non-Alcoholic Beverages,By Geography, 2013 - 2019 (USD MN)
Figure 19 North America Starter Cultures Market: By Type, 2014 - 2019 (USD MN)
Figure 20 North America Starter Cultures Market: By Type, 2014 & 2019 (KT)
Figure 21 North America Starter Cultures Market: Type Comparison With Food & Beverage Ingredients Market, 2013–2019 (USD MN)
Figure 22 North America Yeast Market: By Geography, 2013–2019 (USD MN)
Figure 23 North America Bacteria Market: By Geography, 2013–2019 (USD MN)
Figure 24 North America Molds Market: By Geography, 2013–2019 (USD MN)
Figure 25 North America Starter Cultures Market: Growth Analysis, By Geography, 2014-2019 (USD MN)
Figure 26 North America Starter Cultures Market: Growth Analysis, By Geography, 2013-2019 (KT)
Figure 27 U.S. Starter Cultures Market Overview, 2014 & 2019 (%)
Figure 28 U.S. Starter Cultures Market: By Application, 2013-2019 (USD MN)
Figure 29 U.S. Starter Cultures Market: Application Snapshot
Figure 30 U.S. Starter Cultures Market, By Type: 2013 - 2019 (USD MN)
Figure 31 U.S. Starter Cultures Market Share, By Type, 2014-2019 (%)
Figure 32 Canada Starter Cultures Market Overview, 2014 & 2019 (%)
Figure 33 Canada Starter Cultures Market: By Application, 2013-2019 (USD MN)
Figure 34 Canada Starter Cultures Market: Application Snapshot
Figure 35 Canada Starter Cultures Market: By Type, 2013 - 2019 (USD MN)
Figure 36 Canada Starter Cultures Market Share, By Type, 2014-2019 (%)
Figure 37 Mexico Starter Cultures Market Overview, 2014 & 2019 (%)
Figure 38 Mexico Starter Cultures Market: By Application, 2013 - 2019 (USD MN)
Figure 39 Mexico Starter Cultures Market: Application Snapshot
Figure 40 Mexico Starter Cultures Market: By Type, 2013 - 2019 (USD MN)
Figure 41 Mexico Starter Cultures Market Share, By Type, 2014-2019 (%)
Figure 42 Starter Cultures Market: Company Share Analysis, 2014 (%)
Figure 43 Starter Cultures : Company Product Coverage, By Type, 2014
Figure 44 Chr. Hansen Holding A/S Revenue Mix, 2014 (%)
Figure 45 E. I. Du Pont De Nemours and Company, Revenue Mix, 2014 (%)
Starter cultures hold significance in the beverage industry, as they are used in the production of various beverages such as beer, wine, kefir, and buttermilk. Starter cultures are widely used in beverages for their intense flavor, quality enhancement properties, and other characteristics. They are microorganisms that are used in the production of alcoholic and non-alcoholic beverages. Commercial starter cultures production has resulted in the control of the fermentation process, thereby maintaining desirable and uniform characteristics among different batches of the products.
The starter cultures market is showing growth since the past few years. The increase in the demand for alcoholic and non-alcoholic beverages is associated with the growth of the starter cultures market. The starter cultures market is competitive in nature wherein the demand for ready-to-drink, nutritive beverages has accelerated across the globe. Leading starter culture companies are adopting mergers & acquisitions as the most preferred strategy to achieve a larger market share.
The purpose of this study is to analyze the North American market for starter cultures. This report includes revenue forecasts, market trends and opportunities for the forecast period of 2014 to 2019. The analysis has been conducted on the various market segments derived on the basis of the application of starter cultures and further segmented on the basis of starter culture type.
The North American starter cultures market was valued at $222.1 million in 2014 and is projected to reach $307.4 million by 2019 at a CAGR of 6.7% during the forecast period of 2014 to 2019. The market, by application led the alcoholic beverages in 2014, with a 67.2% share. Yeasts are mostly used among the starter cultures and also account for the highest CAGR% for the given forecast period.
Please visit https://www.micromarketmonitor.com/custom-research-services.html to specify your custom Research Requirement


