

Food Colors Market by Type (Natural, Synthetic, and Nature-Identical), Application (Beverages, Bakery & Confectionery, and Meat Products), Form (Liquid, Liquid Gel, Gel Paste, and Powder), Solubility (Dyes and Lakes) - Global Forecast to 2022
- Publish Date: Upcoming


The global food & beverage enzymes market had been valued at $1.5 billion in 2013. The market is fast inculcating the use of enzymes in the light of numerous advantages they provide. These include carbohydrases, proteases, lipases, and other enzymes, with carbohydrases encompassing prevalent food enzymes such as amylase, cellulase, pectinase, and lactase, among others. Enzymes find wide applications in the food & beverage industry. The end-use market has been categorized into beverages, dairy, bakery, and others, which include sugar & starch processing, fruit processing, meat processing, egg processing, oils & fats industry, protein hydrolysis, and noodles/pasta industry applications, among others.
What makes our report unique?
- You can request a 10% customization in the research that matches your requirement. For example, you could request a deep dive research in any specific region, technology, or application.
- This report provides a competitive landscape of the top players in the global food & beverages enzymes market. Under the strategic benchmarking section, we will provide you with their key developments along with the impacts that include new product developments, M&A, a strategic focus on any specific application, technology, and geography. Under the Financials section, we will provide you with details that span Capex (Investments), revenues, EBITDA, and so on. Under the operational insights section, we will provide you with the new capacities added, new centers, and new key employments. Under the sales and marketing section, we will provide you with insights on new contracts (available on the public domain), new distribution channels added, new marketing initiatives, and so on.
Key question answered
- What are market estimates and forecasts?
- Which of food and beverages enzymes markets are doing well and which are not?
Audience for this report
- Food & Beverages Enzymes companies
- Food & Beverages Enzymes manufacturers
- Food & Beverages Enzymes traders, distributors and suppliers
- Governmental and research organizations
- Associations and industry bodies
- Technology providers to Food & Beverages Enzymes industries
Table Of Contents
1 Introduction
1.1 Key Take-Aways
1.2 Report Description
1.3 Stakeholders
1.4 Research Methodology
1.4.1 Markets Covered
1.4.2 Market Size
1.4.3 Secondary Sources
1.4.4 Assumptions Made For This Report
1.4.5 Key Data Points Validated From Primary & Secondary Sources
1.4.6 Key Questions Answered
2 Executive Summary
3 Premium Insights
3.1 Market Segmentation
3.2 Swot Analysis
3.3 Food & Beverage Enzymes Market Value, By Geography
3.4 Food & Beverage Enzymes Market Drivers & Restraints
3.5 Carbohydrase: Parent & Sub-Types
3.6 Improved Performance Of End-Products Using Food & Beverage Enzymes
3.7 Benchmarking Countries, By Value & Growth
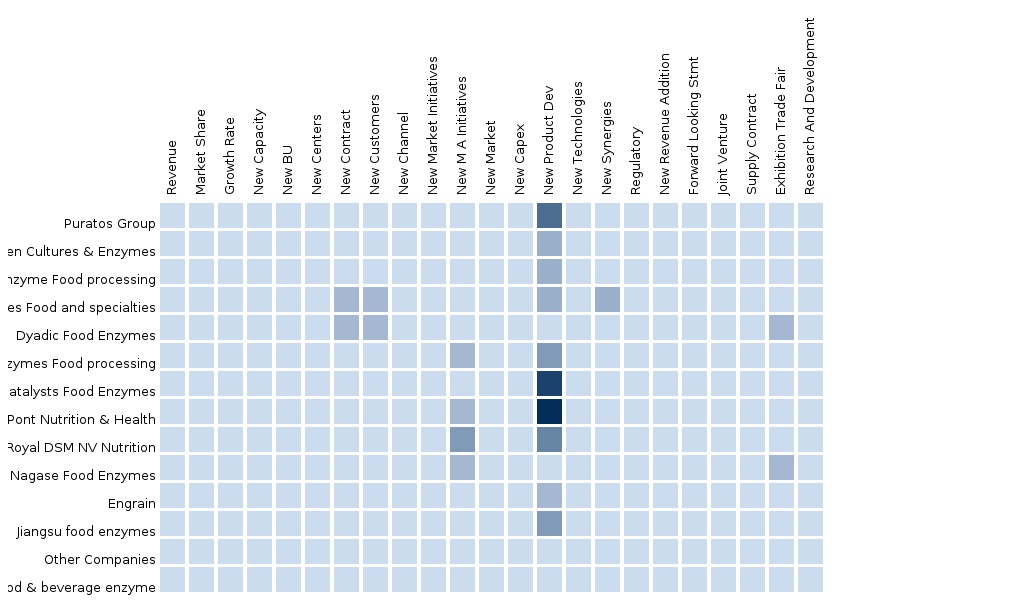
3.8 Benchmarking Key Players, By Developments
3.9 Food & Beverage Enzymes Market Value, By Geography & Types
3.10 Global Market Size,By Selected Countries
3.11 Global Carbohydrase Market Size, By Selected Countries
3.12 Global Carbohydrase Market Size, By Types
3.13 Global Protease Market Size, By Selected Countries
3.14 Global Lipase Market Size, By Selected Countries
3.15 Global Food & Beverage Enzymes Market Value Chain
3.16 Benchmarking Key Market Players
3.17 Strategic Investment Decision - Development Strategies
3.18 Patent Comparison
3.19 Global Food & Beverage Enzymes Market Size, By Types
3.20 Global Food & Beverage Enzymes Market Size, By Applications
3.21 Global Food & Beverage Enzymes Market Size, By Sources
4 Market Overview
4.1 Introduction
4.2 Market Share Analysis
4.3 Burning Issues
4.3.1 Change In Safety Legislations In Europe
4.4 Winning Imperatives
4.4.1 New Product Launch
4.5 Impact Analysis
4.6 Market Dynamics
4.6.1 Drivers
4.6.1.1 Environment Friendly Manufacturing Process
4.6.1.2 High Reaction Specificity
4.6.1.3 Improving Food Quality
4.6.1.4 Increasing Demand For Processed Food
4.6.1.5 Growing Awareness About Healthy And Nutritional Foods
4.6.1.6 Waste Reduction And Energy Savings In Food Processing
4.6.2 Restraints
4.6.2.1 Restricted Temperature And Ph Operational Range
4.6.2.2 Changing Legislations And Lack Of Consistent Safety Regulations
4.6.2.3 Challenges In Brewing Industry
4.6.3 Opportunities
4.6.3.1 Large Number Of Emerging Applications
4.6.3.2 Innovative Technological Platforms
4.6.3.3 Replacing Traditional Chemicals In Various Industries
4.7 Porter’s Five Forces Analysis
4.7.1 Degree Of Competition
4.7.2 Bargaining Power Of Suppliers
4.7.3 Bargaining Power Of Customers
4.7.4 Threat Of Substitutes
4.7.5 Threat Of New Entrants
4.8 Patent Analysis
4.8.1 By Geography
4.8.2 By Years
4.8.3 By Companies
5 Global Food & Beverage Enzymes Market, By Types
5.1 Introduction
5.2 Carbohydrase
5.2.1 Amylase
5.2.2 Cellulase
5.2.3 Pectinase
5.2.4 Lactase
5.2.5 Other Carbohydrase
5.3 Protease
5.4 Lipase
5.5 Others
6 Global Food & Beverage Enzymes Market, By Applications
6.1 Introduction
6.2 Beverage
6.3 Dairy
6.4 Bakery
6.5 Others
7 Global Food & Beverage Enzymes Market, By Sources
7.1 Introduction
7.2 Micro-Organisms
7.3 Plants
7.4 Animals
8 Food & Beverage Enzymes Market, By Geography
8.1 Introduction
8.2 North America (U.S., Canada, Mexico)
8.3 Europe (Germany, U.K., France, Italy, Spain)
8.4 Asia-Pacific (China, Japan, India)
8.5 Row (South Africa, Brazil)
9 Competitive Landscape
9.1 Introduction
9.2 Most Preferred Strategy – New Products Launch
9.3 Mergers & Acquisitions
9.4 Agreements, Partnerships, Collaborations & Joint Ventures 188
9.5 New Product Launch/Developments
9.6 Expansions & Investments
10 Company Profiles (Overview, Financials, Products & Services, Strategy, And Developments)* (Page No. - 200)
10.1 AB Enzymes GMBH
10.2 Advanced Enzymes Technologies Limited
10.3 Amano Enzyme Inc.
10.4 AUM Enzymes
10.5 Biocatalysts Limited
10.6 Chr. Hansen Holding A/S
10.7 Dyadic International Inc.
10.8 E.I. DUPONT DE Nemours & Company
10.9 Engrain
10.10 Enmex SA DE CV
*Details On Overview, Financials, Product & Services, Strategy, And Developments Might Not Be Captured In Case Of Unlisted Companies.
List Of Tables (126 Tables)
Table 1 Global Food & Beverage Enzymes: Market Revenue,By Types, 2011 – 2018 ($Million)
Table 2 Global: Carbohydrase Enzymes Market Revenue, By Types, 2011 – 2018 ($Million)
Table 3 Carbohydrase Enzymes: Market Revenue, By Geography,2011 – 2018 ($Million)
Table 4 Global: Carbohydrase Enzymes Market Revenue,By Applications, 2011 – 2018 ($Million)
Table 5 Protease Enzymes: Market Revenue, By Geography,2011 – 2018 ($Million)
Table 6 Global: Protease Enzymes Market Revenue, By Applications, 2011 – 2018 ($Million)
Table 7 Types Of Lipase
Table 8 Lipase Enzymes: Market Revenue, By Geography,2011 – 2018 ($Million)
Table 9 Global: Lipase Enzymes Market Revenue, By Applications,2011 – 2018 ($Million)
Table 10 Other Enzymes: Market Revenue, By Geography,2011 – 2018 ($Million)
Table 11 Global: Other Enzymes Market Revenue, By Applications,2011 – 2018 ($Million)
Table 12 Global Food & Beverage Enzymes Market Revenue,By Applications, 2011 – 2018 ($Million)
Table 13 Beverage Enzymes: Market Revenue, By Geography,2011 – 2018 ($Million)
Table 14 Global Beverage Enzymes: Market Revenue, By Types,2011 – 2018 ($Million)
Table 15 Dairy Enzymes: Market Revenue, By Geography,2011 – 2018 ($Million)
Table 16 Global Dairy Enzymes: Market Revenue, By Types,2011 – 2018 ($Million)
Table 17 Enzymes & Its Applications In Bakery
Table 18 Bakery Enzymes: Market Revenue, By Geography,2011 – 2018 ($Million)
Table 19 Global Bakery Enzymes: Market Revenue, By Types,2011 – 2018 ($Million)
Table 20 Others Food & Beverage Enzymes: Market Revenue, By Geography,2011 – 2018 ($Million)
Table 21 Global Others Food & Beverage Enzymes: Market Revenue, By Types,2011 – 2018 ($Million)
Table 22 Food & Beverage Enzymes Classification, By Sources
Table 23 Global Market Revenue,By Sources, 2011 – 2018 ($Million)
Table 24 Microbial Sources & Industry Applications
Table 25 Micro-Organism Enzymes: Market Revenue, By Geography, 2011 – 2018 ($Million)
Table 26 Plant Sources & Industry Applications
Table 27 Plant Enzymes: Market Revenue, By Geography,2011 – 2018 ($Million)
Table 28 Animal Sources & Industry Applications
Table 29 Animal Enzymes: Market Revenue, By Geography,2011 – 2018 ($Million)
Table 30 Food & Beverage Enzymes: Market Revenue, By Geography, 2011 – 2018 ($Million)
Table 31 North America: Market Revenue,By Countries, 2011 – 2018 ($Million)
Table 32 North America: Market Revenue,By Types, 2011 – 2018 ($Million)
Table 33 North America: Market Revenue,By Applications, 2011 – 2018 ($Million)
Table 34 North America: Market Revenue,By Sources, 2011 – 2018 ($Million)
Table 35 U.S: Market Revenue, By Types,2011 – 2018 ($Million)
Table 36 U.S: Market Revenue,By Applications, 2011 – 2018 ($Million)
Table 37 U.S: Market Revenue, By Sources, 2011 – 2018 ($Million)
Table 38 Canada: Market Revenue, By Types, 2011 – 2018 ($Million)
Table 39 Canada: Market Revenue,By Applications, 2011 – 2018 ($Million)
Table 40 Canada: Market Revenue,By Sources, 2011 – 2018 ($Million)
Table 41 Mexico: Market Revenue, By Types, 2011 – 2018 ($Million)
Table 42 Mexico: Market Revenue,By Applications, 2011 – 2018 ($Million)
Table 43 Mexico: Market Revenue, By Sources, 2011 – 2018 ($Million)
Table 44 Europe: Market Revenue,By Countries, 2011 – 2018 ($Million)
Table 45 Europe: Market Revenue, By Types, 2011 – 2018 ($Million)
Table 46 Europe: Market Revenue,By Applications, 2011 – 2018 ($Million)
Table 47 Europe: Market Revenue,By Sources, 2011 – 2018 ($Million)
Table 48 Germany: Market Revenue, By Types, 2011 – 2018 ($Million)
Table 49 Germany: Market Revenue,By Applications, 2011 – 2018 ($Million)
Table 50 Germany: Market Revenue,By Sources, 2011 – 2018 ($Million)
Table 51 U.K: Market Revenue, By Types,2011 – 2018 ($Million)
Table 52 U.K: Market Revenue,By Applications, 2011 – 2018 ($Million)
Table 53 U.K: Market Revenue, By Sources, 2011 – 2018 ($Million)
Table 54 France: Market Revenue, By Types, 2011 – 2018 ($Million)
Table 55 France: Market Revenue,By Applications, 2011 – 2018 ($Million)
Table 56 France: Market Revenue,By Sources, 2011 – 2018 ($Million)
Table 57 Italy: Market Revenue, By Types, 2011 – 2018 ($Million)
Table 58 Italy: Market Revenue,By Applications, 2011 – 2018 ($Million)
Table 59 Italy: Market Revenue, By Sources, 2011 – 2018 ($Million)
Table 60 Spain: Market Revenue, By Types, 2011 – 2018 ($Million)
Table 61 Spain: Market Revenue,By Applications, 2011 – 2018 ($Million)
Table 62 Spain: Market Revenue, By Sources, 2011 – 2018 ($Million)
Table 63 Rest Of Europe: Market Revenue,By Types, 2011 – 2018 ($Million)
Table 64 Rest Of Europe: Market Revenue,By Applications, 2011 – 2018 ($Million)
Table 65 Rest Of Europe: Market Revenue,By Sources, 2011 – 2018 ($Million)
Table 66 APAC: Market Revenue,By Countries, 2011 – 2018 ($Million)
Table 67 APAC: Market Revenue, By Types, 2011 – 2018 ($Million)
Table 68 APAC: Market Revenue,By Applications, 2011 – 2018 ($Million)
Table 69 APAC: Market Revenue, By Sources, 2011 – 2018 ($Million)
Table 70 China: Market Revenue, By Types, 2011 – 2018 ($Million)
Table 71 China: Market Revenue,By Applications, 2011 – 2018 ($Million)
Table 72 China: Market Revenue, By Sources, 2011 – 2018 ($Million)
Table 73 Japan: Market Revenue, By Types, 2011 – 2018 ($Million)
Table 74 Japan: Market Revenue,By Applications, 2011 – 2018 ($Million)
Table 75 Japan: Market Revenue, By Sources, 2011 – 2018 ($Million)
Table 76 India: Market Revenue,By Types, 2011 – 2018 ($Million)
Table 77 India: Market Revenue,By Applications, 2011 – 2018 ($Million)
Table 78 India: Market Revenue, By Sources, 2011 – 2018 ($Million)
Table 79 Rest Of APAC: Market Revenue,By Types, 2011 – 2018 ($Million)
Table 80 Rest Of APAC: Market Revenue,By Applications, 2011 – 2018 ($Million)
Table 81 Rest Of APAC: Market Revenue,By Sources, 2011 – 2018 ($Million)
Table 82 Row: Market Revenue, By Countries, 2011 – 2018 ($Million)
Table 83 Row: Market Revenue, By Types,2011 – 2018 ($Million)
Table 84 Row: Market Revenue,By Applications, 2011 – 2018 ($Million)
Table 85 Row: Market Revenue, By Sources, 2011 – 2018 ($Million)
Table 86 South Africa: Market Revenue,By Types, 2011 – 2018 ($Million)
Table 87 South Africa: Market Revenue,By Applications, 2011 – 2018 ($Million)
Table 88 South Africa: Market Revenue,By Sources, 2011 – 2018 ($Million)
Table 89 Brazil: Market Revenue, By Types, 2011 – 2018 ($Million)
Table 90 Brazil: Market Revenue,By Applications, 2011 – 2018 ($Million)
Table 91 Brazil: Market Revenue,By Sources, 2011 – 2018 ($Million)
Table 92 Rest of Row: Food & Beverage Enzymes Market Revenue,By Types, 2011 – 2018 ($Million)
Table 93 Rest of Row: Market Revenue,By Applications, 2011 – 2018 ($Million)
Table 94 Rest of Row: Market Revenue,By Sources, 2011 – 2018 ($Million)
Table 95 Mergers & Acquisitions, 2011 – 2013
Table 96 Agreements, Partnerships, Collaborations & Joint Ventures, 2010 – 2013
Table 97 New Product Developments, 2009 – 2013
Table 98 Expansions & Investments, 2008 – 2013
Table 99 AB Enzymes: Products & Its Applications
Table 100 Advanced Enzymes: Total Revenue, By Business Segments, 2011 – 2012 ($Million)
Table 101 Amano Enzyme: Products & Its Applications
Table 102 AUM Enzymes: Products & Its Applications
Table 103 Chr. Hansen: Total Revenue, By Business Segments,2011 – 2012 ($Million)
Table 104 Chr. Hansen: Total Revenue, By Geography,2011 – 2012 ($Million)
Table 105 Chr. Hansen: Products & Its Applications
Table 106 Dyadic: Total Revenue, By Business Segments,2011 – 2012 ($Million)
Table 107 Dyadic: Products & Its Applications
Table 108 DUPONT: Total Market Revenue, 2011 – 2012 ($Million)
Table 109 DUPONT: Total Revenue, By Geography, 2010 – 2011 ($Million)
Table 110 DUPONT: Products & Its Applications
Table 111 Engrain: Products & Its Services
Table 112 Enmex: Products & Its Applications
Table 113 Jiangsu: Products & Its Applications
Table 114 Lumis Biotech: Products & Its Applications
Table 115 Maps Enzyme: Products & Its Applications
Table 116 Nagase: Products & Its Applications
Table 117 Novozymes: Total Revenue, By Business Segments,2011 – 2012 ($Million)
Table 118 Novozymes: Total Revenue, By Geography,2011 – 2012 ($Million)
Table 119 Novozymes: Products & Its Applications
Table 120 Puratos: Products & Its Applications
Table 121 Rossari: Products & Its Applications
Table 122 Royal DSM: Total Revenue, By Business Segments,2011 – 2012 ($Million)
Table 123 Royal DSM: Total Revenue, By Geography,2011 – 2012 ($Million)
Table 124 Royal DSM: Products & Its Applications
Table 125 Shenzhen: Products & Its Applications
Table 126 Sunson: Products & Its Applications
List Of Figures (38 Figures)
Figure 1 Food & Beverage Enzymes Market Share, By Geography, 2012
Figure 2 Market Segmentation
Figure 3 Swot Analysis
Figure 4 Food & Beverage Enzymes Market Size, By Geography,2012 – 2018 ($Million)
Figure 5 Market Drivers & Restraints
Figure 6 Carbohydrase: Parent & Sub-Types
Figure 7 Improved Performance Of End-Products
Figure 8 Benchmarking Countries, By Value & Growth
Figure 9 Benchmarking Key Players By Developments
Figure 10 Food & Beverage Enzymes Market Size, By Geography & Types, 2012 ($Million)
Figure 11 Global Food & Beverage Enzymes Market Size, By Selected Countries, 2012 – 2018 ($Million)
Figure 12 Global Carbohydrase Market Size, By Selected Countries, 2012 – 2018 ($Million)
Figure 13 Global Carbohydrase Market Size, By Types, 2012 ($Million)
Figure 14 Global Protease Market Size, By Selected Countries,2012 – 2018 ($Million)
Figure 15 Global Lipase Market Size, By Selected Countries,2012 – 2018 ($Million)
Figure 16 Global Market Value Chain
Figure 17 Benchmarking Key Market Players
Figure 18 Strategic Investment Decision- Development Strategies
Figure 19 Patent Comparison, 2010 – 2013
Figure 20 Global : Market Size, By Types,2012 – 2018 ($Million)
Figure 21 Global : Market Size,By Applications, 2012 – 2018 ($Million)
Figure 22 Global : Market Size, By Sources, 2012 – 2018 ($Million)
Figure 23 Global : Market Segmentation
Figure 24 Market Share Analysis
Figure 25 Impact Analysis Of Market Drivers, Restraints & Opportunities
Figure 26 Effect Of Temperature On The Rate Of An Enzyme-Catalyzed Reaction
Figure 27 Effect Of Ph On The Rate Of An Enzyme-Catalyzed Reaction
Figure 28 Porter’s Five Forces Analysis
Figure 29 Patent Analysis, By Geography/Countries, 2010 – 2013
Figure 30 Number Of Patents, By Geography/Countries, 2010 – 2013
Figure 31 Patent Analysis, By Companies, 2010 – 2013
Figure 32 Major Types Of Enzymes & Its Applications
Figure 33 Classification Of Food & Beverage Enzymes
Figure 34 Share Of Food & Beverage Enzymes In Industrial Enzymes, 2011 – 2018
Figure 35 Sources Of Food & Beverage Enzymes
Figure 36 Global Market Share, By Growth Strategies, 2009 – 2013
Figure 37 Global Market Developments,By Growth Strategies, 2009 – 2013
Figure 38 Global Market Growth Strategies, By Companies, 2009 – 2013
Please fill in the form below to receive a free copy of the Summary of this Report
Please visit https://www.micromarketmonitor.com/custom-research-services.html to specify your custom Research Requirement
| PRODUCT TITLE | PUBLISHED | |
|---|---|---|
|
|
Protease Protease is the most essential enzyme for the digestion of protein. It is involved in catabolism of protein in which hydrolysis of the peptide bonds takes place. The protease market, globally, is valued at $2.01 billion and is projected to grow at a CAGR of 5.3% through to 2018. |
Upcoming |
|
|
North America Protease The North American protease market was valued at $0.9 billion in 2013, with a share of 46.2% globally. It is projected to grow at a CAGR of 5.2% during the forecast period, 2013 to 2018. The market is led by Novozymes A/S (30%) and DSM (18%). |
Upcoming |
|
|
Europe Protease The European protease market was valued at $458.3 million in 2013, at a CAGR of 5.2%, between 2013 and 2018. The market constituted 22.8% of the global Protease market in 2013. Novozymes AS (31%) and DSM (20%) are the leading players in the European market. |
Upcoming |
|
|
Asia-Pacific Protease The Asia-Pacific protease market was valued at $0.4 billion in 2013, with a share of 18.4% globally. This market is projected to grow at a CAGR of 5.2% between 2013 and 2018, and is led by Novozymes A/S (35%) and DSM (20%). |
Upcoming |
|
|
Carbohydrase Carbohydrase and Protease, Lipase and |
Upcoming |
|
|
Lipase Lipase and Carbohydrase, Protease and |
Upcoming |
|
|
Amylases Amylases and Cellulases, Mannanases, |
Upcoming |
|
|
Cellulases Cellulases and Amylases, Mannanases, |
Upcoming |
|
|
Mannanases Mannanases and Amylases, Cellulases, |
Upcoming |
|
|
Xylanases Xylanases and Amylases, Cellulases, |
Upcoming |
|
|
North America Carbohydrase The Carbohydrase North America market was pegged at $1,276.7 million in 2013 and is estimated to grow at a CAGR of 5.5% annually. It is projected to reach $1,757.4 mllion by the end of 2018. Sugar substitutes comprises of amylase, cellulase and others |
Upcoming |
|
|
Europe Carbohydrase The Carbohydrase Europe market was pegged at $499.0 million in 2013 and is estimated to grow at a CAGR of 6.3% annually. It is projected to reach $686.9 mllion by the end of 2018. Sugar substitutes comprises of amylase, cellulase and others |
Upcoming |
|
|
Asia-Pacific Carbohydrase The Carbohydrase Asia-Pacific market was pegged at $504.1 million in 2013 and is estimated to grow at a CAGR of 9.6% annually. It is projected to reach $693.9 mllion by the end of 2018. Sugar substitutes comprises of amylase, cellulase and others |
Upcoming |
|
|
North America Food & Beverage Enzymes The North American food & beverage enzymes market can be segmented by sources, applications, functions, macro indicators, and companies. |
Upcoming |
|
|
Europe Food & Beverage Enzymes The European food & beverage enzymes market can be segmented by Sources, applications, functions, macro indicators, and companies. |
Upcoming |
|
|
Asia-Pacific Food & Beverage Enzymes The Asia-Pacific food & beverage enzymes market can be segmented by sources, applications, functions, macro indicators, and companies. |
Upcoming |


