

North America Sodium Reducing Agents Market by Type (Amino Acids, Mineral Salts, Yeast Extracts, Others) by Application (Dairy & Frozen Foods, Bakery & Confectionery, Meat Products, Sauces, Seasonings, & Snacks, Others) - Forecasts till 2019
- Publish Date: Apr 2015


The North American sodium reducing agents market is estimated to grow at CAGR of 10.6% from 2014 to 2019. For many manufacturers in the food industry, salt reduction is an important issue. Though a major reduction has been observed in the past few years, the government wants to further reduce the level of salts in all food products. Manufacturers are formulating new recipes for their processed foods in order to reduce the salt content in their products. Consumers perceive that low salt content does not give taste to the product. Thus, innovations are being made to introduce ingredients that would reduce the salt and at the same time maintain or enhance the taste of the final product.
The sodium reducing agent market is gaining importance due to the increase in the number of patients suffering from hypertension and cardiovascular diseases. Amino acids, mineral salts, yeast extracts are the commonly used sodium reducing agents. The cost of producing low sodium mineral salts is much lower than the other two segments.
The North American sodium reducing agents market is dominated by the U.S., and is followed by Canada. In the U.S., aggressive public awareness campaigns to promote the use of sodium reducing agents across the food industry are among the key factors driving the market.
The North American sodium reducing agents market is a competitive market, with firms such as Tate & Lyle Plc (U.S.), Kerry Group Plc (U.S.), and Novozymes A/S (Denmark), among others, which are expanding their market shares in the North American region. To gain market share, these companies are adapting numerous marketing strategies including innovative product development, partnerships, mergers & acquisitions, and expansion of existing facilities. Apart from these companies, there are a large number of small firms present in the North American market.
Scope of the Report
This research report categorizes the North American sodium reducing agents market into the following segments and sub-segments:
North America Sodium Reducing Agents Market, By Type
- Amino Acids
- Mineral Salts
- Yeast Extracts
- Others
North America Sodium Reducing Agents Market, By Application
- Dairy and Frozen Foods
- Bakery and Confectionery
- Meat Products
- Sauces, Seasonings, & Snacks
- Others
North American Sodium Reducing Agents Market, By Geography
- U.S.
- Canada
- Mexico
Table of Contents
1 Introduction (Page No. - 11)
1.1 Objectives of the Study
1.2 Market Segmentation & Coverage
1.3 Stakeholders
2 Research Methodology (Page No. - 13)
2.1 Integrated Ecosystem of Sodium Reducing Agents Market
2.2 Arriving at the Sodium Reducing Agents Market Size
2.2.1 Top-Down Approach
2.2.2 Bottom-Up Approach
2.2.3 Demand Side Approach
2.2.4 Macroindicator-Based Approach
2.3 Assumptions
3 Executive Summary (Page No. - 22)
4 Market Overview (Page No. - 24)
4.1 Introduction
4.2 Sodium Reducing Agents Market: Comparison With Parent Market
4.3 Market Drivers and Inhibitors
4.4 Key Market Dynamics
4.5 Demand Side Analysis
5 North America Sodium Reducing Agents Market, By Application (Page No. - 34)
5.1 Introduction
5.2 Sodium Reducing Agents in Bakery, By Geography
5.3 Sodium Reducing Agents Market in Confectionery, By Geography
5.4 Sodium Reducing Agents Market in Dairy & Frozen Foods, By Geography
5.5 Sodium Reducing Agents Market in Meat Products, By Geography
5.6 Sodium Reducing Agents Market in Sauces, Seasonings, & Snacks,By Geography
6 North America Sodium Reducing Agents Market, By Type (Page No. - 46)
6.1 Introduction
6.2 North America Sodium Reducing Agents Market: Type Comparison With Food & Beverage Ingredients Market
6.3 North America Amino Acids Market, By Geography
6.4 North America Mineral Salts Market, By Geography
6.5 North America Yeast Extracts Market, By Geography
6.6 Sneak View: North America Food and Beverages Ingredients Market, By Type
7 Sodium Reducing Agents Market, By Geography (Page No. - 57)
7.1 Introduction
7.2 U.S. Sodium Reducing Agents Market
7.2.1 U.S. Sodium Reducing Agents Market, By Application
7.2.2 U.S. Sodium Reducing Agents Market, By Type
7.3 Canada Sodium Reducing Agents Market
7.3.1 Canada Sodium Reducing Agents Market, By Application
7.3.2 Canada Sodium Reducing Agents Market, By Type
7.4 Mexico Sodium Reducing Agents Market
7.4.1 Mexico Sodium Reducing Agents Market, By Application
7.4.2 Mexico Sodium Reducing Agents Market, By Type
8 North America Sodium Reducing Agents Market: Competitive Landscape (Page No. - 78)
8.1 Sodium Reducing Agents Market: Market Share Analysis
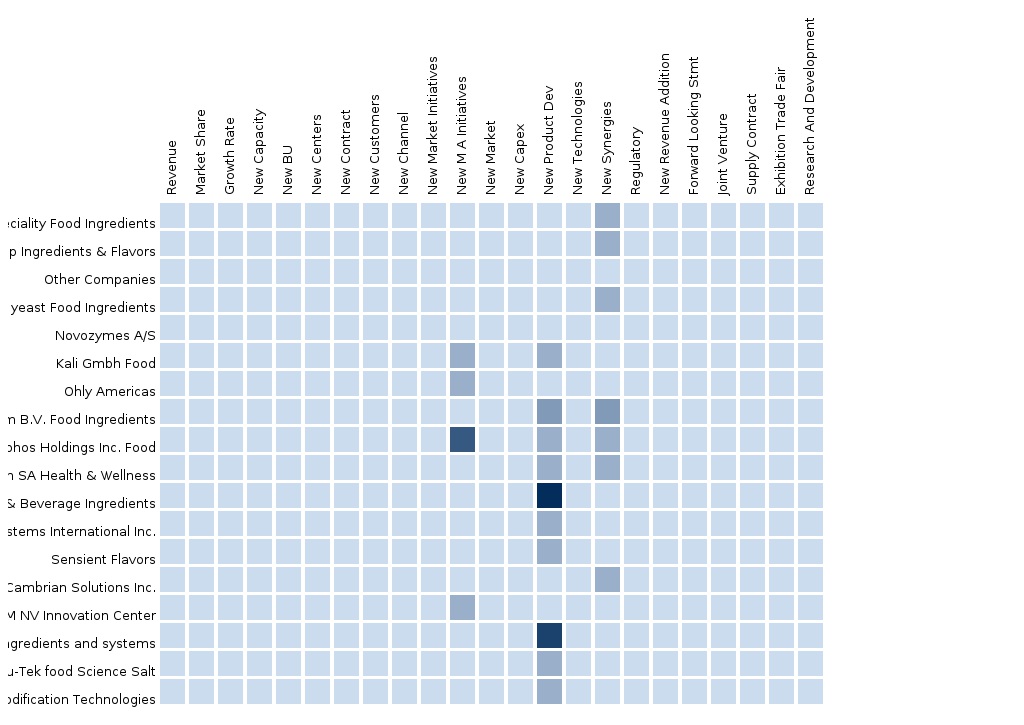
8.2 Company Presence in Sodium Reducing Agents Market, By Type
8.3 Mergers & Acquisitions
8.4 Expansions
8.5 Agreements
9 Sodium Reducing Agents Market, By Company (Page No. - 83)
(Overview, Financials, Products, Strategies, Recent Developments, & Swot Analysis)*
9.1 Kerry Group PLC
9.2 Novozymes A/S
9.3 Tate & Lyle PLC
9.4 Sensient Technologies
9.5 Cargill Incorporated
*Details on Overview, Financials, Products, Strategies, Recent Developments, & Swot Analysis Might Not be Captured in Case of Unlisted Companies.
10 Appendix (Page No. - 95)
10.1 Customization Options
10.1.1 Product Developments
10.1.2 End Use Application Analysis
10.1.3 Regulatory Framework
10.1.4 Supply Chain Data
10.2 Related Reports
10.3 Introducing RT: Real Time Market Intelligence
10.3.1 RT Snapshots
List of Tables (58 Tables)
Table 1 Global Sodium Reducing Agents: Peer Market Size, 2014 (USD MN)
Table 2 North America Sodium Reducing Agents: Application Markets, 2014 (KT)
Table 3 North America Sodium Reducing Agents Market: Macroindicators,By Geography, 2014
Table 4 North America Sodium Reducing Agents Market: Comparison With Parent Market, 2013–2019 (USD MN)
Table 5 North America Sodium Reducing Agents Market: Comparison With Parent Market, 2013–2019 (KT)
Table 6 North America Sodium Reducing Agents Market: Drivers and Inhibitors
Table 7 North America Sodium Reducing Agents Market, By Application,2013-2019 (USD MN)
Table 8 North America Sodium Reducing Agents Market, By Application,2013–2019 (KT)
Table 9 North America Sodium Reducing Agents Market, By Type,2013–2019 (USD MN)
Table 10 North America Sodium Reducing Agents Market, By Type, 2013-2019 (KT)
Table 11 North America Sodium Reducing Agents Market, By Geography,2013-2019 (USD MN)
Table 12 North America Sodium Reducing Agents Market, By Geography,2013-2019 (KT)
Table 13 North America Sodium Reducing Agents Market: Comparison With Application Markets, 2014-2019 (USD MN)
Table 14 North America Sodium Reducing Agents Market, By Application,2013-2019 (USD MN)
Table 15 North America Sodium Reducing Agents Market, By Application,2013-2019 (KT)
Table 16 North America Sodium Reducing Agents in Bakery, By Geography,2013-2019 ( Usd Mn)
Table 17 North America Sodium Reducing Agents in Bakery, By Geography,2013-2019 (KT)
Table 18 North America Sodium Reducing Agents in Confectionery, By Geography, 2013-2019 (USD MN)
Table 19 North America Sodium Reducing Agents in Confectionery, By Geography, 2013-2019 (KT)
Table 20 North America Sodium Reducing Agents in Dairy & Frozen Foods,By Geography, 2013-2019 (USD MN)
Table 21 North America Sodium Reducing Agents in Dairy & Frozen Foods, By Geography, 2013–2019 (KT)
Table 22 North America Sodium Reducing Agents in Meat Products, By Geography, 2013–2019 (USD MN)
Table 23 North America Sodium Reducing Agents in Meat Products, By Geography, 2014-2019 (KT)
Table 24 North America Sodium Reducing Agents in Sauces, Seasonings, & Snacks, By Geography, 2013-2019 (USD MN)
Table 25 North America Sodium Reducing Agents in Sauces, Seasonings, & Snacks, By Geography, 2013-2019 (KT)
Table 26 North America Sodium Reducing Agents Market, By Type,2013-2019 (USD MN)
Table 27 North America Sodium Reducing Agents Market, By Type, 2013-2019 (KT)
Table 28 North America Sodium Reducing Agents Market: Type Comparison With Parent Market, 2013–2019 (USD MN)
Table 29 North America Amino Acids Market, By Geography, 2013–2019 (USD MN)
Table 30 North America Amino Acids Market, By Geography, 2013–2019 (KT)
Table 31 North America Mineral Salts , By Geography, 2013-2019 (USD MN)
Table 32 North America Mineral Salts Market, By Geography, 2013-2019 (KT)
Table 33 North America Yeast Extracts Market, By Geography, 2013–2019 (USD MN)
Table 34 North America Yeast Extracts Market, By Geography, 2013–2019 (KT)
Table 35 North America Sodium Reducing Agents Market , By Geography,2013-2019 (USD MN)
Table 36 North America Sodium Reducing Agents Market, By Geography, 2013-2019 (KT)
Table 37 U.S. Sodium Reducing Agents Market, By Application, 2013-2019 (USD MN)
Table 38 U.S. Sodium Reducing Agents, By Application, 2013-2019 (KT)
Table 39 U.S. Sodium Reducing Agents Market, By Type, 2013-2019 (USD MN)
Table 40 U.S. Sodium Reducing Agents Market, By Type, 2013-2019 (KT)
Table 41 Canada Sodium Reducing Agents Market, By Application, 2013-2019 (USD MN)
Table 42 Canada Sodium Reducing Agents Market, By Application, 2013-2019 (KT)
Table 43 Canada Sodium Reducing Agents Market, By Type, 2013-2019 (USD MN)
Table 44 Canada Sodium Reducing Agents Market, By Type, 2014-2019 (KT)
Table 45 Mexico Sodium Reducing Agents Market, By Application, 2013-2019 (USD MN)
Table 46 Mexico Sodium Reducing Agents Market, By Application, 2013-2019 (KT)
Table 47 Mexico Sodium Reducing Agents Market, By Type, 2013-2019 (USD MN)
Table 48 Mexico Sodium Reducing Agents Market, By Type, 2013–2019 (KT)
Table 49 Sodium Reducing Agents Market: Market Share Analysis, 2014 (%)
Table 50 North America Sodium Reducing Agents Market: Mergers & Acquisitions
Table 51 North America Sodium Reducing Agents Market: Expansions and New Product Developments
Table 52 North America Sodium Reducing Agents Market: Agreements
Table 53 Kerry Group PLC: Key Financial Data, 2009-2013 (USD MN)
Table 54 Kerry Group PLC: Key Operations Data, 2009-2013 (USD MN)
Table 55 Novozymes A/S.: Key Financials, 2009-2013 (USD MN)
Table 56 Tate & Lyle PLC: Key Financial Data, 2010-2014 (USD MN)
Table 57 Sensient Technologies: Key Operations Data, 2009-2013 (USD MN)
Table 58 Cargill Incorporated: Key Financials, 2009-2013 (USD MN)
List of Figures (48 Figures)
Figure 1 North America Sodium Reducing Agents Market: Segmentation & Coverage
Figure 2 Sodium Reducing Agents Market: Integrated Ecosystem
Figure 3 Research Methodology
Figure 4 Top-Down Approach
Figure 5 Bottom-Up Approach
Figure 6 Demand Side Approach
Figure 7 Macroindicator-Based Approach
Figure 8 North America Sodium Reducing Agents Market: Snapshot, 2014
Figure 9 Sodium Reducing Agents Market: Growth Aspects
Figure 10 North America Sodium Reducing Agents Market, By Application, 2014 & 2019
Figure 11 North America Sodium Reducing Agents Types Market, By Geography, 2014 (USD MN)
Figure 12 North America Sodium Reducing Agents Market: Growth Analysis, By Type, 2014–2019 (%)
Figure 13 Sodium Reducing Agents : Key Application Market Scenario
Figure 14 North America Sodium Reducing Agents Market, By Application, 2014-2019 (USD MN)
Figure 15 North America Sodium Reducing Agents Market, By Application, 2014-2019 (KT)
Figure 16 North America Sodium Reducing Agents Market in Bakery, By Geography, 2013-2019 (USD MN)
Figure 17 North America Sodium Reducing Agents Market in Confectionery, By Geography, 2013-2019 (USD MN)
Figure 18 North America Sodium Reducing Agents Market in Dairy & Frozen Foods, By Geography, 2013-2019 (USD MN)
Figure 19 North America Sodium Reducing Agents Market in Meat Products,By Geography, 2013-2019 (USD MN)
Figure 20 North America Sodium Reducing Agents Market in Sauces, Seasonings & Snacks, By Geography, 2013-2019 (USD MN)
Figure 21 North America Sodium Reducing Agents Market, By Type,2014-2019 (USD MN)
Figure 22 North America Sodium Reducing Agents Market, By Type, 2014 & 2019 (KT)
Figure 23 North America Sodium Reducing Agents Market: Type Comparison With Food & Beverage Ingredients Market, 2013–2019 (USD MN)
Figure 24 North America Amino Acids Market, By Geography, 2013–2019 (USD MN)
Figure 25 North America Mineral Salts Market, By Geography, 2013-2019 (USD MN)
Figure 26 North America Yeast Extracts Market, By Geography, 2013–2019 (USD MN)
Figure 27 North America Sodium Reducing Agents Market: Growth Analysis,By Geography, 2013-2019 (USD MN)
Figure 28 North America Sodium Reducing Agents Market: Growth Analysis,By Geography, 2013-2019 (KT)
Figure 29 U.S. Sodium Reducing Agents Market Overview, 2014 & 2019
Figure 30 U.S. Sodium Reducing Agents Market, By Application, 2013-2019 (USD MN)
Figure 31 U.S. Sodium Reducing Agents Market: Application Snapshot
Figure 32 U.S. Sodium Reducing Agents Market, By Type, 2013-2019 (USD MN)
Figure 33 U.S. Sodium Reducing Agents Market Share, By Type, 2014-2019 (%)
Figure 34 Canada Sodium Reducing Agents Market Overview, 2014 & 2019 (%)
Figure 35 Canada Sodium Reducing Agents Market, By Application,2013-2019 (USD MN)
Figure 36 Canada Sodium Reducing Agents Market: Application Snapshot
Figure 37 Canada Sodium Reducing Agents Market, By Type, 2013-2019 (USD MN)
Figure 38 Canada Sodium Reducing Agents Market Share, By Type, 2014-2019 (%)
Figure 39 Mexico Sodium Reducing Agents Market Overview, 2014 & 2019 (%)
Figure 40 Mexico Sodium Reducing Agents Market, By Application, 2013-2019 (USD MN)
Figure 41 Mexico Sodium Reducing Agents Market: Application Snapshot
Figure 42 Mexico Sodium Reducing Agents Market, By Type, 2013-2019 (USD MN)
Figure 43 Mexico Sodium Reducing Agents Market: Type Snapshot
Figure 44 Sodium Reducing Agents Market: Market Share Analysis, 2014 (%)
Figure 45 Sodium Reducing Agents: Company Product Coverage, By Type, 2014
Figure 46 Kerry Group PLC, Revenue Mix, 2013 (%)
Figure 47 Novozymes A/S Revenue Mix, 2013 (%)
Figure 48 Tate & Lyle PLC: Revenue Mix, 2014 (%)
Sodium is indigenously used as an essential nutrient, mandatory for the smooth functioning of the body. Though sodium is important for the normal functions of the body, it is also responsible for creating hypertension or cardiovascular diseases. Therefore, it is recommended that the sodium content in most food products, which are consumed on a daily basis, be reduced. High sodium food represents severe health issues as reported by many organizations such as the World Health Organization (WHO). An average sodium intake of 1,500 mg – 2,300 mg per day is tolerable to lead a healthy life for an adult. However, according to recent data available, Canadians and Americans consume 3,400 mg per day, which would lead to chronic diseases in most of the adult population in forthcoming years.
Altering the food consumption habits of a particular population is a difficult task. The dietary habits of a population rely on the social, economic, and cultural environment. Most of the sodium chloride intake is through processed foods consumed on a daily basis. Processed foods form over two thirds of the sodium consumed in the region.
The purpose of this study is to analyze the North American market for the sodium reducing agent. This report includes revenue forecasts, and market trends and opportunities for the period from 2014 to 2019. The analysis has been conducted on the various market segments derived on the basis of the application of sodium reducing agent and further segmented on the basis of sodium reducing agent type.
The North American sodium reducing agent market was valued at $281.2 million in 2014 and is projected to reach $466.4 million by 2019, at a CAGR of 10.6% during the period under consideration. The market, by application, was led by the sauces, seasonings, and snacks segment in 2014, with a 33.5% share. The mineral salts segment is the largest contributor to the North American market, among the different types of sodium reducing agents.
Please visit https://www.micromarketmonitor.com/custom-research-services.html to specify your custom Research Requirement


