

North America Coiled Tubing Services Market by Type (Well Intervention, Drilling, and Others) by Application (Onshore & Offshore) by Country (U.S., Canada, & Mexico) – Analysis and Forecasts to 2019
- Publish Date: Apr 2015


The North America Coiled Tubing market (CT market) is estimated to grow at a CAGR of 3.8% during the forecast period. To improve the recovery of oil from matured fields, companies are focusing on technological advancements in inventing tools and techniques required to access residual reserves on conventional acreages. The companies are currently focused on significantly increasing recovery and extend the life of mature fields, way beyond the natural production level. These are some of the key factors fueling the growth of the CT market. However, increase in crude oil prices is hampering production as companies are cutting costs, hindering the growth of this market. Furthermore, there are environmental concerns associated with coastal wetlands and water bodies, fisheries, underwater plumes, coral ecosystems, toxicity, and bioaccumulation along with other problems such as ocean acidification and wet land destruction. To avoid accidents, the U.S. government has imposed new regulations and policies on exploration activities in the Gulf of Mexico, a challenge faced by market players.
Emerging markets including the U.S., Canada, and Mexico have become attractive for companies engaged in the development and marketing of the CT market. Increased drilling activities, new offshore projects, redevelopment of matured field wells, reinforcement of existing reserve, increasing demand for energy are the key factors propelling the demand for CT services in the emerging markets.
In 2013, Schlumberger Limited (U.S.) held the leading position in the North America Coiled Tubing market. Over the past three years, the company adopted key business strategies such as new product launches and strategic partnerships/agreements to ensure its dominant position in the market.
Scope of the North America Coiled Tubing Services Market Report
This North America Coiled Tubing market report categorizes the North America CT market into the following segments and sub-segments:
- By types: Well intervention services, CT-based drilling, and others
- By country: U.S., Canada, Mexico
- By CT active fleet of few major companies: Schlumberger Ltd., Halliburton co., Baker Hughes Inc., Weatherford International Plc., Superior Energy Services Inc., and Nabors Industries Ltd.
Table of Contents
1 Introduction (Page No. - 11)
1.1 Objectives of the Study
1.2 Market Segmentation & Coverage
1.3 Stakeholders
2 Research Methodology (Page No. - 13)
2.1 Integrated Ecosystem of Coiled Tubing Services Market
2.2 Arriving at the Coiled Tubing Services Market Size
2.2.1 Top-Down Approach
2.2.2 Bottom-Up Approach
2.2.3 Demand-Side Approach
2.2.4 Macro Indicator-Based Approach
2.3 Assumptions
3 Executive Summary (Page No. - 20)
4 North America Coiled Tubing Market Overview (Page No. - 22)
4.1 Introduction
4.2 North America Coiled Tubing Services Market: Comparison With Parent Market
4.3 North America Coiled Tubing Services Market Drivers & Inhibitors
4.4 Key Market Dynamics
4.5 Demand-Side Analysis
5 North America Coiled Tubing Market, By Application (Page No. - 28)
5.1 Introduction
5.2 North American Coiled Tubing Services in Onshore Market, By Country
5.3 North American Coiled Tubing Services in Offshore Market, By Country
6 North America Coiled Tubing Market, By Type (Page No. - 33)
6.1 Introduction
6.2 North American Coiled Tubing Services Market, Type Comparison With Coiled Tubing Services
6.3 North American Well Intervention Market, By Country
6.4 North American Drilling Service Market, By Country
6.5 Sneak View: North American Oilfield Services Market, By Type
7 North America Coiled Tubing Market, By Country (Page No. - 39)
7.1 Introduction
7.2 Vendor-Side Analysis
7.3 U.S. Coiled Tubing Services Market
7.3.1 U.S. Coiled Tubing Services Market, By Application
7.3.2 U.S. Coiled Tubing Services Market, By Type
7.4 Canada Coiled Tubing Services Market
7.4.1 Canada Coiled Tubing Services Market, By Application
7.4.2 Canada Coiled Tubing Services Market, By Type
7.5 Mexico Coiled Tubing Services Market
7.5.1 Mexico Coiled Tubing Services Market, By Application
7.5.2 Mexico Coiled Tubing Service Market, By Type
8 North America Coiled Tubing Market: Competitive Landscape (Page No. - 53)
8.1 North America Coiled Tubing Services Market: Market Share Analysis
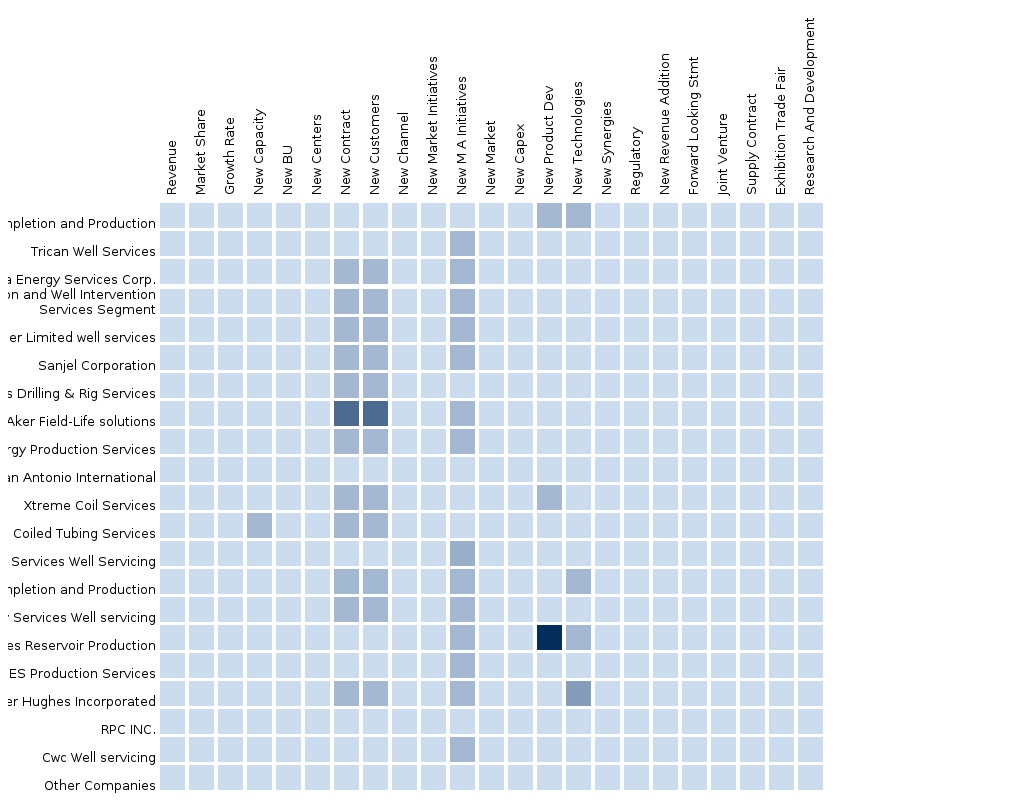
8.2 Company Presence in the Coiled Tubing Services Market, By Type
8.3 Mergers & Acquisitions
8.4 Expansions
8.5 Contract Agreements
8.6 New Product & Service Launches
8.7 Joint Ventures
9 Company Profiles (Page No. - 60)
9.1 Key Energy Services, Inc.
9.1.1 Overview
9.1.2 Key Financials
9.1.3 Product & Service Offerings
9.1.4 Recent Developments
9.1.5 MMM Analysis
9.2 Halliburton Co.
9.2.1 Overview
9.2.2 Key Financials
9.2.3 Product & Service Offerings
9.2.4 Coiled Tubing Active Fleet
9.2.5 Related Developments
9.2.6 MMM Analysis
9.3 Nabors Industries Ltd.
9.3.1 Overview
9.3.2 Key Financials
9.3.3 Product & Service Offerings
9.3.4 Related Developments
9.3.5 MMM Analysis
9.4 Sanjel Corporation.
9.4.1 Overview
9.4.2 Key Financials
9.4.3 Product & Service Offerings
9.4.4 Related Developments
9.4.5 MMM Analysis
9.5 Trican Well Service Ltd.
9.5.1 Overview
9.5.2 Key Financials
9.5.3 Product & Service Offerings
9.5.4 Coiled Tubing Active Fleet
9.5.5 Related Developments
9.5.6 MMM Analysis
9.6 Weatherford International PLC
9.6.1 Overview
9.6.2 Key Financials
9.6.3 Product&Service Offerings
9.6.4 Coiled Tubing Active Fleet
9.6.5 Related Developments
9.6.6 MMM Analysis
9.7 Superior Energy Services Inc.
9.7.1 Overview
9.7.2 Key Financials
9.7.3 Product & Service Offerings
9.7.4 Related Developments
9.7.5 MMM Analysis
9.8 Schlumberger Ltd.
9.8.1 Overview
9.8.2 Key Financials
9.8.3 Product & Service Offerings
9.8.4 Coiled Tubing Active Fleet
9.8.5 Related Developments
9.8.6 MMM Analysis
10 Appendix (Page No. - 89)
10.1 Customization Options
10.1.1 Products & Services Benchmarking Analysis
10.1.2 Regulatory Framework
10.1.3 Impact Analysis
10.1.4 Current Industry Challenges
10.1.5 Historical Data & Trends
10.1.6 Oilfield Services in Depth Value Chain Analysis
10.2 Related Reports
10.3 Introducing RT: Real Time Market Intelligence
10.3.1 RT Snapshots
List of Tables (54 Tables)
Table 1 North American Coiled Tubing Services Peer Market Size, 2013 (USD MN)
Table 2 North America Coiled Tubing Services Market: Macro Indicators,By Country, 2013
Table 3 North American Coiled Tubing Services Market: Comparison With Parent Market, 2013 - 2019 (USD MN)
Table 4 North America Coiled Tubing Services Market: Drivers and Inhibitors
Table 5 North America Coiled Tubing Services Market, By Application,2013 - 2019 (USD MN)
Table 6 North America Coiled Tubing Services Market, By Type,2013 - 2019 (USD MN)
Table 7 North America Coiled Tubing Services Market: Comparison With Application Markets, 2013 - 2019 (USD MN)
Table 8 North America Coiled Tubing Services Market, By Application,2013 - 2019 (USD MN)
Table 9 North America Coiled Tubing Services in Onshore Market, By Country, 2013 - 2019 (USD MN)
Table 10 North America Coiled Tubing Services in Offshore Market, By Country, 2013 - 2019(USD MN)
Table 11 North America Coiled Tubing Services Market, By Type, 2013 - 2019 (USD MN)
Table 12 North America Coiled Tubing Services Market: Type Comparison With Parent Market, 2013 - 2019 (USD MN)
Table 13 North American Well Intervention Market: By Country,2013 - 2019 (USD MN)
Table 14 North American Drilling Service Market, By Country, 2013 - 2019 (USD MN)
Table 15 North American CT Active Fleet Count, By Countries, 2012 – 2013 (Units)
Table 16 North American Coiled Tubing Services Market, By Country,2013 - 2019 (USD MN)
Table 17 U.S. Coiled Tubing Services Market, By Application, 2013-2019 (USD MN)
Table 18 U.S. Coiled Tubing Services Market, By Type, 2013 - 2019 (USD MN)
Table 19 Canada Coiled Tubing Services Market, By Application, 2013 - 2019 (USD MN)
Table 20 Canada Coiled Tubing Services Market, By Type, 2013 - 2019 (USD MN)
Table 21 Mexico Coiled Tubing Services Market, By Application, 2013 - 2019 (USD MN)
Table 22 Mexico Coiled Tubing Services Market, By Type, 2013 - 2019 (USD MN)
Table 23 Coiled Tubing Services Market: Market Share Analysis, 2013 (%)
Table 24 North American Coiled Tubing Services Market: Mergers & Acquisitions
Table 25 North American Coiled Tubing Service Market: Expansions
Table 26 North American Coiled Tubing Service Market: Contract Agreements
Table 27 North American Coiled Tubing Services Market: New Product & Service Launches
Table 28 North American Coiled Tubing Services Market: Joint Ventures
Table 29 Key Energy Services, Inc.: Market Revenue, By Geographic Segment,2009 – 2013 (USD MN)
Table 30 Key Energy Services, Inc.: Key Operations, 2009 – 2013 (USD MN)
Table 31 Halliburton Co: Market Revenue, By Geographic Segment,2009 – 2013 (USD MN)
Table 32 Halliburton Co: Market Revenue, By Business Segment, 2009 – 2013 (USD MN)
Table 33 Halliburton Co: Key Operations Data, 2009 – 2013 (USD MN)
Table 34 Halliburton: CT Active Fleet Count, By Geography, 2012 – 2013 (Units)
Table 35 North America: CT Active Fleet Count, By Country, 2012 – 2013 (Units)
Table 36 Nabors Industries Ltd.: Market Revenue, By Geographic Segment,2009 – 2013 (USD MN)
Table 37 Nabors Industries, Inc.: Key Operations Data, 2009 - 2013 (USD MN)
Table 38 Trican Well Service Ltd.: Market Revenue, By Geographic Segment,2009 – 2013 (USD MN)
Table 39 Trican Well Service Ltd.: Key Operations Data, 2009 – 2013 (USD MN)
Table 40 Trican: CT Active Fleet Count, By Geography, 2012 – 2013 (Units)
Table 41 North America: CT Active Fleet Count, By Country, 2012 – 2013 (Units)
Table 42 Weatherford International PLC: Revenue, By Business Segment,2009 – 2013 (USD MN)
Table 43 Weatherford International PLC: Revenue, By Geographic Segment,2009 – 2013 (USD MN)
Table 44 Weatherford International PLC: Key Operations Data, 2009 – 2013 (USD MN)
Table 45 Weatherford: CT Active Fleet Count, By Geography, 2012 – 2013 (Units)
Table 46 North America: CT Active Fleet Count, By Country,2012 – 2013 (Units)
Table 47 Superior Energy Services Inc.: Revenue, By Business Segment,2009 – 2013 (Usd Mn
Table 48 Superior Energy Services Inc: Revenue, By Geographic Segment, 2009 – 2013 (USD MN)
Table 49 Superior Energy Services Inc.: Key Operations, 2009 - 2013 (USD MN)
Table 50 Schlumberger Ltd.: Revenue, By Business Segment, 2009 – 2013 (USD MN)
Table 51 Schlumberger Ltd.: Revenue, By Geographic Segment, 2009 – 2013 (USD MN)
Table 52 Schlumberger Ltd.: Key Operations Data, 2009 – 2013 (USD MN)
Table 53 Schlumberger: CT Active Fleet Count, By Geography,2012 – 2013 (Units)
Table 54 North America: CT Active Fleet Count, By Country, 2012 – 2013 (Units)
List of Figures (44 Figures)
Figure 1 North America Coiled Tubing Market: Segmentation & Coverage
Figure 2 Coiled Tubing Services Market: Integrated Ecosystem
Figure 3 Research Methodology
Figure 4 Top-Down Approach
Figure 5 Bottom-Up Approach
Figure 6 Demand-Side Approach
Figure 7 North America Coiled Tubing Market: Number of New Wells,2013
Figure 8 North America Coiled Tubing Market Snapshot 2013
Figure 9 North America Coiled Tubing Market, By Application, 2014 vs 2019
Figure 10 North America Coiled Tubing Services, By Type & Country, 2013 (USD MN)
Figure 11 North America Coiled Tubing Market: Comparison With Application Markets, 2013 - 2019 (USD MN)
Figure 12 Coiled Tubing Services Market: Application Market Scenario
Figure 13 North America Coiled Tubing Market, Bycountry,2014 & 2019 (USD MN)
Figure 14 North America Coiled Tubing Services in Onshore Market, By Country, 2013 - 2019 (USD MN)
Figure 15 North American Coiled Tubing Services in Offshore Market, By Country, 2013 - 2019 (USD MN)
Figure 16 North America Coiled Tubing Market, By Type, 2014 - 2019 (USD MN)
Figure 17 North America Coiled Tubing Market: Type Comparison With Coiled Tubing Services, 2013 - 2019 (USD MN)
Figure 18 North American Well Intervention Market, By Country,2013 - 2019 (USD MN)
Figure 19 North American Drilling Market, By Country, 2013 - 2019 (USD MN)
Figure 20 North American Coiled Tubing Services Market: Growth Analysis,By Country, 2013 - 2019 (USD MN)
Figure 21 U.S. Coiled Tubing Services Market Overview, 2014 & 2019 (%)
Figure 22 U.S. Coiled Tubing Services Market, By Application, 2013 - 2019 (USD MN)
Figure 23 U.S. Coiled Tubing Services Market: Application Snapshot
Figure 24 U.S. Coiled Tubing Services Market, By Type, 2013 - 2019 (USD MN)
Figure 25 U.S. Coiled Tubing Services Market Share, By Type, 2013 - 2019 (%)
Figure 26 Canada Coiled Tubing Services Market Overview, 2014 & 2019 (%)
Figure 27 Canada Coiled Tubing Services Market, By Application, 2013 - 2019 (USD MN)
Figure 28 Canada Coiled Tubing Services Market: Application Snapshot
Figure 29 Canada Coiled Tubing Services Market, By Type, 2013 - 2019 (USD MN)
Figure 30 Canada Coiled Tubing Services Market Share, By Type, 2014 & 2019 (%)
Figure 31 Mexico Coiled Tubing Services Market Overview, 2014 & 2019 (%)
Figure 32 Mexico Coiled Tubing Services Market, By Application, 2013 - 2019 (USD MN)
Figure 33 Mexico Coiled Tubing Services Market: Application Snapshot
Figure 34 Mexico Coiled Tubing Services Market, By Type, 2013 - 2019 (USD MN)
Figure 35 Mexico Coiled Tubing Services Market: Type Snapshot
Figure 36 Coiled Tubing Services Market: Market Share Analysis, 2013
Figure 37 Coiled Tubing Services: Company Product Coverage, By Type, 2013
Figure 38 Superior Energy Services: Revenue Mix, 2013 (%)
Figure 39 Halliburton Co: Revenue Mix, 2013 (%)
Figure 40 Nabours Industries Ltd.: Revenue Mix, 2013 (%)
Figure 41 Trican: Revenue Mix, 2013 (%)
Figure 42 Weatherford International PLC: Revenue Mix, 2013 (%)
Figure 43 Superior Energy Services Inc.: Revenue Mix, 2013 (%)
Figure 44 Schlumberger Ltd: Revenue Mix, 2013(%)
North America Coiled Tubing (CT) services market has been segmented into application, service, and country. The application segment has been further divided into onshore and offshore. The CT service market includes well intervention, drilling, and other services. The CT market on the basis of country has been categorized into the U.S., Canada, and Mexico.
The North America CT services market is estimated to grow at a CAGR of 3.8% during the forecast period.
The CT services market is primarily driven by increased drilling activities, new offshore projects, redevelopment of matured field wells, and reinforcement of existing reserve. With an increase in the number of mature fields, there has been a decline in the production of oil, drawing the attention of exploration & production companies towards the innovation of the current existing products. This has led to an increase in investments in the energy sector, especially in shale gas development projects, leading to the growth of the market for CT. However, increasing crude oil prices, high competition, and regulatory issues are the major challenges for the oilfield service industry.
With an increase in energy demand, subsea exploration and well construction have experienced rapid growth. Additionally, with the aging of the existing onshore wells, huge investments are needed to explore and drill new ones. Moreover, the U.S., Canada, and Mexico oil production is onshore and in mature fields, expanding the need for well cleaning and pumping operations.
New product launches and geographical expansions are the key strategies that have been adopted by the major players to develop their position in the CT services market. Growth strategies such as partnerships, agreements, collaborations, joint ventures, and acquisitions have also been adopted by a significant number of market players to strengthen their product portfolios and to expand their geographic presence.
The North America CT market is dominated by a few global players, such as Schlumberger Ltd. (U.S.), Halliburton Co. (U.S.), Baker Hughes Inc. (U.S.), Weatherford International Plc. (Switzerland), and Superior Energy Services Inc. (U.S.).
Please visit https://www.micromarketmonitor.com/custom-research-services.html to specify your custom Research Requirement
| PRODUCT TITLE | PUBLISHED | |
|---|---|---|
|
|
South America Oilfield Services The oilfield services market in South America was valued around $14.04 billion in 2013, with a market share of 9.3% globally. Projected to grow at a CAGR of 17% from 2014 to 2019, the market is led by Weatherford, Halliburton, Schlumberger, and Baker Hughes. It is segmented on the basis of types of oilfield services and countries present in the region. |
Apr 2015 |
|
|
Asia-Pacific Oilfield Services The oilfield services market in Asia Pacific was valued around $31598 million in 2013, with a market share of almost 20% globally. Projected to grow at a CAGR of 14% from 2014 to 2019, the market is led by Weatherford, Halliburton, Schlumberger, and Baker Hughes. It is segmented on the basis of types of oilfield services and countries in the region. |
Apr 2015 |
|
|
Middle East Oilfield Services Middle East oilfield services market was valued at $73,405.6 million in 2014 and is projected to grow at a CAGR of 4.2% from 2014 to 2019 to reach a market size of $90,150.1 by 2019. The large share is attributed to the rise in exploration of new reserves which requires increased drilling activities. |
May 2015 |
|
|
Africa Oilfield Services The oilfield services market in Africa was valued around $7642 million in 2013, with a market share of 5% globally. Projected to grow at a CAGR of 14.4% from 2014 to 2019, the market is led by Weatherford, Halliburton, Schlumberger, and Baker Hughes. It is segmented on the basis of types of oilfield services and countries present in the region. |
Apr 2015 |
|
|
Europe Oilfield Services The European oilfield services market was valued at $45,592.5 million in 2014, and is projected to reach $60,017.5 million by 2019, at a CAGR of 5.7% from 2014 to 2019. The growth of this market can be attributed to the rise in exploration activities of new reserves, which requires increased drilling activities. The drilling services segment accounted for the largest share of 59.2% of the European oilfield services market in 2014. |
Apr 2015 |
|
|
North America Oilfield Services The oilfield services market in North America was valued around $76.85 billion in 2013, with a market share of 50.8% globally. Projected to grow at a CAGR of 9.8% from 2014 to 2019, the market is led by Weatherford, Halliburton, Schlumberger, and Baker Hughes. It is segmented on the basis of types of oilfield services and countries present in the region. |
Upcoming |


