

Middle East Oilfield Services Market by Type (Coiled Tubing Services, Well Completion, Drilling Fluids, Drilling Services, OCTG, Wireline Services & Others), by Application (Onshore & Offshore), by Country – Analysis and Forecasts to 2019
- Publish Date: May 2015


The purpose of this report is to cover the definition, description, and forecast the Middle East oilfield services market. It involves a deep dive analysis of the market segmentation, which is based on type and country. The report also gives deep insights into the competitive landscape of the market through a strategic analysis of the key players of the market. The oilfield services market, in terms of types, has been segmented into coiled tubing services, completion equipment & services, drilling & completion fluids, drilling waste management, OCTG, pressure pumping services, well intervention services, and wireline services.
Oilfield services are used during all stages of lifecycle of a well including exploration, drilling, development, completion, production, intervention, and abandonment.
Middle East oilfield services market was valued at $73,405.6 million in 2014 and is projected to grow at a CAGR of 4.2% from 2014 to 2019 to reach a market size of $90,150.1 by 2019. The large share is attributed to the rise in exploration of new reserves which requires increased drilling activities.
The drilling services market accounted for the largest market share of 86.3% within the Middle East oilfield services market in 2014.
The major companies operating in the Middle East oilfield services market are Halliburton Co. (U.S.), Schlumberger Ltd. (U.S.), Baker Hughes Inc. (U.S.), Weatherford International Ltd. (Ireland), and Superior Energy Services (U.S.).
Market share analysis, by revenue, of the top companies is also included in the report. The scope accordingly aids market participants to identify high growth markets and helps manage key investment decisions. For this report, major players in the Middle East oilfield services market have been identified through various primary and secondary sources, which include annual reports of top market players, interviews with key opinion leaders such as CEOs, directors, and marketing people. Based on this research, the market shares have been evaluated and validated.
Table of Contents
1 Introduction (Page No. - 10)
1.1 Objectives of the Study
1.2 Market Segmentation & Coverage
1.3 Stakeholders
2 Research Methodology (Page No. - 12)
2.1 Integrated Ecosystem of Oilfield Services Market
2.2 Arriving at the Oilfield Services Market Size
2.2.1 Top-Down Approach
2.2.2 Bottom-Up Approach
2.2.3 Demand Side Approach
2.2.4 Macro Indicator-Based Approach
2.3 Assumptions
3 Executive Summary (Page No. - 19)
4 Market Overview (Page No. - 21)
4.1 Introduction
4.2 Oilfield Services Market: Comparison With Parent Market
4.3 Market Drivers and Inhibitors
4.4 Key Market Dynamics
4.5 Demand Side Analysis
5 Oilfield Services Market, By Application (Page No. - 27)
5.1 Introduction
5.2 Middle East Oilfield Services in Onshore, By Country
5.3 Middle East Oilfield Services in Offshore, By Country
6 Middle East Oilfield Services Market, By Type (Page No. - 32)
6.1 Introduction
6.2 Middle East Oilfield Services Market: Type Comparison With Parent Market
6.3 Middle East Drilling Services Market, By Country
6.4 Middle East Coiled Tubing Services Market, By Country
6.5 Middle East Drilling Fluids Market, By Country
6.6 Middle East Oil Country Tubular Goods Market, By Country
6.7 Middle East Oilfield Equipment Rental Market, By Country
6.8 Middle East Pressure Pumping Services Market, By Country
6.9 Middle East Well Completion Market, By Country
6.10 Middle East Well Intervention Market, By Country
6.11 Middle East Wireline Services Market, By Country
7 Middle East Oilfield Services Market, By Country (Page No. - 45)
7.1 Introduction
7.2 Saudi Arabia Oilfield Services Market
7.2.1 Saudi Arabia Oilfield Services Market, By Application
7.2.2 Saudi Arabia Oilfield Services Market, By Type
7.3 UAE Oilfield Services Market
7.3.1 UAE Oilfield Services Market, By Application
7.3.2 UAE Oilfield Services Market, By Type
7.4 Qatar Oilfield Services Market
7.4.1 Qatar Oilfield Services Market, By Application
7.4.2 Qatar Oilfield Services Market, By Type
7.5 Oman Oilfield Services Market
7.5.1 Oman Oilfield Services Market, By Application
7.5.2 Oman Oilfield Services Market, By Type
8 Middle East Oilfield Services Market: Competitive Landscape (Page No. - 62)
8.1 Middle East Oilfield Services Market: Company Share Analysis
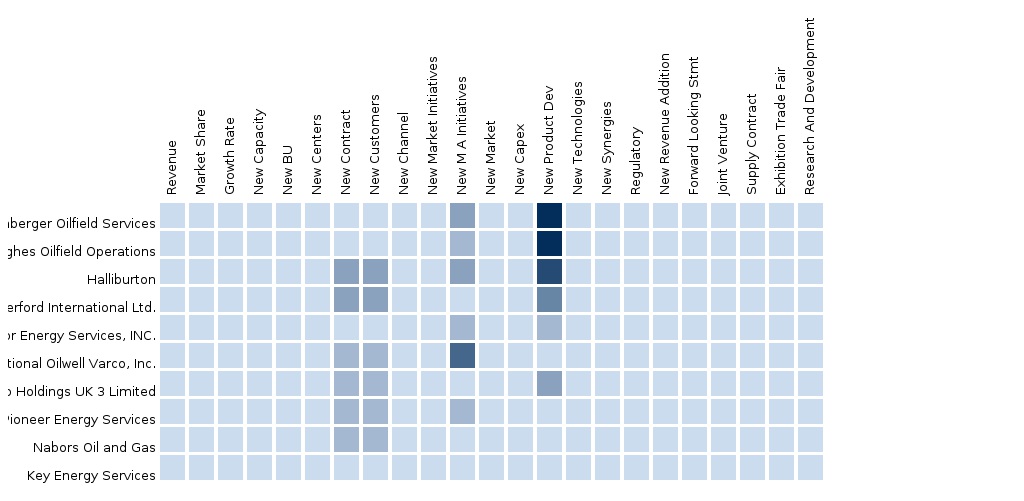
8.2 Company Presence in Middle East Oilfield Services Market, By Type
8.3 Mergers & Acquisitions
8.4 New Product Launch
9 Middle East Oilfield Services Market, By Company (Page No. - 66)
(Overview, Financials, Products & Services, Strategy, and Developments)*
9.1 Baker Hughes Inc.
9.2 Halliburton Co.
9.3 Nabors Industries Ltd.
9.4 Schlumberger Ltd.
9.5 Superior Energy Services Inc.
9.6 Weatherford International PLC
*Details on Overview, Financials, Product & Services, Strategy, and Developments Might Not be Captured in Case of Unlisted Company
10 Appendix (Page No. - 93)
10.1 Customization Options
10.1.1 Products and Services Benchmarking Analysis
10.1.2 Regulatory Framework
10.1.3 Impact Analysis
10.1.4 Current Industry Challenges
10.1.5 Historical Data and Trends
10.1.6 Oilfield Services in Depth Value Chain Analysis
10.2 Related Reports
10.3 Introducing RT: Real Time Market Intelligence
10.3.1 RT Snapshots
List of Tables (55 Tables)
Table 1 Global Oilfield Services Market Size, 2013 (USD MN)
Table 2 Middle East Oilfield Services Market By Application, 2013 (USD MN)
Table 3 Middle East Oilfield Services Market: Macro Indicators, By Country, 2013
Table 4 Middle East Oilfield Services Market: Comparison With Parent Market, 2013 – 2019 (USD MN)
Table 5 Middle East Oilfield Services Market: Drivers and Inhibitors
Table 6 Middle East Oilfield Services Market, By Application, 2013 - 2019 (USD MN)
Table 7 Middle East Oilfield Services Market, By Type, 2013 - 2019 (USD MN)
Table 8 Middle East Oilfield Services Market: Comparison With Application Markets, 2013 - 2019 (USD MN)
Table 9 Middle East Oilfield Services Market, By Application, 2013-2019 (USD MN)
Table 10 Middle East Oilfield Services Market in Onshore, By Country, 2013-2019 (USD MN)
Table 11 Middle East Oilfield Services Market in Offshore, By Country,2013-2019 (USD MN)
Table 12 Middle East Oilfield Services Market, By Type, 2013-2019 (USD MN)
Table 13 Middle East Oilfield Services Market: Type Comparison With Parent Market, 2013–2019 (USD MN)
Table 14 Middle East Drilling Services Market, By Country, 2013 – 2019 (USD MN)
Table 15 Middle East Coiled Tubing Services Market, By Country, 2013 - 2019 (USD MN)
Table 16 Middle East Drilling Fluids Market, By Country, 2013-2019 (USD MN)
Table 17 Middle East Oil Country Tubular Goods Market, By Country, 2013 - 2019 (USD MN)
Table 18 Middle East Oilfield Equipment Rental Market, By Country, 2013–2019 (USD MN)
Table 19 Middle East Pressure Pumping Services Market, By Country, 2013–2019 (USD MN)
Table 20 Middle East Well Completion Market, By Country, 2013–2019 (USD MN)
Table 21 Middle East Well Intervention Market, By Country, 2013–2019 (USD MN)
Table 22 Middle East Wireline Services Market, By Country, 2013–2019 (USD MN)
Table 23 Middle East Oilfield Services Market, By Country, 2013-2019 (USD MN)
Table 24 Saudi Arabia Oilfield Services Market, By Application, 2013-2019 (USD MN)
Table 25 Saudi Arabia Oilfield Services Market, By Type, 2013-2019 (USD MN)
Table 26 UAE Oilfield Services Market, By Application, 2013-2019 (USD MN)
Table 27 UAE Oilfield Services Market, By Type, 2013-2019 (USD MN)
Table 28 Qatar Oilfield Services Market, By Application, 2013-2019 (USD MN)
Table 29 Qatar Oilfield Services Market, By Type, 2013-2019 (USD MN)
Table 30 Oman Oilfield Services Market, By Application, 2013-2019 (USD MN)
Table 31 Oman Oilfield Services Market, By Type, 2013-2019 (USD MN)
Table 32 Middle East Oilfield Services Market: Company Share Analysis, 2013 (%)
Table 33 Middle East Oilfield Services Market: Mergers & Acquisitions
Table 34 Middle East Oilfield Services Market: New Product Launch
Table 35 Middle East Oilfield Services Market: Joint Ventures
Table 36 Baker Hughes Inc.: Key Financials, 2009-2013 (USD MN)
Table 37 Baker Hughes Inc.: Revenue, By Business Segment, 2009-2013 (USD MN)
Table 38 Baker Hughes Inc.: Revenue, By Geographic Segment, 2009-2013 (USD MN)
Table 39 Baker Hughes Inc.: Related Developments
Table 40 Halliburton Co.: Key Financials, 2009-2013 (USD MN)
Table 41 Halliburton Co.: Revenue, By Business Segment, 2009-2013 (USD MN)
Table 42 Halliburton Co.: Revenue, By Geographic Segment, 2009-2013 (USD MN)
Table 43 Halliburton Co.: Related Developments
Table 44 Nabors Industries Ltd.: Key Financials, 2009-2013 (USD MN)
Table 45 Nabors Industries Ltd.: Revenue, By Geographic Segment, 2009-2013 (USD MN)
Table 46 Schlumberger Ltd.: Key Financials , 2009-2013 (USD MN)
Table 47 Schlumberger Ltd.: Revenue, By Business Segment, 2009-2013 (USD MN)
Table 48 Schlumberger Ltd.: Revenue, By Geographic Segment, 2009-2013 (USD MN)
Table 49 Schlumberger Ltd.: Related Developments
Table 50 Superior Energy Services Inc.: Key Financials, 2009-2013 (USD MN)
Table 51 Superior Energy Services Inc .: Revenue, By Business Segment 2009-2013 (USD MN)
Table 52 Superior Energy Services Inc.: Revenue, By Geographic Segment, 2009-2013 (USD MN)
Table 53 Superior Energy Services Inc.: Related Developments
Table 54 Weatherford International PLC: Key Financials, 2009-2013 (USD MN)
Table 55 Weatherford International PLC: Revenue, By Business Segment, 2009-2013 (USD MN)
Table 56 Weatherford International PLC: Revenue, By Geographic Segment 2009-2013 (USD MN)
Table 57 Weatherford International PLC: Related Developments
List of Figures (55 Figures)
Figure 1 Middle East Oilfield Services Market: Segmentation & Coverage
Figure 2 Oilfield Services Market: Integrated Ecosystem
Figure 3 Research Methodology
Figure 4 Top-Down Approach
Figure 5 Bottom-Up Approach
Figure 6 Demand Side Approach
Figure 7 Macro Indicator-Based Approach, 2013
Figure 8 Middle East Oilfield Services Market Snapshot
Figure 9 Oilfield Services Market: Growth Aspects
Figure 10 Middle East Oilfield Services Market, By Application, 2014 & 2019
Figure 11 Middle East Oilfield Services Types, By Country, 2013 (USD MN)
Figure 12 Oilfield Services : Application Market Scenario
Figure 13 Middle East Oilfield Services Market, By Application, 2014 - 2019 (USD MN)
Figure 14 Middle East Oilfield Services Market in Onshore, By Country,2013 - 2019 (USD MN)
Figure 15 Middle East Oilfield Services Market in Offshore, By Country, 2013 - 2019 (USD MN)
Figure 16 Middle East Oilfield Services Market, By Type, 2014 - 2019 (USD MN)
Figure 17 Middle East Oilfield Services Market: Type Comparison With Parent Market, 2013–2019 (USD MN)
Figure 18 Middle East Drilling Services Market, By Country, 2013–2019 (USD MN)
Figure 19 Middle East Coiled Tubing Services Market, By Country, 2013 - 2019 (USD MN)
Figure 20 Middle East Drilling Fluids Market, By Country, 2013 - 2019 (USD MN)
Figure 21 Middle East Oil Country Tubular Goods Market, By Country, 2013 - 2019 (USD MN)
Figure 22 Middle East Oilfield Equipment Rental Market, By Country, 2013–2019 (USD MN)
Figure 23 Middle East Pressure Pumping Services Market, By Country, 2013–2019 (USD MN)
Figure 24 Middle East Well Completion Market, By Country, 2013–2019 (USD MN)
Figure 25 Middle East Well Intervention Market, By Country , 2013–2019 (USD MN)
Figure 26 Middle East Wireline Services Market, By Country, 2013–2019 (USD MN)
Figure 27 Middle East Oilfield Services Market: Growth Analysis, By Country, 2014-2019 (USD MN)
Figure 28 Saudi Arabia Oilfield Services Market Overview, 2014 & 2019 (%)
Figure 29 Saudi Arabia Oilfield Services Market, By Application, 2013-2019 (USD MN)
Figure 30 Saudi Arabia Oilfield Services Market: Application Snapshot
Figure 31 Saudi Arabia Oilfield Services Market, By Type, 2013-2019 (USD MN)
Figure 32 Saudi Arabia Oilfield Services Market Share, By Type, 2014-2019 (%)
Figure 33 UAE Oilfield Services Market Overview, 2014 & 2019 (%)
Figure 34 UAE Oilfield Services Market, By Application, 2013-2019 (USD MN)
Figure 35 UAE Oilfield Services Market: Application Snapshot
Figure 36 UAE Oilfield Services Market, By Type, 2013-2019 (USD MN)
Figure 37 UAE Oilfield Services Market Share, By Type, 2014-2019 (%)
Figure 38 Qatar Oilfield Services Market Overview, 2014 & 2019 (%)
Figure 39 Qatar Oilfield Services Market, By Application, 2013-2019 (USD MN)
Figure 40 Qatar Oilfield Services Market: Application Snapshot
Figure 41 Qatar Oilfield Services Market, By Type, 2013-2019 (USD MN)
Figure 42 Qatar Oilfield Services Market Share, By Type, 2014-2019 (%)
Figure 43 Oman Oilfield Services Market Overview, 2014 & 2019 (%)
Figure 44 Oman Oilfield Services Market, By Application, 2013-2019 (USD MN)
Figure 45 Oman Oilfield Services Market: Application Snapshot
Figure 46 Oman Oilfield Services Market, By Type, 2013-2019 (USD MN)
Figure 47 Oman Oilfield Services Market Share, By Type, 2014-2019 (%)
Figure 48 Middle East Oilfield Services Market: Company Share Analysis, 2013 (%)
Figure 49 Middle East Oilfield Services Market: Company Product Coverage, By Type, 2013
Figure 50 Baker Hughes Inc.: Revenue Mix, 2013 (%)
Figure 51 Halliburton Co.: Revenue Mix, 2013(%)
Figure 52 Nabours Industries Ltd.: Revenue Mix, 2013(%)
Figure 53 Schlumberger Ltd.: Revenue Mix, 2013(%)
Figure 54 Superior Energy Services Inc.: Revenue Mix, 2013(%)
Figure 55 Weatherford International PLC: Revenue Mix, 2013(%)
Oilfield services are required by oil and natural gas companies during various phases of the lifecycle of a well including drilling, completion, stimulation, intervention, production and others. In this report the market is analyzed on the basis of type of services offered by oilfield service companies to support exploration and production activities.
Potential increase in recoverable resources, exploration and production is the most important driver for the oilfield services market. The oilfield market continues to grow at an increasing pace, as oil and gas operators continue to discover new oil & gas field reserves where oilfield services are required.
The oilfield service market in the Middle East was valued at $73,405.6 million in 2014, and is projected to reach market size of $90,150.1 million by 2019, at a CAGR of 4.2% from 2014 and 2019. The market segment in Saudi Arabia commanded the largest share of 24% in this market in 2014, and is projected to reach a value of $22,014.2 million by 2019, at a CAGR of 4.5% from 2014 to 2019.
An in-depth market share analysis, by revenue, of the top companies is included in the report. These numbers are arrived at, based on key facts, annual financial information from annual reports and interviews with industry experts and key opinion leaders, such as CEOs, directors, and marketing executives. Top market players who have established their base in the Middle East oilfield service market are Halliburton Co. (U.S.), Schlumberger Ltd. (U.S.), Baker Hughes Inc. (U.S.), Weatherford International Ltd. (Ireland), and Superior Energy Services (U.S.).
Please visit https://www.micromarketmonitor.com/custom-research-services.html to specify your custom Research Requirement


