

South America Oilfield Services Market By Type (Coiled Tubing Services, Well Completion, Drilling Fluids, Drilling Services, OCTG, Wireline Services & Others), by Application (Onshore & Offshore) by Countries - Trends and forecasts to 2019
- Publish Date: Apr 2015


This report covers the description, definition, and forecast of the South American oilfield services market. It involves a DeepDive analysis of the market segmentation, which is based on the type of services, applications, and country. The report also provides deep insights into the competitive landscape of the market through a strategic analysis of the key players of the market. The major types of oilfield services include pressure pumping services, OCTG, drilling services, and oilfield equipment rental, among others.
The growing demand for energy with an increase in the number of investments in offshore and unconventional exploration and production activities is expected to drive the global oilfield services market. The South American oilfield services market is estimated to grow at a CAGR of 5.8% from 2014 to 2019. Pressure pumping services accounted for 6.8% of the market share of the South American oilfield services market in 2014. Pressure pumping is the propagation of fractures through layers of rock using pressurized fracturing fluid, before pumping the cement into the well bore to complete it. This technique is primarily used to extract resources from low permeability reservoirs such as shale gas, tight gas, and unconventional liquids, which are difficult to recover through regular drilling procedures. Pressure pumping services are provided by oilfield service companies (such as Halliburton) to oil and gas companies (such as Shell).
In terms of countries, Brazil was the biggest market, followed by Venezuela and Argentina, in 2014.
This report covers the South America oilfield services market by the intensity of drilling and exploration activities along with the reinforcement of existing crude oil reserves. It highlights some of the key industrial issues and market impulse factors. It also describes some of the important market dynamics such as drivers and restraints of the South America oilfield services market.
For this report, the major players in the market are identified through secondary and primary research, based on which their market shares are evaluated. This includes a study of the annual reports of top market players and interviews with key opinion leaders such as the CEOs, Directors, and marketing people.
Table of Contents
1 Introduction (Page No. - 12)
1.1 Objectives of the Study
1.2 Market Segmentation & Coverage
1.3 Stakeholders
2 Research Methodology (Page No. - 14)
2.1 Integrated Ecosystem of Oilfield Services Market
2.2 Arriving at the Oilfield Services Market Size
2.2.1 Top-Down Approach
2.2.2 Bottom-Up Approach
2.2.3 Demand Side Approach
2.2.4 Macro Indicator-Based Approach
2.3 Assumptions
3 Executive Summary (Page No. - 23)
4 Market Overview (Page No. - 25)
4.1 Introduction
4.2 South America Oilfield Services Market: Comparison With the Parent Market
4.3 Market Drivers and Inhibitors
4.4 Key Market Dynamics
4.5 Demand Side Analysis
5 South America Oilfield Services Market, By Application (Page No. - 31)
5.1 Introduction
5.2 Oilfield Services Market in Onshore, By Country
5.3 Oilfield Services Market in Offshore, By Country
6 South America Oilfield Services Market, By Type (Page No. - 36)
6.1 Introduction
6.2 South America Oilfield Services Market, Type Comparison With the Oil and Gas Industry
6.3 South America Drilling Services Market, By Country
6.4 South America Coiled Tubing Services Market, By Country
6.5 South America Oilfield Equipment Rental Market, By Country
6.6 South America Drilling Fluids Market, By Country
6.7 South America Well Completion Market, By Country
6.8 South America Oil Country Tubular Goods (OCTG) Market, By Country
6.9 South America Pressure Pumping Services Market, By Country
6.10 South America Well Intervention Market, By Country
6.11 South America Wireline Services Market, By Country
7 South America Oilfield Services Market, By Country (Page No. - 49)
7.1 Introduction
7.2 Brazil Oilfield Services Market
7.2.1 Brazil Oilfield Services Market, By Application
7.2.2 Brazil Oilfield Services Market, By Type
7.3 Venezuela Oilfield Services Market
7.3.1 Venezuela Oilfield Services Market, By Application
7.3.2 Venezuela Oilfield Services Market, By Type
7.4 Argentina Oilfield Services Market
7.4.1 Argentina Oilfield Services Market, By Application
7.4.2 Argentina Oilfield Services Market, By Type
8 South America Oilfield Services Market: Competitive Landscape (Page No. - 63)
8.1 South America Oilfield Services Market: Company Share Analysis
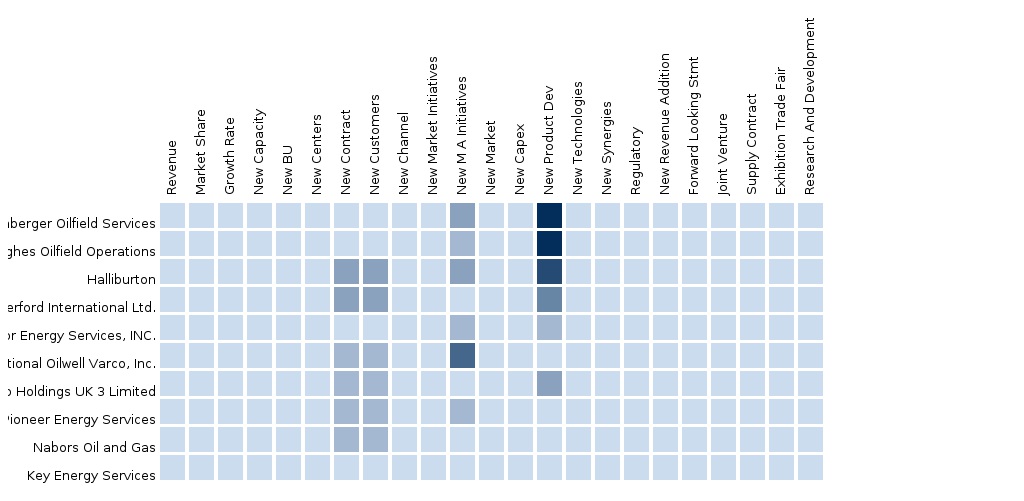
8.2 Company Presence in Oilfield Services Market, By Type
8.3 Mergers & Acquisitions
8.4 Expansions
8.5 New Product Launch
8.6 New Service Launch
8.7 Others
9 South America Oilfield Services Market, By Company (Page No. - 70)
9.1 Schlumberger Ltd.
9.1.1 Overview
9.1.2 Company Financials
9.1.3 Product and Service Offerings
9.1.4 Company Developments
9.1.5 MMM View
9.2 Halliburton Co.
9.2.1 Overview
9.2.2 Company Financials
9.2.3 Product and Service Offerings
9.2.4 Company Developments
9.2.5 MMM View
9.3 Baker Hughes Inc.
9.3.1 Overview
9.3.2 Company Financials
9.3.3 Product and Service Offerings
9.3.4 Company Developments
9.3.5 MMM View
9.4 Weatherford International PLC
9.4.1 Overview
9.4.2 Company Financials
9.4.3 Product and Service Offerings
9.4.4 Company Developments
9.4.5 MMM View
9.5 Superior Energy Services Inc.
9.5.1 Overview
9.5.2 Company Financials
9.5.3 Product and Service Offerings
9.5.4 Company Developments
9.5.5 MMM View
9.6 Nabors Industries Ltd.
9.6.1 Overview
9.6.2 Company Financials
9.6.3 Product and Service Offerings
9.6.4 Company Developments
9.6.5 MMM View
9.7 Expro International Group
9.7.1 Overview
9.7.2 Company Financials
9.7.3 Product and Service Offerings
9.7.4 Company Developments
9.7.5 MMM View
9.8 National Oilwell Varco Inc.
9.8.1 Overview
9.8.2 Company Financials
9.8.3 Product and Service Offerings
9.8.4 Company Developments
9.8.5 MMM View
10 Appendix (Page No. - 105)
10.1 Customization Options
10.1.1 Products and Services Benchmarking Analysis
10.1.2 Regulatory Framework
10.1.3 Impact Analysis
10.1.4 Current Industry Challenges
10.1.5 Historical Data and Trends
10.1.6 Oilfield Services In-Depth Value Chain Analysis
10.2 Related Reports
10.3 Introducing RT: Real-Time Market Intelligence
10.3.1 RT Snapshots
List of Tables (69 Tables)
Table 1 Global Oilfield Services Peer Market Size, 2013 (USD MN)
Table 2 South America Oilfield Services Market Macro Indicators, By Country, 2013
Table 3 South America Oilfield Services Market: Comparison With the Parent Market, 2013 – 2019 (USD MN)
Table 4 South America Oilfield Services Market: Drivers and Inhibitors
Table 5 South America Oilfield Services Market, By Application, 2013 - 2019 (USD MN)
Table 6 South America Oilfield Services Market, By Type, 2013 - 2019 (USD MN)
Table 7 South America Oilfield Services Market: Comparison With the Application Markets, 2013 - 2019 (USD MN)
Table 8 South America Oilfield Services Market, By Application, 2013 - 2019 (USD MN)
Table 9 South America Oilfield Services Market in Onshore, By Country, 2013 - 2019 (USD MN)
Table 10 South America Oilfield Services Market in Offshore, By Country, 2013 - 2019 (USD MN)
Table 11 South America Oilfield Services Market, By Type, 2013 - 2019 (USD MN)
Table 12 South America Oilfield Services Market: Type Comparison With the Parent Market, 2013–2019 (USD MN)
Table 13 South America Drilling Services Market, By Country, 2013–2019 (USD MN)
Table 14 South America Coiled Tubing Services Market, By Country, 2013–2019 (USD MN)
Table 15 South America Oilfield Equipment Rental Market, By Country, 2013 - 2019 (USD MN)
Table 16 South America Drilling Fluids Market, By Country, 2013 - 2019 (USD MN)
Table 17 South America Well Completion Market, By Country, 2013 - 2019 (USD MN)
Table 18 South America Oil Country Tubular Goods (OCTG) Market, By Country, 2013–2019 (USD MN)
Table 19 South America Pressure Pumping Services Market, By Country, 2013–2019 (USD MN)
Table 20 South America Well Intervention Market, By Country, 2013–2019 (USD MN)
Table 21 South America Wireline Services Market, By Country, 2013–2019 (USD MN)
Table 22 South America Oilfield Services Market, By Country, 2013 - 2019 (USD MN)
Table 23 Brazil Oilfield Services Market, By Application, 2013-2019 (USD MN)
Table 24 Brazil Oilfield Services Market, By Type, 2013 - 2019 (USD MN)
Table 25 Venezuela Oilfield Services Market, By Application, 2013 - 2019 (USD MN)
Table 26 Venezuela Oilfield Services Market, By Type, 2013 - 2019 (USD MN)
Table 27 Argentina Oilfield Services Market, By Application, 2013 – 2019 (USD MN)
Table 28 Argentina Oilfield Services Market, By Type, 2013 - 2019 (USD MN)
Table 29 South America Oilfield Services Market: Company Share Analysis, 2013 (%)
Table 30 South America Oilfield Services Market: Mergers & Acquisitions
Table 31 South America Oilfield Services Market: Expansions
Table 32 South America Oilfield Services Market: New Product Launch
Table 33 South America Oilfield Services Market: New Service Launch
Table 34 South America Oilfield Services Market: Others
Table 35 Schlumberger Ltd.: Key Financials , 2009-2013 (USD MN)
Table 36 Schlumberger Ltd.: Net Sales, By Business Segment, 2009-2013 (USD MN)
Table 37 Schlumberger Ltd.: Product and Service Offerings
Table 38 Schlumberger Ltd.: Related Developments
Table 39 Halliburton Co.: Key Financials 2009-2013 (USD MN)
Table 40 Halliburton Co.: Net Sales, By Business Segment, 2009-2013 (USD MN)
Table 41 Halliburton Co.: Net Sales, By Geographic Segment, 2009-2013 (USD MN)
Table 42 Halliburton Co.: Product and Service Offerings
Table 43 Halliburton Co.: Related Developments
Table 44 Baker Hughes Inc.: Key Financials, 2009-2013 (USD MN)
Table 45 Baker Hughes Inc.: Net Sales, By Geographic Segment, 2009-2013 (USD MN)
Table 46 Baker Hughes Inc.: Net Sales, By Business Segment, 2009-2013 (USD MN)
Table 47 Baker Hughes Inc.: Product and Service Offerings
Table 48 Baker Hughes Inc.: Related Developments
Table 49 Weatherford International PLC: Key Financials, 2009-2013 (USD MN)
Table 50 Weatherford International PLC: Net Sales, By Business Segment, 2009-2013 (USD MN)
Table 51 Weatherford International PLC: Net Sales, By Geographic Segment, 2009-2013 (USD MN)
Table 52 Weatherford International PLC: Product and Service Offerings
Table 53 Weatherford International PLC: Related Developments
Table 54 Superior Energy Services Inc.: Key Financials, 2009-2013 (USD MN)
Table 55 Superior Energy Services Inc.: Net Sales, By Business Segment, 2009-2013 (Usd Mn
Table 56 Superior Energy Services Inc.: Net Sales, By Geographic Segment, 2009-2013 (USD MN)
Table 57 Superior Energy Services Inc.: Product and Service Offerings
Table 58 Superior Energy Services Inc.: Related Development
Table 59 Nabors Industries Ltd.: Key Financials, 2009-2013 (USD MN)
Table 60 Nabors Industries Ltd.: Net Sales, By Geographic Segment, 2009-2013 (USD MN)
Table 61 Nabors Industries Ltd.: Product and Service Offerings
Table 62 Expro International Group: Key Financials, 2009-2013 (USD MN)
Table 63 Expro International Group: Product and Service Offerings
Table 64 Expro International Group: Related Developments
Table 65 National Oilwell Varco Inc.: Key Financials, 2009-2013 (USD MN)
Table 66 National Oilwell Varco Inc.: Net Sales, By Business Segment, 2009-2013 (USD MN)
Table 67 National Oilwell Varco Inc.: Net Sales, By Geographic Segment, 2009-2013 (USD MN)
Table 68 National Oilwell Varco Inc.: Product and Service Offerings
Table 69 National Oilwell Varco Inc.: Related Developments
List of Figures (52 Figures)
Figure 1 South America Oilfield Services Market: Segmentation & Coverage
Figure 2 Oilfield Services Market: Integrated Ecosystem
Figure 3 Research Methodology
Figure 4 Top-Down Approach
Figure 5 Bottom-Up Approach
Figure 6 Demand Side Approach
Figure 7 Macro Indicator-Based Approach
Figure 8 South America Oilfield Services Market Snapshot
Figure 9 South America Oilfield Services Market Growth Aspects
Figure 10 South America Oilfield Services Market, By Application, 2014 Vs 2019
Figure 11 South America Oilfield Services Types, By Country, 2013 (USD MN)
Figure 12 Oilfield Services: Application Market Scenario
Figure 13 South America Oilfield Services Market, By Application, 2014 - 2019 (USD MN)
Figure 14 South America Oilfield Services Market in Onshore, By Country, 2013 - 2019 (USD MN)
Figure 15 South America Oilfield Services Market in Offshore, By Country, 2013 - 2019 (USD MN)
Figure 16 South America Oilfield Services Market, By Type, 2014 - 2019 (USD MN)
Figure 17 South America Oilfield Services Market: Type Comparison With the Oil and Gas Industry, 2013–2019 (USD MN)
Figure 18 South America Drilling Services Market, By Country, 2013–2019 (USD MN)
Figure 19 South America Coiled Tubing Services Market, By Country, 2013–2019 (USD MN)
Figure 20 South America Oilfield Equipment Rental Market, By Country, 2013 - 2019 (USD MN)
Figure 21 South America Drilling Fluids Market, By Country, 2013 - 2019 (USD MN)
Figure 22 South America Well Completion Market, By Country, 2013 - 2019 (USD MN)
Figure 23 South America Oil Country Tubular Goods (OCTG) Market, By Country, 2013–2019 (USD MN)
Figure 24 South America Pressure Pumping Services Market, By Country, 2013–2019 (USD MN)
Figure 25 South America Well Intervention Market, By Country, 2013–2019 (USD MN)
Figure 26 South America Wireline Services Market, By Country, 2013–2019 (USD MN)
Figure 27 South America Oilfield Services Market: Growth Analysis, By Country, 2014-2019 (USD MN)
Figure 28 Brazil Oilfield Services Market Overview, 2014 & 2019 (%)
Figure 29 Brazil Oilfield Services Market, By Application, 2013-2019 (USD MN)
Figure 30 Brazil Oilfield Services Market: Application Snapshot, 2014 - 2019 (USD MN)
Figure 31 Brazil Oilfield Services Market, By Type, 2013 - 2019 (USD MN)
Figure 32 Brazil Oilfield Services Market Share, By Type, 2014-2019 (%)
Figure 33 Venezuela Oilfield Services Market Overview, 2014 & 2019 (%)
Figure 34 Venezuela Oilfield Services Market, By Application, 2013-2019 (USD MN)
Figure 35 Venezuela Oilfield Services Market: Application Snapshot, 2014 - 2019 (USD MN)
Figure 36 Venezuela Oilfield Services Market, By Type, 2013 - 2019 (USD MN)
Figure 37 Venezuela Oilfield Services Market Share, By Type, 2014-2019 (%)
Figure 38 Argentina Oilfield Services Market Overview, 2014 & 2019 (%)
Figure 39 Argentina Oilfield Services Market, By Application, 2013 - 2019 (USD MN)
Figure 40 Argentina Oilfield Services Market: Application Snapshot, 2014 - 2019 (USD MN)
Figure 41 Argentina Oilfield Services Market, By Type, 2013 - 2019 (USD MN)
Figure 42 Argentina Oilfield Services Market: Type Snapshot Market Share, By Type, 2014-2019 (%)
Figure 43 South America Oilfield Services Market: Company Share Analysis, 2013 (%)
Figure 44 Oilfield Services: Company Product Coverage, By Type, 2013
Figure 45 Schlumberger Ltd.: Revenue Mix, 2013(%)
Figure 46 Halliburton Co.: Revenue Mix, 2013(%)
Figure 47 Baker Hughes Inc.: Revenue Mix, 2013 (%)
Figure 48 Weatherford International PLC: Revenue Mix, 2013(%)
Figure 49 Superior Energy Services Inc.: Revenue Mix, 2013(%)
Figure 50 Nabors Industries Ltd.: Revenue Mix, 2013(%)
Figure 51 Expro International Group: Revenue Mix, 2013 (%)
Figure 52 National Oilwell Varco Inc., Revenue Mix, 2013 (%)
The oilfield services required during various phases of a well’s lifecycle include drilling, completion, stimulation, intervention, production, and others. This is a service provided by oilfield service companies to the oil and natural gas companies. In this report, the market is analyzed on the basis of the type of services offered by oilfield service companies to support exploration and production activities. South America is the fastest growing market over the next five years, which is why there are plenty of growth prospects for the oilfield services market in this region.
As a potential driver that can increase recoverable resources, exploration and production are important for the oilfield services market. The oilfield market continues to grow at an increasing pace, as oil & gas operators continue to discover new oil & gas field reserves where oilfield services are required. The requirement to maintain and boost the recovery rates from unconventional resources has increased and will continue to do so. In order to maintain and boost production, advanced oilfield services will play a key role in the future of the unconventional oil & gas market.
Favorable demand in South America due to the production of unconventional resources in Brazil and the growing number of offshore platforms is also expected to be the major demand drivers for the market.
Companies involved in the oilfield services business are thus expanding into deeper regions of Brazil and Venezuela to increase their market share and customer base. Technological advancements and innovative new products are the key strategies that help the companies maximize their revenues.
The oilfield services market in South America was valued at $51,004.0 million in 2014 and is projected to grow at a CAGR of 5.8% from 2014 and 2019 to reach a market size of $ 67,474.0 million by 2019.
Drilling services dominated the oilfield services market in 2014. Currently, Brazil dominates the drilling services market. This dominance has been observed mainly due to continuous and large activities in the Brazilian unconventional resources and offshore industry.
An in-depth market share analysis, by revenue, of the top companies has been included in the report. These numbers are arrived at, based on key facts, annual financial information from annual reports, and interviews with industry experts and key opinion leaders, such as CEOs, directors, and marketing executives. Key market players that have established their base in the South American oilfield services market are Schlumberger Ltd., Weatherford International Plc, Halliburton Co., Baker Hughes Inc., and Nabors Industries Ltd.
Please visit https://www.micromarketmonitor.com/custom-research-services.html to specify your custom Research Requirement


