

Middle East Coiled Tubing Market by Services (Well Intervention, Drilling & others), By Application (Onshore &Offshore), By Countries - Regional Trend & Forecast to 2019
- Publish Date: Upcoming


The coiled tubing services market in the Middle East was valued at $298 million in 2013, and is forecast to reach $522 million by 2018, at a CAGR of 12%, from 2013 to 2018. The well intervention services accounted for $221 million, which is almost 74 % of the total coiled tubing services in the Middle East.
The market report analyses the coiled tubing services market by types of services, and geography. In terms of geography, the report is segmented into Saudi Arabia, Kuwait, and UAE, among others. The major coiled tubing services included in this report are well intervention and drilling.
The rising energy demand, redevelopment of mature oil field wells, increasing exploration and production activities in shale reservoirs, and commercially viable offshore drilling at multiple depths are some of the key drivers for the Middle East coiled tubing market. Saudi Arabia leads the coiled tubing services market in the Middle East.
The Middle East region is characterized by continuous technical innovative applications in various segments of the oil and gas industry, with the presence of top service providers such as Schlumberger Ltd (U.S.), Halliburton Ltd (U.S.), Baker Hughes (U.S.), and so on.
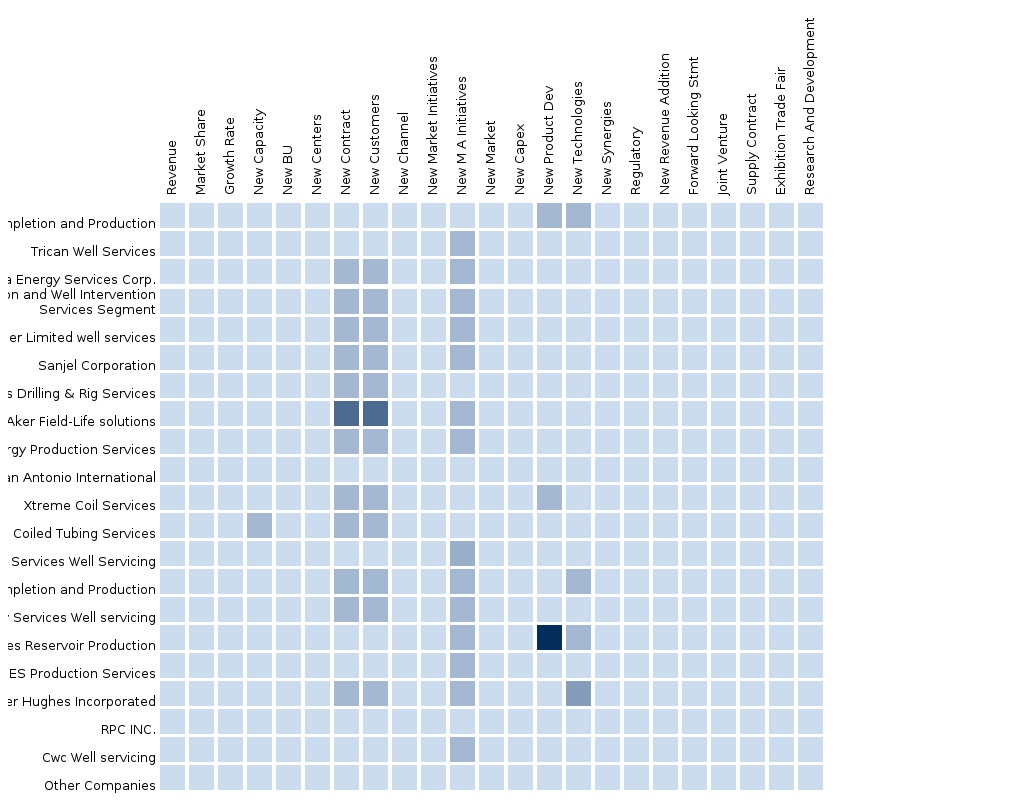
The report provides an extensive competitive landscaping of the coiled tubing services companies in the Middle East. Some of the key players operating in the market are Schlumberger Ltd, Halliburton, Baker Hughes, Aker Qserv, Weatherford International Ltd., and Sanjel, among others. The regional market shares, new product/service launches, M&A, and product portfolios of the key market players have been detailed in this report.
Customization Options:
Along with market data, customize the MMM assessments in alignment with your company’s specific needs. Customize to get a comprehensive summary of the industry standards and deep dive analysis of the following parameters:
- Key Competitors/ Operators Product and geographic benchmarking
- Active fleet outlook of operators
- A comparison of service portfolios of each company, mapped at the regional level
- Technological advancements in the coiled tubing services market, by operator:
- Tier I
- Schlumberger Ltd., Halliburton, Baker Hughes Inc., and Weatherford International Plc., Aker Solutions ASA
- Tier II
- Trican well services Ltd.
Coiled tubing tools and ancillary services:
- Wire line products, fishing tools, coiled tubing equipment, Heavy-duty wire line fishing services
- Ancillary services such as inspection systems for data acquisition for improving real time CT capabilities, simulation services by Weatherford International Plc., Baker Hughes, Halliburton
Oil and Gas Production Outlook
- Producing wells count outlook (regional and country level data)
- Drilled wells outlook (regional and country level data)
Expert forum
- Qualitative inputs on coiled tubing activities and the trends in different countries. A comparative analysis of coiled tubing services for conventional, unconventional, onshore and offshore wells
- Supply chain analysis of the coiled tubing services. Supply chain management of the vendors and sub-contractors, and equipment evaluation
- Regional and local environmental and regulatory implications on the coiled tubing market
- A comparative analysis of total costs of ownership vis-à-vis rented service
1 Introduction
1.1 Objectives Of The Study
1.2 Market Definitions
1.3 Market Covered
1.4 Stakeholders
1.5 Research Methodology
1.5.1 Market Size
1.5.2 Key Data Points Taken From Secondary Sources
1.5.3 Key Data Points Taken From Primary Sources
1.6 Assumptions
1.7 Acronyms
2 Market Snapshot
2.1 Market Value
2.2 Market Value Forecast
2.3 By Services
2.4 By Geography
3 Market Overview
3.1 Introduction
3.2 Drivers And Restrains For Coiled Tubing Market
3.2.1 Drivers
3.2.1.1 Redevelopment Of Mature Field Wells
3.2.1.2 Reinforcing Existing Reserves
3.2.2 Restraints
3.2.2.1 Strict Government & Environmental Policies
3.3 Porter’s Five Forces Analysis
3.3.1 Threat Of New Entrants
3.3.2 Threat Of Substitutes
3.3.3 Suppliers’ Power
3.3.4 Buyers’ Power
3.3.5 Degree Of Competition
3.4 Support TABLEs
3.4.1 Demand And Supply Scenario Of Crude Oil
3.4.2 Demand And Supply Scenario Of Natural Gas
3.4.3 Proved Oil Reserves
3.4.4 Proved Gas Reserves
3.4.4.1 Synchronization With Growing Investment In Shale Gas
3.4.5 Offshore Well Intervention Services Classification, By Type Analysis
4 Coiled Tubing Services-Middle East Market By Services
4.1 Introduction
4.2 Coiled Tubing Market, By Services
4.3 Middle East Well Intervention Services
4.4 Middle East Drilling Services
4.5 Middle East Other Services
4.6 Support TABLEs
4.6.1 Equipment Used Within The Industry
4.6.1.1 Tools & Equipment Used For Rigless Well Intervention Services
4.6.1.1.1 Coiled Tubing Units
4.6.1.1.2 Coiled Tubing Market Dynamics
4.6.1.1.3 Key Elements Of Coiled Tubing
4.6.1.1.4 Advantages Of Coiled Tubing
4.6.1.1.5 Coiled Tubing Intervention Services
4.6.1.2 Wireline Services
4.6.1.2.1 Wireline Market Dynamics
4.6.1.2.2 Slickline
4.6.1.2.2.1 Slickline Intervention Services
4.6.1.2.3 Electric Line (E–Line)
4.6.1.2.3.1 Electricline (E-Line) Intervention Services
4.6.1.3 Hydraulic Workover (Hwo)
4.6.1.3.1 Hydraulic Workover Equipment Market Dynamics
4.6.1.3.2 Advantages Of Hydraulic Workover
4.6.1.3.3 Hydraulic Workover/Intervention Services
4.6.1.4 Riserless Light Well Intervention
5 Coiled Tubing Services Market By Geography
5.1 Introduction
5.2 Coiled Tubing Services, By Geography
5.2.1 Coiled Tubing Services, Saudi Arabia
5.2.2 Coiled Tubing Services, Kuwait
5.2.3 Coiled Tubing Services, U.A.E.
5.2.4 Coiled Tubing Services, Other Country
5.3 Ct Fleet By Geography
5.4 Company Fleet Count, By Geography
5.4.1 Schlumberger Ltd Fleet Count, By Geography
5.4.2 Halliburton Company Fleet Count, By Geography
5.4.3 Baker Hughes Inc. Fleet Count, By Geography
5.4.4 Weatherford International Inc. Fleet Count, By Geography
5.4.5 Aker Qserv Ltd Fleet Count, By Geography
5.4.6 Sanjel Corporation Fleet Count, By Geography
6 Coiled Tubing: Competitive Landscape
6.1 Middle East: Market Share, By Companies
6.2 Market Developments
7 Coiled Tubing-Middle East, By Companies
7.1 Schlumberger Ltd.
7.1.1 Introduction
7.1.2 Products & Services
7.1.3 Financials
7.2 Weatherford International Ltd.
7.2.1 Introduction
7.2.2 Prodcuts & Services
7.2.3 Financials
7.3 Sanjel Corporation
7.3.1 Introduction
7.3.2 Prodcuts & Services
7.3.3 Financials
7.4 Halliburton Co.
7.4.1 Introduction
7.4.2 Products & Services
7.4.3 Financials
7.5 Baker Hughes Inc.
7.5.1 Introduction
7.5.2 Products & Services
7.5.3 Financials
8 Coiled Tubing: Macroeconomic Indicators
8.1 Ct Fleet By Geography
9 Coiled Tubing Services
9.1 Introduction
9.2 Technical Restraints
9.3 Technological Developments In Coiled Tubing
List of Tables
TABLE 1 Demand Of Crude Oil, By Geography,2007 - 2012 (‘000 Bbl/Day)
TABLE 2 Percentage Change In Crude Oil Consumption, By Geography, 2009 – 2012
TABLE 3 Supply Of Crude Oil, By Geography,2007 – 2012 (‘000 Bbl/Day)
TABLE 4 Percentage Change In Crude Oil Production, By Regions, 2009 – 2012
TABLE 5 Demand Of Natural Gas, By Geography, 2007 – 2012 (Bcm)
TABLE 6 Percentage Change In Natural Gas Consumption, By Geography,2009 – 2012
TABLE 7 Supply Of Natural Gas, By Geography, 2007 – 2012 (Bcm)
TABLE 8 Change In Natural Gas Production, By Geography,2009 – 2012
TABLE 9 Growth Of Proved Oil Reserves, By Geography, 2007 – 2012 (‘000 Million Bbls)
TABLE 10 Growth Of Proved Gas Reserves, By Geography,2007 – 2012 (Tcm)
TABLE 11 Proved Shale Gas Reserves, 2012 (%)
TABLE 12 Offshore Well Intervention Services Classification, By Types (Light)
TABLE 13 Offshore Well Intervention Services Classification, By Types (Medium)
TABLE 14 Offshore Well Intervention Services Classification, By Types (Heavy)
TABLE 15 Coiled Tubing Services-Middle East Market Values, By Services, 2013 - 2018($ Million)
TABLE 16 Middle East Well Intervention Market By Country, 2011-2018($Million)
TABLE 17 Middle East Drilling Market By Country, 2011-2018($Million)
TABLE 18 Middle East Other Services Market By Country, 2011-2018($Million)
TABLE 19 Coiled Tubing: Manufacturers & Service Providers
TABLE 20 Coiled Tubing: Applications & Processes
TABLE 21 Wireline Units: Manufacturers & Service Providers
TABLE 22 Slickline Services: Applications & Processes
TABLE 23 Electricline Services: Applications & Processes
TABLE 24 Hydraulic Workover Equipment: Manufacturers & Service Providers
TABLE 25 Hydraulic Workover: Applications & Processes
TABLE 26 Rlwi Vessel: Applications
TABLE 27 Coiled Tubing Services-Middle East Market Values, By Geography, 2013 – 2018 ($ Million)
TABLE 28 Coiled Tubing Services-Kingdom Of Saudi Arabia Market Values, By Services, 2013 - 2018($ Million)
TABLE 29 Coiled Tubing Services-Kuwait Market Values, By Services, 2013 - 2018($ Million)
TABLE 30 Coiled Tubing Services-U.A.E. Market Values, By Services, 2013 - 2018($ Million)
TABLE 31 Coiled Tubing Services-Other Country Market Values, By Services, 2013 - 2018($ Million)
TABLE 32 Macroindicator: Active Fleet Count
TABLE 33 Middle East: Ct Active Fleet Count, By Countries
TABLE 34 2012 – 2013
TABLE 35 Schlumberger: Ct Active Fleet Count, By Geography, 2012 – 2013
TABLE 36 Schlumberger Middle East: Ct Active Fleet Count, By Countries, 2012 – 2013 (Units)
TABLE 37 Halliburton: Ct Active Fleet Count, By Geography, 2012 – 2013 (Units)
TABLE 38 Halliburton Middle East: Ct Active Fleet Count, By Countries, 2012 – 2013 (Units)
TABLE 39 Baker Hughes: Ct Active Fleet Count, By Geography, 2012 – 2013 (Units)
TABLE 40 Baker Hughes Middle East: Ct Active Fleet Count, By Countries, 2012 – 2013 (Units)
TABLE 41 Weatherford: Ct Active Fleet Count, By Geography, 2012 – 2013 (Units)
TABLE 42 Weatherford Middle East: Ct Active Fleet Count, By Countries, 2013 (Units)
TABLE 43 Aker Qserv: Ct Active Fleet Count, By Geography, 2012 – 2013 (Units)
TABLE 44 Sanjel: Ct Active Fleet Count, By Geography, 2012 – 2013 (Units)
TABLE 45 Middle East: Developments
TABLE 46 Schlumberger Ltd.: Products & Services
TABLE 47 Schlumberger Ltd: Financials
TABLE 48 Weatherford International Ltd.: Prodcuts & Services
TABLE 49 Weatherford International Ltd.: Financials
TABLE 50 Sanjel Corporation.: Prodcuts & Services
TABLE 51 Sanjel Corporation: Financials
TABLE 52 Halliburton Co.: Products & Services
TABLE 53 Baker Hughes Inc.: Products & Services
TABLE 54 Baker Hughes Inc.: Financials
TABLE 55 Macroindicator: Active Fleet Count
List of Figures
FIGURE 1 Market Segmentation
FIGURE 2 Coiled Tubing Services-Middle East Ecosystem
FIGURE 3 Top Growing Coil Tubing-Middle East Market, By Services, 2013 – 2018
FIGURE 4 Porter’s Five Force Analysis
FIGURE 5 Global Ct Active Fleet: Market Share, By Geography, 2013
FIGURE 6 Market Share: 2013
FIGURE 7 Market Share: 2018
FIGURE 8 Schlumberger Ltd: Ecosystem
FIGURE 9 Weatherford International Ltd.: Ecosystems
FIGURE 10 Sanjel Corporation : Ecosystems
FIGURE 11 Halliburton Co.: Ecosystems
FIGURE 12 Halliburton Co.: Financials
FIGURE 13 Baker Hughes Inc.: Ecosystem
FIGURE 14 Global Ct Active Fleet: Market Share, By Geography, 2013
Please fill in the form below to receive a free copy of the Summary of this Report
Please visit https://www.micromarketmonitor.com/custom-research-services.html to specify your custom Research Requirement
| PRODUCT TITLE | PUBLISHED | |
|---|---|---|
|
|
South America Oilfield Services The oilfield services market in South America was valued around $14.04 billion in 2013, with a market share of 9.3% globally. Projected to grow at a CAGR of 17% from 2014 to 2019, the market is led by Weatherford, Halliburton, Schlumberger, and Baker Hughes. It is segmented on the basis of types of oilfield services and countries present in the region. |
Apr 2015 |
|
|
Asia-Pacific Oilfield Services The oilfield services market in Asia Pacific was valued around $31598 million in 2013, with a market share of almost 20% globally. Projected to grow at a CAGR of 14% from 2014 to 2019, the market is led by Weatherford, Halliburton, Schlumberger, and Baker Hughes. It is segmented on the basis of types of oilfield services and countries in the region. |
Apr 2015 |
|
|
Middle East Oilfield Services Middle East oilfield services market was valued at $73,405.6 million in 2014 and is projected to grow at a CAGR of 4.2% from 2014 to 2019 to reach a market size of $90,150.1 by 2019. The large share is attributed to the rise in exploration of new reserves which requires increased drilling activities. |
May 2015 |
|
|
Africa Oilfield Services The oilfield services market in Africa was valued around $7642 million in 2013, with a market share of 5% globally. Projected to grow at a CAGR of 14.4% from 2014 to 2019, the market is led by Weatherford, Halliburton, Schlumberger, and Baker Hughes. It is segmented on the basis of types of oilfield services and countries present in the region. |
Apr 2015 |
|
|
Europe Oilfield Services The European oilfield services market was valued at $45,592.5 million in 2014, and is projected to reach $60,017.5 million by 2019, at a CAGR of 5.7% from 2014 to 2019. The growth of this market can be attributed to the rise in exploration activities of new reserves, which requires increased drilling activities. The drilling services segment accounted for the largest share of 59.2% of the European oilfield services market in 2014. |
Apr 2015 |
|
|
North America Oilfield Services The oilfield services market in North America was valued around $76.85 billion in 2013, with a market share of 50.8% globally. Projected to grow at a CAGR of 9.8% from 2014 to 2019, the market is led by Weatherford, Halliburton, Schlumberger, and Baker Hughes. It is segmented on the basis of types of oilfield services and countries present in the region. |
Upcoming |


