

Asia Pacific Coiled Tubing Market by Services (Well Intervention, Drilling & others), By Application (Onshore & Offshore), By Countries - Regional Trend & Forecast to 2019
- Publish Date: Apr 2015


The purpose of this report is to cover the definition, description, and forecast of the Asia-Pacific coiled tubing services market. It involves a deep-dive analysis of the market segmentation, which is based on service, application and geography. The report also gives deep insights into the competitive landscape of the market through a strategic analysis of the key players of the market. The Asia-Pacific coiled tubing services market, in terms of service, has been segmented into well intervention and drilling, among other services. The main end-users of the market are oilfield service operators and drilling operators.
Globally, Asia-pacific is the third-largest market for coiled tubing services, and is projected to grow at a CAGR of 5.1% during the forecast period of 2014 to 2019. The large share is attributed to the increasing investments in exploration and production activity in the oil & gas industry.
The exploration of unconventional resources shows a very bright future for natural gas, which could very soon overtake the importance of coal as a primary source of energy. Unconventional gas will account for the high increase in global gas production with maximum rise in China and other countries as well. The energy resources such as shale gas, tar sands, heavy oil, shale oil, shale gas, and coal bed methane are some of the unconventional energy sources which are likely to alter the global energy mix in the near future. The coiled tubing services are one of the key technologies in the development of these resources through, well completions and other activities.
The Asia-Pacific coiled tubing services market is segmented on the basis of its geographic reach in different countries. China happens to be the largest shareholder of this market with a value of $104.9 million in 2014 and is expected to reach the value of $139.9 million by 2019, growing at a CAGR of 5.9% during the period 2014 – 2019.
The report also provides a deep-dive analysis of the enriched coiled tubing service portfolio of the leading players of the Asia-Pacific coiled tubing service market such as Weatherford International plc (Ireland), Schlumberger Ltd. (U.S.), and Nabors Industries Ltd. (Bermuda).
Table of Contents
1 Introduction (Page No. - 10)
1.1 Objectives of the Study
1.2 Market Segmentation and Coverage
1.3 Stakeholders
2 Research Methodology (Page No. - 12)
2.1 Integrated Ecosystem of the Coiled Tubing Market
2.1.1 Top-Down Approach
2.1.2 Bottom-Up Approach
2.1.3 Demand Side Approach
2.1.4 Macroindicator-Based Approach
2.2 Assumptions
3 Executive Summary (Page No. - 19)
4 Market Overview (Page No. - 20)
4.1 Introduction
4.2 Coiled Tubing Service Market: Comparison With Parent Market
4.3 Market Drivers and Inhibitors
4.4 Demand Side Analysis
5 Coiled Tubing Service Market, By Application (Page No. - 25)
5.1 Introduction
6 Coiled Tubing Service Market, By Type (Page No. - 29)
6.1 Introduction
6.2 Coiled Tubing Service Market, Type Comparison With Parent Market
6.3 Asia-Pacific Coiled Tubing Service Market, By Country
6.4 Asia-Pacific Drilling Market, By Country
6.5 Sneak View: Asia-Pacific Coiled Tubing Service Market, By Type
7 Coiled Tubing Service Market, By Country (Page No. - 35)
7.1 Introduction
7.2 Vendor Side Analysis
7.3 China Coiled Tubing Service Market
7.3.1 China Coiled Tubing Service Market, By Application
7.3.2 China Coiled Tubing Service Market, By Type
7.4 India Coiled Tubing Service Market
7.4.1 India Coiled Tubing Service Market, By Application
7.4.2 India Coiled Tubing Service Market, By Type
7.5 Kazakhstan Coiled Service Tubing Market
7.5.1 Kazakhstan Coiled Tubing Service Market, By Application
7.5.2 Kazakhstan Coiled Tubing Service Market, By Type
7.6 Australia Coiled Tubing Service Market
7.6.1 Australia Coiled Tubing Service Market, By Application
7.6.2 Australia Coiled Tubing Service Market, By Type
8 Coiled Tubing Service Market: Competitive Landscape (Page No. - 50)
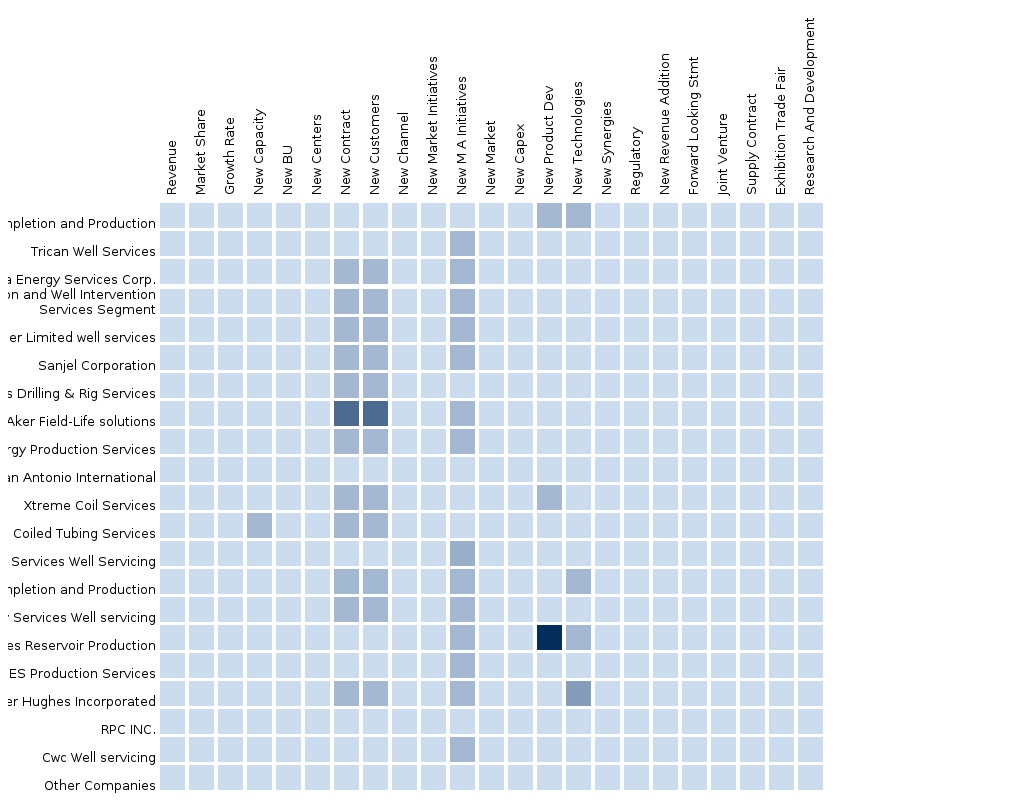
8.1 Coiled Tubing Service Market: Company Share Analysis
8.2 Mergers and Acquisitions
8.3 Expansions
8.4 Contracts and Agreements
8.5 Joint Ventures
8.6 New Product Developments
8.7 New Technologies
9 Company Profiles (Page No. - 56)
9.1 Schlumberger Ltd.
9.1.1 Overview
9.1.2 Key Financials
9.1.3 Product and Service Offerings
9.1.4 Related Developments
9.1.5 MMM View
9.2 Halliburton Company
9.2.1 Overview
9.2.2 Key Financials
9.2.3 Product and Service Offerings
9.2.4 Related Developments
9.2.5 MMM View
9.3 Weatherford International PLC
9.3.1 Overview
9.3.2 Key Financials
9.3.3 Product and Service Offerings
9.3.4 Related Developments
9.3.5 MMM View
9.4 Superior Energy Services Inc.
9.4.1 Overview
9.4.2 Key Financials
9.4.3 Product and Service Offerings
9.4.4 Related Developments
9.4.5 MMM View
9.5 Nabors Industries Ltd.
9.5.1 Overview
9.5.2 Key Financials
9.5.3 Product and Service Offerings
9.5.4 Related Developments
9.5.5 MMM View
9.6 Archer Solutions Inc.
9.6.1 Overview
9.6.2 Key Financials
9.6.3 Product and Service Offerings
9.6.4 Related Developments
9.6.5 MMM View
9.7 Baker Hughes Inc.
9.7.1 Overview
9.7.2 Key Financials
9.7.3 Products and Services Offerings
9.7.4 Related Developments
9.7.5 MMM View
10 Appendix (Page No. - 78)
10.1 Customization Options
10.1.1 Products & Services Benchmarking Analysis
10.1.2 Regulatory Framework
10.1.3 Impact Analysis
10.1.4 Current Industry Challenges
10.1.5 Historical Data & Trends
10.1.6 Oilfield Services in Depth Value Chain Analysis
10.2 Related Reports
10.3 Introducing RT: Real Time Market Intelligence
10.3.1 RT Snapshots
List of Tables (46 Tables)
Table 1 Asia-Pacific Coiled Tubing Peer Market Size, 2013 (USD MN)
Table 2 Asia-Pacific Coiled Tubing Market: Number of New Wells, By Country, 2013
Table 3 Asia-Pacific Coiled Tubing Service Market: Comparison With Parent Market, 2013–2019 (USD MN)
Table 4 Asia-Pacific Coiled Tubing Service Market: Drivers and Inhibitors
Table 5 Asia-Pacific Coiled Tubing Service Market, By Type, 2013–2019 (USD MN)
Table 6 Asia-Pacific Coiled Tubing Service Market: Comparison With Application Markets, 2013–2019 (USD MN)
Table 7 Asia-Pacific Coiled Tubing Service Market in Onshore, By Country, 2013–2019 (USD MN)
Table 8 Asia-Pacific Coiled Tubing Service Market in Offshore, By Country, 2013–2019 (USD MN)
Table 9 Asia-Pacific Coiled Tubing Service Market, By Type, 2013–2019 (USD MN)
Table 10 Asia-Pacific Coiled Tubing Service Market: Type Comparison With Parent Market, 2013–2019 (USD MN)
Table 11 Asia-Pacific Well Intervention Market, By Country, 2013–2019 (USD MN)
Table 12 Asia-Pacific Drilling Market, By Country, 2013–2019 (USD MN)
Table 13 Asia-Pacific Coiled Tubing Service Market, By Country, 2013–2019 (USD MN)
Table 14 China Coiled Tubing Service Market, By Application, 2013–2019 (USD MN)
Table 15 China Coiled Tubing Service Market, By T, 2013–2019 (USD MN)
Table 16 India Coiled Tubing Service Market, By Application, 2013-2019 (USD MN)
Table 17 India Coiled Tubing Service Market, By Type, 2013–2019 (USD MN)
Table 18 Kazakhstan Coiled Tubing Service Market, By Application, 2013–2019 (USD MN)
Table 19 Kazakhstan Coiled Tubing Service Market, By Type 2013–2019 (USD MN)
Table 20 Australia Coiled Tubing Service Market, By Application, 2013–2019 (USD MN)
Table 21 Australia Coiled Tubing Service Market, By Type, 2013–2019 (USD MN)
Table 22 Coiled Tubing Service Market: Company Share Analysis, 2013 (%)
Table 23 Asia-Pacific Coiled Tubing Service Market: Mergers and Acquisitions
Table 24 Asia-Pacific Coiled Tubing Service Market: Expansions
Table 25 Asia-Pacific Coiled Tubing Service Market: Agreements
Table 26 Asia-Pacific Coiled Tubing Service Market: Joint Ventures
Table 27 Asia-Pacific Coiled Service Market: New Product Developments
Table 28 Asia-Pacific Coiled Tubing Service Market: New Technologies
Table 29 Schlumberger Ltd.: Market Revenue, By Business Segment, 2009–2013 (USD MN)
Table 30 Schlumberger Ltd.: Market Revenue, By Geographic Segment, 2009–2013 (USD MN)
Table 31 Schlumberger Ltd.: Key Operations Data, 2009–2013 (USD MN)
Table 32 Halliburton Co.: Market Revenue, By Geographic Segment, 2009–2013 (USD MN)
Table 33 Halliburton Co.: Market Revenue, By Business Segment, 2009–2013 (USD MN)
Table 34 Halliburton Co.: Key Operations Data, 2009–2013 (USD MN)
Table 35 Weatherford International PLC.: Market Revenue, By Business Segment, 2009–2013 (USD MN)
Table 36 Weatherford International PLC.: Market Revenue, By Geographic Segment, 2009–2013 (USD MN)
Table 37 Weatherford International PLC.: Key Operations Data 2009–2013 (USD MN)
Table 38 Superior Energy Services Inc.: Market Revenue, By Business Segment, 2009–2013 (USD MN)
Table 39 Superior Energy Services.: Market Revenue, By Geographic Segment, 2009–2013 (USD MN)
Table 40 Superior Energy Services.: Key Operations, 2009–2013 (USD MN)
Table 41 Nabors Industries: Market Revenue, By Geographic Segment, 2009–2013 (USD MN)
Table 42 Nabors Industries, Inc.: Key Operations Data, 2009–2013 (USD MN)
Table 43 Archer Limited.: Key Operations Data, 2010–2013 (USD MN)
Table 44 Baker Hughes Inc: Key Financials, 2009–2013 (USD MN)
Table 45 Baker Hughes Inc: Market Revenue, By Geographic Segment, 2009–2013 (USD MN)
Table 46 Baker Hughes Inc: Market Revenue, By Business Segment, 2009–2013 (USD MN)
List of Figures (40 Figures)
Figure 1 Asia-Pacific Coiled Tubing Service Market: Segmentation and Coverage
Figure 2 Coiled Tubing Market: Integrated Ecosystem
Figure 3 Research Methodology
Figure 4 Top-Down Approach
Figure 5 Bottom-Up Approach
Figure 6 Demand Side Approach
Figure 7 Number of New Wells, By Country, 2013
Figure 8 Asia-Pacific Coiled Tubing Service Market Snapshot
Figure 9 Asia-Pacific Coiled Tubing Service Market, By Country, 2013 (USD MN)
Figure 10 Asia-Pacific Coiled Services Tubing Market, By Application, 2014–2019 (USD MN)
Figure 11 Asia-Pacific Coiled Tubing Service Market in Onshore, By Country, 2014–2019 (USD MN)
Figure 12 Asia-Pacific Coiled Tubing Service Market in Offshore, By Country, 2013–2019 (USD MN)
Figure 13 Asia-Pacific Coiled Tubing Service Market, By Type, 2014–2019 (USD MN)
Figure 14 Coiled Tubing Service Market: Type Comparison With Parent Market, 2013–2019 (USD MN)
Figure 15 Asia-Pacific Well Intervention Market, By Country, 2013–2019 (USD MN)
Figure 16 Asia-Pacific Drilling Market, By Country, 2013–2019 (USD MN)
Figure 17 Asia-Pacific Coiled Tubing Service Market: Growth Analysis, By Country, 2013–2019 (USD MN)
Figure 18 China Coiled Tubing Service Market Overview, 2014 and 2019 (%)
Figure 19 China Coiled Tubing Service Market, By Application, 2013–2019 (USD MN)
Figure 20 China Coiled Tubing Service Market, By Type, 2013–2019 (USD MN)
Figure 21 China Coiled Tubing Service Market Share, By Type, 2014–2019 (%)
Figure 22 India Coiled Tubing Service Market Overview, 2014 and 2019 (%)
Figure 23 India Coiled Tubing Service Market, By Application, 2013–2019 (USD MN)
Figure 24 India Coiled Tubing Service Market, By Type, 2013–2019 (USD MN)
Figure 25 India Coiled Tubing Service Market Share, By Type, 2014–2019 (%)
Figure 26 Kazakhstan Coiled Tubing Service Market Overview, 2014 and 2019 (%)
Figure 27 Kazakhstan Coiled Tubing Service Market, By Application, 2013- 2019 (USD MN)
Figure 28 Kazakhstan Coiled Tubing Service Market, By Type, 2013–2019 (USD MN)
Figure 29 Kazakhstan Coiled Tubing Service Market: Type Snapshot
Figure 30 Australia Coiled Tubing Service Market Overview, 2014 and 2019 (%)
Figure 31 Australia Coiled Tubing Service Market, By Application, 2013- 2019 (USD MN)
Figure 32 Australia Coiled Tubing Service Market, By Type, 2013–2019 (USD MN)
Figure 33 Australia Coiled Tubing Service Market: Type Snapshot
Figure 34 Coiled Tubing Service Market: Company Share Analysis, 2013 (%)
Figure 35 Schlumberger Ltd: Revenue Mix, 2013 (%)
Figure 36 Halliburton Co: Revenue Mix, 2013(%)
Figure 37 Weatherford International PLC: Revenue Mix, 2013(%)
Figure 38 Superior Energy Services Inc.: Revenue Mix, 2013(%)
Figure 39 Nabors Industries Ltd.: Revenue Mix, 2013(%)
Figure 40 Baker Hughes: Revenue Mix, 2013 (%)
Coiled tubing (CT) is a continuously-milled tubular product that is manufactured in lengths and is spooled over a take up reel. The spooled tube is straightened when required for the various operations at the well site. After the operation, the tube is spooled back on to the reel. The diameter of the tube usually varied from 0.75 inches to 4 inches and has a length of approx. 30,000 ft. The reel is stacked onto the coiled tubing unit which comprises the complete set of various equipment required to perform standard tubing operations.
CT is extensively used for developing horizontal and highly deviated wells. Due to the increase in the exploration & production activities in both onshore and offshore regions, the market for CT is on rise. Also, the increase in the development of the unconventional sources of energy like shale gas, tight oil, and others, has boosted the CT market.
The Asia-Pacific coiled tubing services market is expected to grow at a rapid pace in the coming years. In the year 2014, the market was valued at $362.9 million and is expected to reach the value of $465.6 million by 2019. China held the largest share of 28.9% in this market in 2013, and is expected to reach a value of $139.9 million by 2019, at a CAGR of 5.9% from 2014 to 2019.
The Asia-Pacific coiled tubing services market is expected to witness a substantial growth, the main reason being the increase in the exploration & production spending by the companies, large discoveries of unconventional sources of energy, and maturation of old wells. In addition, the emerging economies of China and India are expected to explore untapped opportunities in the oil & gas industry.
An in-depth market share analysis, by revenue, of the top companies is included in the report. These numbers are arrived at, based on key facts, annual financial information from SEC filings, annual reports and interviews with industry experts and key opinion leaders, such as CEOs, directors, and marketing executives. Top market players that have established their base in the Asia-Pacific coiled tubing services market are Baker Hughes Inc. (U.S.), Halliburton Company (U.S.), Superior Energy Services, Inc. (U.S.), Weatherford International Ltd. (Ireland), Schlumberger Ltd. (U.S.), and Nabors Industries Ltd. (Bermuda).
Please visit https://www.micromarketmonitor.com/custom-research-services.html to specify your custom Research Requirement
| PRODUCT TITLE | PUBLISHED | |
|---|---|---|
|
|
South America Oilfield Services The oilfield services market in South America was valued around $14.04 billion in 2013, with a market share of 9.3% globally. Projected to grow at a CAGR of 17% from 2014 to 2019, the market is led by Weatherford, Halliburton, Schlumberger, and Baker Hughes. It is segmented on the basis of types of oilfield services and countries present in the region. |
Apr 2015 |
|
|
Asia-Pacific Oilfield Services The oilfield services market in Asia Pacific was valued around $31598 million in 2013, with a market share of almost 20% globally. Projected to grow at a CAGR of 14% from 2014 to 2019, the market is led by Weatherford, Halliburton, Schlumberger, and Baker Hughes. It is segmented on the basis of types of oilfield services and countries in the region. |
Apr 2015 |
|
|
Middle East Oilfield Services Middle East oilfield services market was valued at $73,405.6 million in 2014 and is projected to grow at a CAGR of 4.2% from 2014 to 2019 to reach a market size of $90,150.1 by 2019. The large share is attributed to the rise in exploration of new reserves which requires increased drilling activities. |
May 2015 |
|
|
Africa Oilfield Services The oilfield services market in Africa was valued around $7642 million in 2013, with a market share of 5% globally. Projected to grow at a CAGR of 14.4% from 2014 to 2019, the market is led by Weatherford, Halliburton, Schlumberger, and Baker Hughes. It is segmented on the basis of types of oilfield services and countries present in the region. |
Apr 2015 |
|
|
Europe Oilfield Services The European oilfield services market was valued at $45,592.5 million in 2014, and is projected to reach $60,017.5 million by 2019, at a CAGR of 5.7% from 2014 to 2019. The growth of this market can be attributed to the rise in exploration activities of new reserves, which requires increased drilling activities. The drilling services segment accounted for the largest share of 59.2% of the European oilfield services market in 2014. |
Apr 2015 |
|
|
North America Oilfield Services The oilfield services market in North America was valued around $76.85 billion in 2013, with a market share of 50.8% globally. Projected to grow at a CAGR of 9.8% from 2014 to 2019, the market is led by Weatherford, Halliburton, Schlumberger, and Baker Hughes. It is segmented on the basis of types of oilfield services and countries present in the region. |
Upcoming |


