

North America Drilling Services Market, by Service Types (Contract Drilling, Directional Drilling, Logging While Drilling, and Drilling Waste Management), Applications (Onshore, Offshore), by Geography (U.S., Canada, Mexico) – Analysis & Forecasts to 2019
- Publish Date: Apr 2015


The purpose of this report is to cover the definition, description, and to forecast the North American drilling services market. It involves a deep-dive analysis of the market segmentation, which is based on application, type, and country. The report also gives deep insights into the competitive landscape of the market through a strategic analysis of the key players of the market. The drilling services market, in terms of types, has been segmented into contract drilling, directional drilling, logging while drilling, and drilling waste management. The oil & gas industry relies heavily on drilling to develop offshore reserves, facilitate development in environmentally sensitive areas, and provide production enhancement through horizontal and multilateral drilling.
The North American drilling services market was valued at $83,733.8 million in 2014 and is projected to reach $98,936.4 million by 2019 at a CAGR of 3.4% from 2014 to 2019. The demand for energy is increasing rapidly over the years, and many of the existing reservoirs are depleting with time. This raises the need to explore new reservoirs which are situated majorly in offshore areas which are difficult to drill vertically because of the complex geological structures.
By service type, the contract drilling services segment accounted for a share of 88% in the North American drilling services market in 2013.
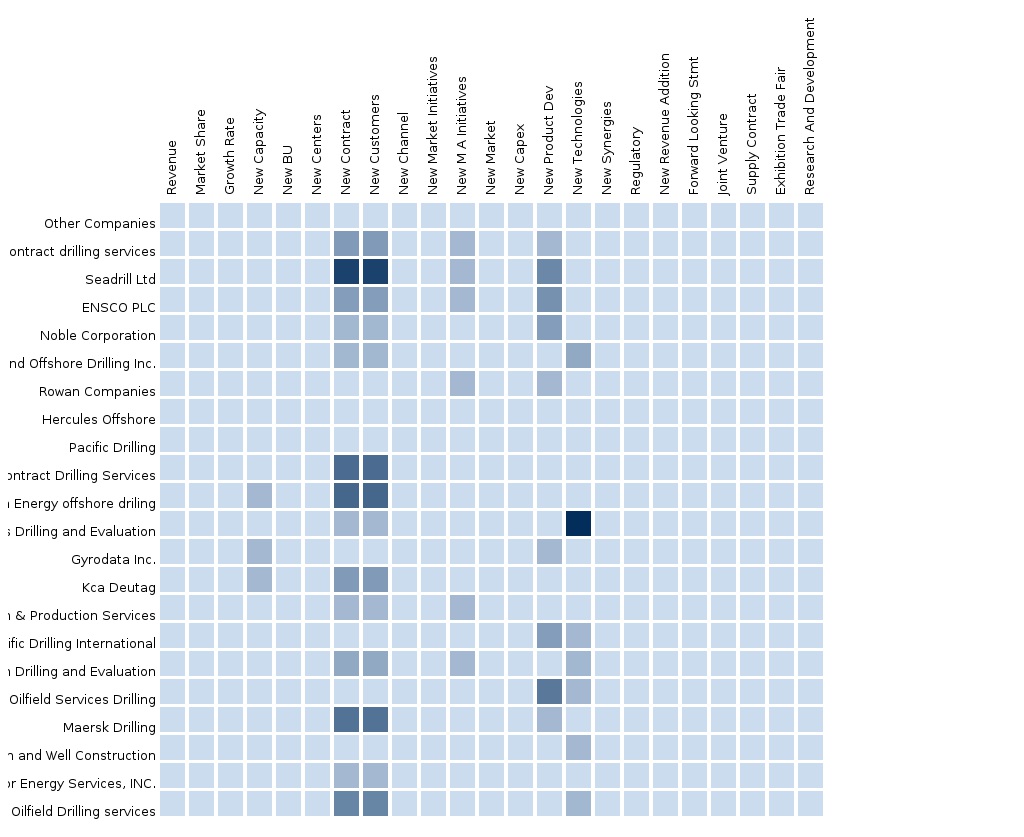
The major companies operating in the North American drilling services market are Halliburton (U.S.), Schlumberger Ltd. (U.S.), Baker Hughes (U.S.), Weatherford International Ltd. (Switzerland), and Superior Energy Services (U.S.).
Market share analysis, by revenue, of the top companies is also included in the report. The scope accordingly aids market participants in identifying high growth markets and helps manage key investment decisions. For this report, major players in the North American drilling services market have been identified through various primary and secondary sources, which include annual reports of top market players, interviews with key opinion leaders such as CEOs, directors, and marketing executives. The market shares have been evaluated and validated based on this research.
Table of Contents
1 Introduction (Page No. - 12)
1.1 Objectives of the Study
1.2 Market Segmentation & Coverage
1.3 Stakeholders
2 Research Methodology (Page No. - 14)
2.1 Integrated Ecosystem of Drilling Services Market
2.2 Arriving at the Drilling Services Market Size
2.2.1 Top-Down Approach
2.2.2 Bottom-Up Approach
2.2.3 Demand Side Approach
2.2.4 Macro Indicator-Based Approach
2.3 Assumptions
3 Executive Summary (Page No. - 23)
4 Market Overview (Page No. - 25)
4.1 Introduction
4.2 North America Drilling Services: Comparison With Parent Market
4.3 Market Drivers and Inhibitors
4.4 Key Market Dynamics
4.5 Demand Side Analysis
5 North America Drilling Service Market, By Application (Page No. - 32)
5.1 Introduction
5.2 Drilling Services Market in Onshore, By Country
5.3 Drilling Services Market in Offshore, By Country
6 North America Drilling Services Market, By Service Type (Page No. - 36)
6.1 Introduction
6.2 North America Drilling Services Market, Type Comparison With Oilfield Services Market
6.3 North America Contract Drilling Market, By Country
6.4 North America Directional Drilling Market, By Country
6.5 North America Logging While Drilling Market, By Country
6.6 North America Drilling Waste Management Market, By Country
7 North America Drilling Services Market, By Country (Page No. - 44)
7.1 Introduction
7.2 U.S. Drilling Services Market
7.2.1 U.S. Drilling Services Market, By Application
7.2.2 U.S. Drilling Services Market, By Service Type
7.3 Canada Drilling Services Market
7.3.1 Canada Drilling Services Market, By Application
7.3.2 Canada Drilling Services Market, By Service Type
7.4 Mexico Drilling Services Market
7.4.1 Mexico Drilling Services Market, By Application
7.4.2 Mexico Drilling Services Market, By Service Type
8 North America Drilling Services Market: Competitive Landscape (Page No. - 58)
8.1 Drilling Services Market: Company Share Analysis
8.2 New Product Launches
8.3 Contracts and Agreements
8.4 Mergers & Acquisitions
8.5 Business Expansions
8.6 Others
9 North America Drilling Services Market, By Company (Page No. - 65)
(Overview, Financials, Products & Services, Strategy, and Developments)*
9.1 Baker Hughes Inc.
9.2 Halliburton Co.
9.3 Schlumberger Ltd
9.4 Weatherford International PLC
9.5 Nabors Industries Ltd.
9.6 Superior Energy Services Inc.
9.7 Ensco PLC
9.8 Transocean Ltd.
*Details on Overview, Financials, Product & Services, Strategy, and Developments Might Not be Captured in Case of Unlisted Company
10 Appendix (Page No. - 95)
10.1 Customization Options
10.1.1 Products and Services Benchmarking Analysis
10.1.2 Regulatory Framework
10.1.3 Impact Analysis
10.1.4 Current Industry Challenges
10.1.5 Historical Data and Trends
10.1.6 Drilling Services in Depth Value Chain Analysis
10.2 Related Reports
10.3 Introducing RT: Real-Time Market Intelligence
10.3.1 RT Snapshots
List of Tables (65 Tables)
Table 1 Global Drilling Services Peer Market Size, (USD MN) , 2013
Table 2 North America Drilling Services Application Market, 2013 (USD MN)
Table 3 North America Drilling Services Market: Macro Indicator, By Country, 2013
Table 4 North America Drilling Services Market: Comparison With Parent Market, 2013 – 2019 (USD MN)
Table 5 North America Drilling Service Market: Drivers and Inhibitors
Table 6 North America Drilling Services Market, By Application, 2013 - 2019 (USD MN)
Table 7 North America Drilling Services Market, By Services Type, 2013 - 2019 (USD MN)
Table 8 North America Drilling Services Market: Comparison With Application Markets, 2013 - 2019 (USD MN)
Table 9 North America Drilling Services Market, By Application, 2013 - 2019 (USD MN)
Table 10 North America Drilling Services Market in Onshore, By Country, 2013 - 2019 (USD MN)
Table 11 North America Drilling Services Market in Offshore, By Country, 2013 - 2019 (USD MN)
Table 12 North America Drilling Services Market, By Service Type, 2013 - 2019 (USD MN)
Table 13 North America Drilling Services Market: Type Comparison With Parent Market, 2013–2019 (USD MN)
Table 14 North America Contract Drilling Market, By Country, 2013–2019 (USD MN)
Table 15 North America Directional Drilling Market, By Country, 2013 - 2019 (USD MN)
Table 16 North America Logging While Drilling Market, By Country, 2013 - 2019 (USD MN)
Table 17 North America Drilling Waste Management Market, By Country, 2013 - 2019 (USD MN)
Table 18 North America Drilling Services Market, By Country, 2013 - 2019 (USD MN)
Table 19 U.S. Drilling Services Market, By Application, 2013-2019 (USD MN)
Table 20 U.S. Drilling Services Market, By Service Type, 2013 - 2019 (USD MN)
Table 21 Canada Drilling Services Market, By Application, 2013-2019 (USD MN)
Table 22 Canada Drilling Services Market, By Service Type, 2013 - 2019 (USD MN)
Table 23 Mexico Drilling Services Market, By Application, 2013-2019 (USD MN)
Table 24 Mexico Drilling Services Market, By Service Type, 2013 - 2019 (USD MN)
Table 25 North America Drilling Service Market: Company Share Analysis, 2013 (%)
Table 26 North America Drilling Services Market: New Product Launches
Table 27 North America Drilling Service Market: Contracts and Agreements
Table 28 North America Drilling Service Market: Mergers & Acquisitions
Table 29 North America Drilling Service Market: Business Expansion
Table 30 North America Drilling Service Market: Others
Table 31 Baker Hughes Inc.: Key Financials, 2009 - 2013 (USD MN)
Table 32 Baker Hughes Inc.: Revenue By Business Segment, 2009 - 2013 (USD MN)
Table 33 Baker Hughes Inc.: Revenue By Geographical Segment, 2009 - 2013 (USD MN)
Table 34 Baker Hughes Inc.: Product and Service Offerings
Table 35 Baker Hughes Inc.: Related Developments
Table 36 Halliburton Co.: Key Financials, 2009 - 2013 (USD MN)
Table 37 Halliburton Co.: Revenue, By Business Segment, 2009 - 2013 (USD MN)
Table 38 Halliburton Co.: Revenue, By Geographical Segment, 2009 - 2013 (USD MN)
Table 39 Halliburton Co.: Product and Services Offerings
Table 40 Halliburton Co.: Related Developments
Table 41 Schlumberger Ltd.: Key Financials, 2009 - 2013 (USD MN)
Table 42 Schlumberger Ltd.: Net Sales By Business Segment (USD MN)
Table 43 Schlumberger Ltd.: Product and Service Offerings
Table 44 Schlumberger Ltd.: Related Developments
Table 45 Weatherford International PLC: Key Financials, 2009 - 2013 (USD MN)
Table 46 Weatherford International PLC: Revenue By Business Segment, 2009-2013 (USD MN)
Table 47 Weatherford International PLC: Revenue By Geographical Segment, 2009-2013 (USD MN)
Table 48 Weatherford International PLC: Product and Service Offerings
Table 49 Weatherford International PLC: Related Developments
Table 50 Nabors Industries Ltd.: Key Financials (USD MN)
Table 51 Nabors Industries Ltd.: Revenue By Geographical Segment, 2009-2013 (USD MN)
Table 52 Nabors Industries Ltd.: Products and Services Offerings
Table 53 Nabors Industries Ltd.: Related Developments
Table 54 Superior Energy Services Inc.: Key Financials, 2009 - 2013 (USD MN)
Table 55 Superior Energy Services Inc.: Revenue By Business Segment, 2009-2013 (USD MN)
Table 56 Superior Energy Services Inc.: Revenue By Geographical Segment, 2009-2013 (USD MN)
Table 57 Superior Energy Services Inc.: Product and Service Offerings
Table 58 Superior Energy Services Inc.: Related Developments
Table 59 Ensco PLC: Key Financials, 2009 - 2013 (USD MN)
Table 60 Ensco PLC: Product and Service Offerings
Table 61 Ensco PLC: Related Developments
Table 62 Transocean Ltd.: Key Financials, 2009 - 2013 (USD MN)
Table 63 Transocean Ltd.: Revenue By Geographical Segment, 2009-2013 (USD MN)
Table 64 Transocean Ltd.: Product and Service Offerings
Table 65 Transocean Ltd.: Related Developments
List of Figures (47 Figures)
Figure 1 North America Drilling Services Market: Segmentation & Coverage
Figure 2 Drilling Services Market: Integrated Ecosystem
Figure 3 Research Methodology
Figure 4 Top-Down Approach
Figure 5 Bottom-Up Approach
Figure 6 Demand Side Approach
Figure 7 Macro Indicator-Based Approach: Number of Newly Drilled Wells (2013)
Figure 8 North America Drilling Services Market Snapshot
Figure 9 North America Drilling Services: Growth Comparison, 2014-2019
Figure 10 North America Drilling Services: Comparison With Parent Market, 2013-2019 (USD MN)
Figure 11 North America Drilling Services Market, By Application, 2014 & 2019 (USD MN)
Figure 12 North America Drilling Services Market, By Service Type, 2014 & 2019 (USD MN)
Figure 13 North America Drilling Services Market: Comparison With Application Market, 2013 - 2019
Figure 14 North America Drilling Services Market, By Application, 2014 - 2019 (USD MN)
Figure 15 North America Drilling Services Market in Onshore, By Country, 2013 - 2019 (USD MN)
Figure 16 North America Drilling Services Market in Offshore, By Country, 2013 – 2019 (USD MN)
Figure 17 North America Drilling Services Market, By Service Type, 2014 & 2019 (USD MN)
Figure 18 North America Drilling Service Market: Type Comparison With Oilfield Services Market, 2013–2019 (USD MN)
Figure 19 North America Contract Drilling Market, By Country, 2013–2019 (USD MN)
Figure 20 North America Directional Drilling Market, By Country, 2013 - 2019 (USD MN)
Figure 21 North America Logging While Drilling Market, By Country, 2013 - 2019 (USD MN)
Figure 22 North America Drilling Waste Management Market, By Country, 2013 - 2019 (USD MN)
Figure 23 North America Drilling Services Market: Growth Analysis, By Country, 2014-2019 (USD MN)
Figure 24 U.S. Drilling Services Market Overview, 2014 & 2019 (%)
Figure 25 U.S. Drilling Services Market, By Application, 2013-2019 (USD MN)
Figure 26 U.S. Drilling Services Market: Application Snapshot
Figure 27 U.S. Drilling Services Market, By Service Type, 2013-2019 (USD MN)
Figure 28 U.S. Drilling Services Market Share, By Service Type, 2014-2019 (%)
Figure 29 Canada Drilling Services Market Overview, 2014 & 2019 (%)
Figure 30 Canada Drilling Services Market, By Application, 2013-2019 (USD MN)
Figure 31 Canada Drilling Service Market: Application Snapshot
Figure 32 Canada Drilling Services Market, By Services Type, 2013-2019 (USD MN)
Figure 33 Canada Drilling Services Market Share, By Service Type, 2014-2019 (%)
Figure 34 Mexico Services Market Overview, 2014 & 2019 (%)
Figure 35 Mexico Drilling Services Market, By Application, 2013-2019 (USD MN)
Figure 36 Mexico Drilling Services Market: Application Snapshot
Figure 37 Mexico Drilling Services Market, By Service Type, 2013-2019 (USD MN)
Figure 38 Mexico Drilling Services Market Share, By Service Type, 2014-2019 (%)
Figure 39 Drilling Services Market: Company Share Analysis, 2013 (%)
Figure 40 Baker Hughes Incorporated: Revenue Mix, 2013 (%)
Figure 41 Halliburton Co.: Company Revenue Mix, 2013 (%)
Figure 42 Schlumberger Ltd.: Revenue Mix, 2013 (%)
Figure 43 Weatherford International PLC: Revenue Mix, 2013 (%)
Figure 44 Nabors Industries Ltd.: Revenue Mix, 2013 (%)
Figure 45 Superior Energy Services Inc.: Revenue Mix, 2013 (%)
Figure 46 Ensco PLC: Revenue Mix, 2013 (%)
Figure 47 Transocean Ltd.: Revenue Mix, 2013 (%)
Drilling is an integral part in exploration and production activities. There are various services that are associated with drilling such as contract drilling, directional drilling and logging while drilling which are further discussed in this report. Coupled with increasing day rates and record backlog orders, contract drilling companies find a bright outlook and add new equipment to their fleet to provide the most versatile fleets of mobile drilling units. The drilling services market is driven by the increasing investments in exploration and production (E&P) activities.
The North American drilling services market was valued at $83,733.8 million in 2014 and is projected to reach a market size of $98,936.4 million by 2019 at a CAGR of 3.4% from 2014 to 2019. The market in U.S. accounted for the largest share of 70% in 2013, and is expected to reach a value of $68,347.1 million by 2019, at a CAGR of 3.2% from 2014 to 2019.
An in-depth market share analysis, by revenue, of the top companies is included in the report. These numbers are arrived at, based on key facts, annual financial information from SEC filings, annual reports and interviews with industry experts and key opinion leaders, such as CEOs, directors, and marketing executives. Top market players that have established their base in the North American drilling services market are Schlumberger (U.S.), Weatherford (Ireland), Baker Hughes (U.S.), Halliburton (U.S.), and Superior Energy Services (U.S.).
Please visit https://www.micromarketmonitor.com/custom-research-services.html to specify your custom Research Requirement
| PRODUCT TITLE | PUBLISHED | |
|---|---|---|
|
|
South America Oilfield Services The oilfield services market in South America was valued around $14.04 billion in 2013, with a market share of 9.3% globally. Projected to grow at a CAGR of 17% from 2014 to 2019, the market is led by Weatherford, Halliburton, Schlumberger, and Baker Hughes. It is segmented on the basis of types of oilfield services and countries present in the region. |
Apr 2015 |
|
|
Asia-Pacific Oilfield Services The oilfield services market in Asia Pacific was valued around $31598 million in 2013, with a market share of almost 20% globally. Projected to grow at a CAGR of 14% from 2014 to 2019, the market is led by Weatherford, Halliburton, Schlumberger, and Baker Hughes. It is segmented on the basis of types of oilfield services and countries in the region. |
Apr 2015 |
|
|
Middle East Oilfield Services Middle East oilfield services market was valued at $73,405.6 million in 2014 and is projected to grow at a CAGR of 4.2% from 2014 to 2019 to reach a market size of $90,150.1 by 2019. The large share is attributed to the rise in exploration of new reserves which requires increased drilling activities. |
May 2015 |
|
|
Africa Oilfield Services The oilfield services market in Africa was valued around $7642 million in 2013, with a market share of 5% globally. Projected to grow at a CAGR of 14.4% from 2014 to 2019, the market is led by Weatherford, Halliburton, Schlumberger, and Baker Hughes. It is segmented on the basis of types of oilfield services and countries present in the region. |
Apr 2015 |
|
|
Europe Oilfield Services The European oilfield services market was valued at $45,592.5 million in 2014, and is projected to reach $60,017.5 million by 2019, at a CAGR of 5.7% from 2014 to 2019. The growth of this market can be attributed to the rise in exploration activities of new reserves, which requires increased drilling activities. The drilling services segment accounted for the largest share of 59.2% of the European oilfield services market in 2014. |
Apr 2015 |
|
|
North America Oilfield Services The oilfield services market in North America was valued around $76.85 billion in 2013, with a market share of 50.8% globally. Projected to grow at a CAGR of 9.8% from 2014 to 2019, the market is led by Weatherford, Halliburton, Schlumberger, and Baker Hughes. It is segmented on the basis of types of oilfield services and countries present in the region. |
Upcoming |


