

Africa Drilling Services Market by Service (Contract Drilling, Directional Drilling, LWD, Drilling Waste Management), Application (Onshore & Offshore), Country - Analysis & Forecasts To 2019
- Publish Date: Apr 2015


The purpose of this report is to cover the definition, description, and forecast of the Africa drilling services market. It involves a deep dive analysis of the market segmentation, on the basis of application, service, and geography. The report also gives deep insights into the competitive landscape of the market through strategic analysis of the key players. The African drilling services market, in terms of type, has been segmented into conventional and rotary steerable systems.
The oil & gas sector relies heavily on drilling services to explore the offshore areas, facilitate development in environmentally sensitive areas, and provide production enhancement through horizontal and directional drilling.
The Africa drilling services market was valued $18,019.2 million in 2014 and is projected to reach $22,169.5 million by 2019, at a CAGR of 4.2% during the forecast period, 2014 to 2019. The increase in the demand for energy over the years and depletion of many of the existing reservoirs has necessitated exploration of new reservoirs which are situated mainly in the offshore areas. Since the reservoirs with complex geological structures are hard to drill vertically, directional drilling services play a significant role in such explorations.
The contract drilling segment held the largest share in the African drilling services market in 2014 and accounted for a market share of 86.8%.
The key companies operating in the African drilling services market are Halliburton Co. (U.S.), Schlumberger Ltd. (U.S.), Baker Hughes Inc. (U.S.), Weatherford International Ltd. (Ireland), and Superior Energy Services Inc. (U.S.).
Market share analysis, by revenue, of the top companies is also included in the report. The report aids the market participants to identify high growth areas and help them in managing key investment decisions. For this report, the key players in the African drilling services market have been identified through various primary and secondary sources, which include annual reports of top market players, interviews with key opinion leaders, such as CEOs, directors, and marketing executives. Based on this research, the market shares have been evaluated and validated.
Table of Contents
1 Introduction (Page No. - 11)
1.1 Objectives of the Study
1.2 Market Segmentation & Coverage
1.3 Stakeholders
2 Research Methodology (Page No. - 13)
2.1 Integrated Ecosystem of Africa Drilling Services Market
2.2 Arriving at the Africa Drilling Services Market Size
2.2.1 Top-Down Approach
2.2.2 Bottom-Up Approach
2.2.3 Demand Side Approach
2.2.4 Macro Indicator-Based Approach
2.3 Assumptions
3 Executive Summary (Page No. - 21)
4 Market Overview (Page No. - 23)
4.1 Introduction
4.2 Africa Drilling Services : Comparison With Parent Market
4.3 Market Drivers and Inhibitors
4.4 Key Market Dynamics
4.5 Demand Side Analysis
5 African Drilling Services Market, By Application (Page No. - 29)
5.1 Introduction
5.2 Africa Drilling Services in Onshore, By Country
5.3 Africa Drilling Services in Offshore, By Country
6 African Drilling Services Market, By Service (Page No. - 35)
6.1 Introduction
6.2 Africa Drilling Services Market: Comparison With Parent Market, 2013-2019 (USD MN)
6.3 Africa Contract Drilling Market, By Country
6.4 Africa Directional Drilling Market, By Country
6.5 Africa Logging While Drilling Market, By Country
6.6 Africa Drilling Waste Management Market, By Country
7 African Drilling Services Market, By Country (Page No. - 43)
7.1 Introduction
7.2 Angola Drilling Services Market
7.2.1 Angola Drilling Services Market, By Application
7.2.2 Angola Drilling Services Market, By Service
7.3 Algeria Drilling Services Market
7.3.1 Algeria Drilling Services Market, By Application
7.3.2 Algeria Drilling Services Market, By Service
7.4 Nigeria Drilling Services Market
7.4.1 Nigeria Drillng Services Market, By Application
7.4.2 Nigeria Drilling Services Market, By Service
7.5 Egypt Drillng Services Market
7.5.1 Egypt Drilling Services, By Application
7.5.2 Egypt Drilling Services, By Services
8 African Drilling Services Market : Competitive Landscape (Page No. - 59)
8.1 Africa Drilling Services Market: Company Share Analysis
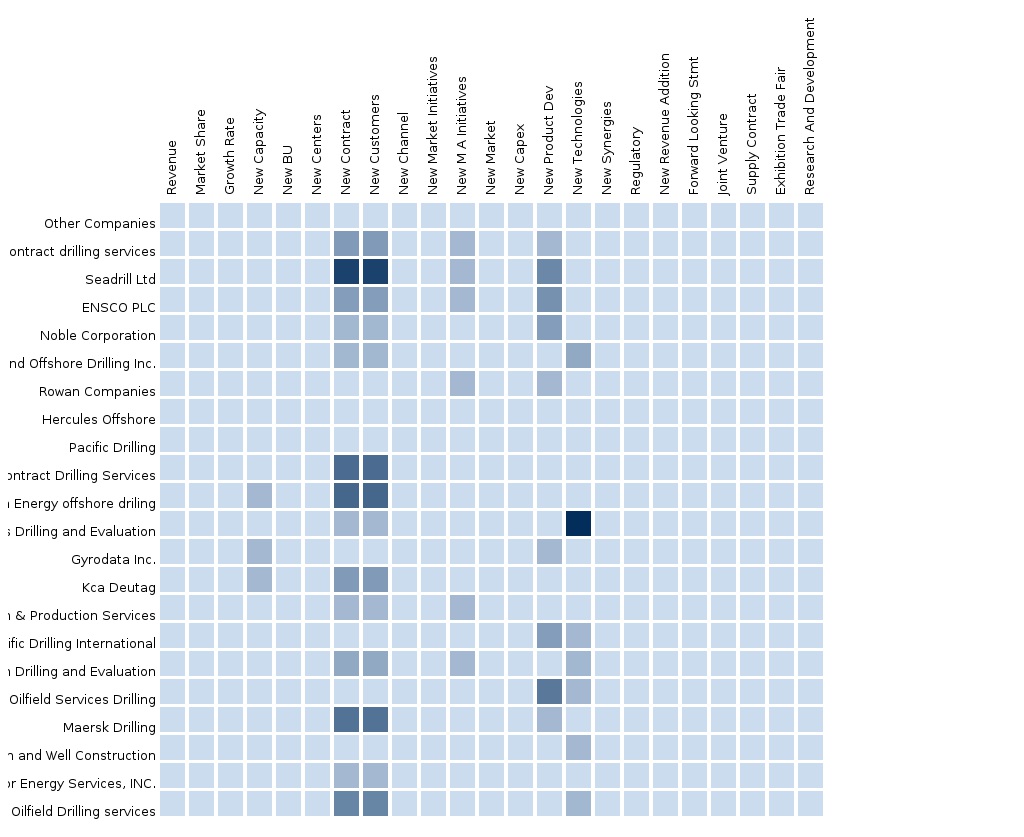
8.2 Company Presence in Drilling Services Market, By Service
8.3 Mergers & Acquisitions
8.4 New Products and Services Launches
8.5 New Contracts and Agreements
9 African Drilling Services Market, By Company (Page No. - 62)
9.1 Baker Hughes Incorporated
9.1.1 Overview
9.1.2 Key Operations Data
9.1.3 Key Financials
9.1.4 Product and Service Offering
9.1.5 Related Developments
9.1.6 MMM View
9.2 Nabors Industries Ltd.
9.2.1 Introduction
9.2.2 Key Operations Data
9.2.3 Key Financials
9.2.4 Products and Services
9.2.5 Related Developments
9.2.6 MMM View
9.3 Schlumberger Limited
9.3.1 Overview
9.3.2 Key Operations Data
9.3.3 Key Financials
9.3.4 Product and Service Offerings
9.3.5 Related Developments
9.3.6 MMM View
9.4 Halliburton Co.
9.4.1 Overview
9.4.2 Key Operations Data
9.4.3 Key Financials
9.4.4 Products & Services
9.4.5 Related Developments
9.4.6 MMM View
9.5 Weatherford International PLC
9.5.1 Overview
9.5.2 Key Operations Data
9.5.3 Key Financials
9.5.4 Product and Service Offerings
9.5.5 Related Developments
9.5.6 MMM View
9.6 Superior Energy Services Incorporated
9.6.1 Overview
9.6.2 Key Operations Data
9.6.3 Key Financials
9.6.4 Product and Service Offerings
9.6.5 Related Developments
9.6.6 MMM View
9.7 National Oilwell Varco
9.7.1 Overview
9.7.2 Key Operational Data
9.7.3 Key Financial
9.7.4 Product and Service Offerings
9.7.5 Related Developments
9.7.6 MMM View
9.8 Seadrill Ltd.
9.8.1 Overview
9.8.2 Key Operations Data
9.8.3 Key Finacials
9.8.4 Product and Service Offerings
9.8.5 Related Developments
9.8.6 MMM View
9.9 Transocean Ltd
9.9.1 Overview
9.9.2 Key Operations Data
9.9.3 Key Finacials
9.9.4 Product and Service Offerings
9.9.5 Related Developments
9.9.6 MMM View
10 Appendix (Page No. - 98)
10.1 Customization Options
10.1.1 Products and Services Benchmarking Analysis
10.1.2 Regulatory Framework
10.1.3 Impact Analysis
10.1.4 Current Industry Challenges
10.1.5 Beneficial Reuse of Drilling Wastes
10.1.6 Historical Data and Trends
10.1.7 Drilling Services In-Depth Value Chain Analysis
10.2 Introducing RT: Real-Time Market Intelligence
10.2.1 RT Snapshots
List of Tables (55 Tables)
Table 1 Africa Drilling Services Peer Market Size, 2013 (USD MN)
Table 2 Africa Drilling Services Market, By Application , 2013 (USD MN)
Table 3 Africa Drilling Services Market: Macro Indicators, By Country, 2013
Table 4 Africa Drilling Services Market: Comparison With Parent Market, 2013– 2019 (USD MN)
Table 5 Africa Drilling Services Market: Drivers and Inhibitors
Table 6 Africa Drilling Services Market, By Application, 2013 - 2019 (USD MN)
Table 7 Africa Drilling Services Market, By Service, 2013 - 2019 (USD MN)
Table 8 Africa Drilling Services Market: Comparison With Application Markets, 2013- 2019 (USD MN)
Table 9 Africa Drilling Services Market, By Application, 2013 – 2019 (USD MN)
Table 10 Africa Drilling Services Market, By Application, Onshore, 2013-2019 (USD MN)
Table 11 Africa Drilling Services Market, By Application, Offshore, 2013-2019 (USD MN)
Table 12 Africa Drilling Services Market, By Service, 2013 - 2019 (USD MN)
Table 13 Africa Drillng Services Comparison With Parent Market, 2013–2019 (USD MN)
Table 14 Africa Drilling Services, By Service, Contract Drilling 2013–2019 (USD MN)
Table 15 Africa Drilling Services, By Service, Directional Drilling, 2013-2019 (USD MN)
Table 16 Africa Drilling Services Market, By Service, Lwd, 2013- 2019 (USD MN)
Table 17 Africa Drilling Services Market, By Service, Drilling Waste Management 2013 – 2019 (USD MN)
Table 18 Africa Drilling Services Market, By Country, 2013 – 2019 (USD MN)
Table 19 Angola Drilling Services Market, By Application, 2013-2019 (USD MN)
Table 20 Angola Drillng Services Market, By Service, 2013 – 2019 (USD MN)
Table 21 Algeria Drilling Services Market, By Application, 2013 – 2019 (USD MN)
Table 22 Algeria Drilling Service Market, By Service, 2013 - 2019 (USD MN)
Table 23 Nigeria Drilling Services Market, By Application, 2013 - 2019 (USD MN)
Table 24 Nigeria Drillng Servives: Market, By Service, 2013 – 2019 (USD MN)
Table 25 Egypt Drillng Services, By Application, 2013-2019 (USD MN)
Table 26 Egypt Drillng Services, By Service, 2013-2019, (USD MN)
Table 27 Africa Drilling Services Market: Company Share Analysis, 2013 (%)
Table 28 Africa Drilling Services Market : Mergers & Acquisitions
Table 29 Africa Drilling Services Market: New Products and Service Launches
Table 30 Africa Drilling Services Market : New Contracts and Agreements
Table 31 Baker Hughes Incorporated.: Key Operations Data, 2009 - 2013 (USD MN)
Table 32 Baker Hughes Incorporated.: Revenue, By Business Segment, 2009 - 2013 (USD MN)
Table 33 Baker Hughes Incorporated.: Revenue, By Geographical Segment, 2009 - 2013 (USD MN)
Table 34 Nabors Industries Ltd.: Key Operations Data 2009-2013 (USD MN)
Table 35 Nabors Industries Ltd : Revenue By Geographical Segment, 2009-2013 (USD MN)
Table 36 Schlumberger Limited: Key Operations Data, 2010-2013 (USD MN)
Table 37 Schlumberger Limited: Market Revenue, By Business Segments, 2010-2013 (USD MN)
Table 38 Schlumberger Limited: Market Revenue, By Geography Segment, 2010 – 2013 (USD MN)
Table 39 Halliburton Company: Key Operations Data, 2009-2013 (USD MN)
Table 40 Halliburton Company: Market Revenue, By Business Segments 2009-2013 (USD MN)
Table 41 Halliburton Company: Market Revenue, By Geography Segment, 2009 – 2013 (USD MN)
Table 42 Weatherford International PLC.: Key Operations Data, 2009 - 2013 (USD MN)
Table 43 Weatherford International PLC. : Market Revenue, By Business Segments, 2009-2013 (USD MN)
Table 44 Weatherford International.PLC: Market Revenue, By Geographical Segments, 2009 – 2013 (USD MN)
Table 45 Superior Energy Services Incorporated: Key Operations Data, 2009 - 2013 (USD MN)
Table 46 Superior Energy Services Incorporated: Market Revenue, By Business Segments, 2009 - 2013 (USD MN)
Table 47 Superior Energy Services Incorporated: Market Revenue, By Geographic Segment, 2009-2013 (USD MN)
Table 48 Superior Energy Services Incorporated : Subsidiaries & Its Intervention Services
Table 49 National Oilwell Varco: Key Operations Data, 2009 - 2013 (USD MN)
Table 50 National Oilwell Varco: Revenue, By Business Segment, 2009 - 2013 (USD MN)
Table 51 National Oilwell Varco: Key Financials, By Geography Segment, 2009 - 2013 (USD MN)
Table 52 Seadrill Ltd.: Key Operations Data, 2009 - 2013 (USD MN)
Table 53 Seadrill Ltd. Revenue By Business Segment, 2009 - 2013 (USD MN)
Table 54 Transocean Ltd.: Key Operations Data, 2009 - 2013 (USD MN)
Table 55 Transocean Ltd.: Revenue By Geographic Segment, 2009-2013 (USD MN)
List of Figures (54 Figures)
Figure 1 Africa Drilling Services Market: Segmentation & Coverage
Figure 2 Africa Drilling Services Market: Integrated Ecosystem
Figure 3 Research Methodology
Figure 4 Top-Down Approach
Figure 5 Bottom-Up Approach
Figure 6 Demand Side Approach
Figure 7 Macro Indicator-Based Approach
Figure 8 Africa Drilling Services Market, Market Snapshot
Figure 9 Africa Drilling Services: Comparison With Parent Market
Figure 10 Africa Drilling Services Market, By Application, 2014 - 2019
Figure 11 Africa Drilling Services Market, By Country, 2014 (USD MN)
Figure 12 Demand Side Analysis, 2013-2019 (USD MN)
Figure 13 Africa Drilling Services: Application Market Scenario
Figure 14 Africa Drilling Services Market, By Application, 2014 - 2019 (USD MN)
Figure 15 Africa Drilling Services Market in Onshore, By Country, 2013-2019 (USD MN)
Figure 16 Africa Drilling Services Market in Offshore, By Country, 2013-2019 (USD MN)
Figure 17 Africa Drilling Services Market, By Service, 2014 - 2019 (USD MN)
Figure 18 Africa Drilling Services Market: Comparison With Parent Market, 2013–2019 (USD MN)
Figure 19 Africa Contract Drilling Market, By Country, 2013–2019 (USD MN)
Figure 20 Africa Directional Drilling, By Country, 2013-2019 (USD MN)
Figure 21 Africa Logging While Drilling Market, By Country, 2013-2019 (USD MN)
Figure 22 Africa Drilling Waste Management Market, By Country, 2013–2019 (USD MN)
Figure 23 Africa Drilling Services Market: Growth Analysis, By Country, 2013-2019 (USD MN)
Figure 24 Angola Drilling Services Market Overview, 2014 & 2019 (%)
Figure 25 Angola Drilling Services Market, By Application, 2013-2019 (USD MN)
Figure 26 Angola Drilling Services Market: Application Snapshot, 2014 - 2019 (USD MN)
Figure 27 Angola Drilling Services Market, By Service, 2013 - 2019 (USD MN)
Figure 28 Angola Drilling Services Market Share, By Service, 2014-2019 (%)
Figure 29 Algeria Drilling Services Market Overview, 2014 & 2019 (%)
Figure 30 Algeria Drilling Service Market, By Application, 2013-2019 (USD MN)
Figure 31 Algeria Drilling Services Market: Application Snapshot, 2014 - 2019 (USD MN)
Figure 32 Algeria Drilling Services Market, By Service, 2013- 2019 (USD MN)
Figure 33 Algeria Drilling Services Market Share, By Service, 2014-2019 (%)
Figure 34 Nigeria Drilling Services Market Overview, 2014 & 2019 (%)
Figure 35 Nigeria Drilling Services Market, By Application, 2013 - 2019 (USD MN)
Figure 36 Nigeria Drilling Services Market: Application Snapshot, 2014-2019 (USD MN)
Figure 37 Nigeria Drillng Services Market, By Services, 2013 - 2019 (USD MN)
Figure 38 Nigeria Drilling Services Market Share By Service, 2014-2019 (%)
Figure 39 Egypt Drilling Services Market Overview, 2014 & 2019, Market Overview (%)
Figure 40 Egypt Drillng Services, By Appliction, 2013-2019 (USD MN)
Figure 41 Nigeria Drilling Services Market: Application Snapshot, 2014-2019 (USD MN)
Figure 42 Egypt Drilling Services, By Services, 2013-2019 (USD MN)
Figure 43 Egypt Drilling Services Market Share By Service, 2014-2019 (%)
Figure 44 Africa Drilling Services Market: Company Share Analysis, 2013 (%)
Figure 45 Drilling Services: Company Product Coverage, By Service, 2013
Figure 46 Baker Hughes Incorporated: Revenue Mix, 2013 (%)
Figure 47 Nabors Industries Ltd.: Revenue Mix, 2013 (%)
Figure 48 Schlumberger Limited: Revenue Mix, 2013 (%)
Figure 49 Halliburton Company Revenue Mix: 2013 (%)
Figure 50 Weatherford International PLC Revenue Mix: 2013 (%)
Figure 51 Superior Energy Services Inc. : Revenue Mix, 2013 (%)
Figure 52 National Oilwell Varco, Revenue Mix, 2013 (%)
Figure 53 Seadrill Ltd., Revenue Mix, 2013 (%)
Figure 54 Transocean Ltd.: Revenue Mix, 2013 (%)
The African drilling services market is witnessing a decent growth spurred by the increase in energy demands, advancements in technology, and sizable investments. Angola dominates the African drilling services market, followed by Nigeria and Egypt. In terms of services, contract drilling services held the largest market share in the African drilling services market in 2014. On the basis of application, the African drilling services market was dominated by offshore application segment but onshore application segment is also expected to gain traction in the coming years.
Directional drilling is a technique used for drilling non-vertical wells. It is a method that involves deviation of a wellbore along a planned path to explore oil from a targeted position in the typical geologic structural oilfields. The directional drilling market has witnessed slow growth in the past few years, but is expected to gain momentum in the coming years due to increasing investments in exploration and production (E&P) activities. Another factor contributing to the growth of directional drilling services segment of the African drilling services market is that the production rate of horizontal wells is very high in comparison to vertical wells.
This report covers the African drilling services market on the basis of different types of services, which include contract drilling, directional drilling, LWD, and drilling waste management. Contract drilling is the leading service segment of the African drilling services market and accounted for a market share of 86.8% in 2014. Directional drilling services is the second-largest service segment and accounted for a market share of 9.7% in 2014. With the advancement in technology, motors are estimated to have a slow growth rate as compared to other services in the African drilling services market. The lucrative and high investment areas of the African drilling services market, on the basis of offshore application segment are Angola and Nigeria which are driving the exponential growth of the market.
An in-depth market share analysis, by revenue, of the top companies is included in this report. These numbers are arrived at, based on key facts, annual financial information from annual reports and interviews with industry experts and key opinion leaders, such as CEOs, directors, and marketing executives. The key market players who have established their base in the African drilling services market are Schlumberger Limited (U.S.), Halliburton Co. (U.S.), and Baker Hughes (U.S.).
Please visit https://www.micromarketmonitor.com/custom-research-services.html to specify your custom Research Requirement
| PRODUCT TITLE | PUBLISHED | |
|---|---|---|
|
|
South America Oilfield Services The oilfield services market in South America was valued around $14.04 billion in 2013, with a market share of 9.3% globally. Projected to grow at a CAGR of 17% from 2014 to 2019, the market is led by Weatherford, Halliburton, Schlumberger, and Baker Hughes. It is segmented on the basis of types of oilfield services and countries present in the region. |
Apr 2015 |
|
|
Asia-Pacific Oilfield Services The oilfield services market in Asia Pacific was valued around $31598 million in 2013, with a market share of almost 20% globally. Projected to grow at a CAGR of 14% from 2014 to 2019, the market is led by Weatherford, Halliburton, Schlumberger, and Baker Hughes. It is segmented on the basis of types of oilfield services and countries in the region. |
Apr 2015 |
|
|
Middle East Oilfield Services Middle East oilfield services market was valued at $73,405.6 million in 2014 and is projected to grow at a CAGR of 4.2% from 2014 to 2019 to reach a market size of $90,150.1 by 2019. The large share is attributed to the rise in exploration of new reserves which requires increased drilling activities. |
May 2015 |
|
|
Africa Oilfield Services The oilfield services market in Africa was valued around $7642 million in 2013, with a market share of 5% globally. Projected to grow at a CAGR of 14.4% from 2014 to 2019, the market is led by Weatherford, Halliburton, Schlumberger, and Baker Hughes. It is segmented on the basis of types of oilfield services and countries present in the region. |
Apr 2015 |
|
|
Europe Oilfield Services The European oilfield services market was valued at $45,592.5 million in 2014, and is projected to reach $60,017.5 million by 2019, at a CAGR of 5.7% from 2014 to 2019. The growth of this market can be attributed to the rise in exploration activities of new reserves, which requires increased drilling activities. The drilling services segment accounted for the largest share of 59.2% of the European oilfield services market in 2014. |
Apr 2015 |
|
|
North America Oilfield Services The oilfield services market in North America was valued around $76.85 billion in 2013, with a market share of 50.8% globally. Projected to grow at a CAGR of 9.8% from 2014 to 2019, the market is led by Weatherford, Halliburton, Schlumberger, and Baker Hughes. It is segmented on the basis of types of oilfield services and countries present in the region. |
Upcoming |


