

North America Wireline Services Market by Service Type (Logging, Well Intervention, and Completion), by Application (Onshore and Offshore), & by Country –Trends & Forecasts to 2019
- Publish Date: May 2015


This report describes, defines, and forecasts the North America wireline services market. It involves an in-depth analysis of the market segmentation, which is based on type and country. The report also provides deep insights into the competitive landscape through a strategic analysis of the key players of the market. The wireline services market, in terms of type, has been segmented into logging, well intervention, and completion.
Wireline services are precisely used to run tools and equipment into the downhole before and after the completion is carried out. These services are provided by oilfield service companies to the oil & gas companies. Wireline services are used to recover both oil & gas.
The North America wireline services market was valued at $8,566.1 million in 2014, and is projected to reach $9,985.1 million by 2019, at a CAGR of 3.1% from 2014 to 2019. The large share is attributed to the rise in exploration of new reserves which require increased drilling activities.
The logging market accounted for the largest share of 83% within the wireline services market in 2014.
This report covers the North America well intervention market by the intensity of drilling and exploration activities along with the reinforcement of existing crude oil reserves. It highlights some of the key industrial issues and market impulse factors. It also describes some of the important market dynamics such as driver and restraints of the well intervention market.
For this report, the major players in the market have been identified through secondary and primary research, based on which their market shares have been evaluated. This includes a study of the annual reports of top market players and interviews with key opinion leaders such as CEOs, directors, and marketing personnel.
To provide an in-depth understanding of the competitive landscape, the report includes profiles of some of the major wireline services market players, which combines manufacturers as well as service providers such as Schlumberger Ltd. (U.S.), Halliburton Co. (U.S.), Baker Hughes (U.S.), and Weatherford International Ltd. (Ireland).
Table of Contents
1 Introduction (Page No. - 10)
1.1 Objectives of the Study
1.2 Market Segmentation and Coverage
1.3 Stakeholders
2 Research Methodology (Page No. - 12)
2.1 Integrated Ecosystem of the North America Wireline Services Market
2.2 Arriving at the North America Wireline Services Market Value
2.2.1 Top-Down Approach
2.2.2 Bottom-Up Approach
2.2.3 Demand Side Approach
2.2.4 Macroindicator-Based Approach
2.3 Assumptions
3 Executive Summary (Page No. - 19)
4 Market Overview (Page No. - 20)
4.1 Introduction
4.2 North America Wireline Services Market: Comparison With Parent Market
4.3 Market Drivers and Inhibitors
4.4 Key Market Dynamics
5 North America Wireline Services Market, By Application (Page No. - 26)
5.1 Introduction
5.2 Demand Side Analysis
5.3 North America Onshore Wireline Services Market, By Country
5.4 North America Offshore Wireline Services Market, By Country
6 North America Wireline Services Market, By Type (Page No. - 31)
6.1 Introduction
6.2 North America Wireline Services Market: Type Comparison With the Oilfield Services Market
6.3 North America Logging Services Market, By Country
6.4 North America Logging Services Market, By Country, 2013–2019 (USD MN)
6.5 North America Well Intervention Services Market, By Country
6.6 North America Well Intervention Services Market, By Country, 2013 - 2019 (USD MN)
6.7 North America Completion Services Market, By Country
6.8 North America Completion Services Market, By Country, 2013 - 2019 (USD MN)
7 North America Wireline Services Market, By Country (Page No. - 37)
7.1 Introduction
7.2 Canada Wireline Services Market
7.2.1 Canada Wireline Services Market, By Application
7.2.2 Canada Wireline Services Market, By Type
7.3 U.S. Wireline Services Market
7.3.1 U.S. Wireline Services Market, By Application
7.3.2 U.S. Wireline Services Market, By Type
7.4 Mexico Wireline Services Market
7.4.1 Mexico Wireline Services Market, By Application
7.4.2 Mexico Wireline Services Market, By Type
8 North America Wireline Services Market,: Competitive Landscape (Page No. - 50)
8.1 North America Wireline Services Market: Company Share Analysis
8.2 Company Presence in the Wireline Services Market, By Type
8.3 Mergers & Acquisitions
8.4 Joint Ventures
8.5 Agreements and Contracts
8.6 New Product Launches
8.7 Other Expansions
9 North America Wireline Services Market: By Company (Page No. - 56)
(Overview, Products and Services, Financials, Strategy & Development)*
9.1 Weatherford International Plc.
9.2 Superior Energy Services Inc.
9.3 Schlumberger
9.4 Baker Hughes Inc.
9.5 Halliburton
9.6 Expro International Group Holdings Ltd.
9.7 Nabors Industries Limited
*Details on Overview, Products and Services, Financials, Strategy & Development Might Not be Captured in Case of Unlisted Companies.
10 Appendix (Page No. - 80)
10.1 Customization Options
10.1.1 Products and Services Benchmarking Analysis
10.1.2 Regulatory Framework
10.1.3 Impact Analysis
10.1.4 Current Industry Challenges
10.1.5 Historical Data and Trends
10.1.6 Wireline Services in Depth Value Chain Analysis
10.2 Related Reports
10.3 Introducing RT: Real Time Market Intelligence
10.3.1 RT Snapshots
List of Tables (44 Tables)
Table 1 Wireline Services, Peer Market, 2013 (USD MN)
Table 2 Wireline Services Market, By Application, 2013 (USD MN)
Table 3 North America Wireline Services Market: Macro Indicator, By Country, 2013
Table 4 North America Wireline Services Market: Comparison With Parent Market, 2013 – 2019 (USD MN)
Table 5 North America Wireline Services Market: Drivers and Inhibitors
Table 6 North America Wireline Services Market, By Application, 2013 - 2019 (USD MN)
Table 7 North America Wireline Services Market, By Type, 2013 - 2019 (USD MN)
Table 8 North America Wireline Services Market, By Country, 2013 - 2019 (USD MN)
Table 9 North America Wireline Services Market, By Application, 2013 - 2019 (USD MN)
Table 10 North America Wireline Services Market: By Type, 2013 - 2019 (USD MN)
Table 11 North America Onshore Wireline Services Market, By Country, 2013 - 2019 (USD MN)
Table 12 North America Offshore Wireline Services Market, By Country, 2013 - 2019 (USD MN)
Table 13 North America Wireline Services Market, By Type, 2013 - 2019 (USD MN)
Table 14 North America Wireline Services Market: Type Comparison With Parent Market, 2013–2019 (USD MN)
Table 15 North America Wireline Services Market, By Country, 2013 - 2019 (USD MN)
Table 16 Canada Wireline Services Market, By Application, 2013-2019 (USD MN)
Table 17 Canada Wireline Services Market, By Type, 2013 - 2019 (USD MN)
Table 18 U.S. Wireline Services Market, By Application, 2013 - 2019 (USD MN)
Table 19 U.S. Wireline Services Market, By Type, 2013 - 2019 (USD MN)
Table 20 Mexico Wireline Services Market, By Application, 2013 - 2019 (USD MN)
Table 21 Mexico Wireline Services Market, By Type, 2013 - 2019 (USD MN)
Table 22 Wireline Services Market: Company Share Analysis, 2013 (%)
Table 23 North America Wireline Services Market: Mergers and Acquisitions
Table 24 North America Wireline Services Market: Joint Ventures
Table 25 North America Wireline Services Market: Agreements and Contracts
Table 26 North America Wireline Services Market: New Product Launches
Table 27 North America Wireline Services Market: Other Expansions
Table 28 Weatherford International Plc.: Key Financials, 2009 - 2013 (USD MN)
Table 29 Net Sales, By Business Segment, 2009-2013 (USD MN)
Table 30 Net Sales, By Geographical Segment, 2009-2013 (USD MN)
Table 31 Superior Energy Services: Key Financials, 2009 - 2013 (USD MN)
Table 32 Net Sales, By Business Segment, 2009- 2013 (USD MN)
Table 33 Net Sales, By Geographical Segment, 2009-2013 (USD MN)
Table 34 Schlumberger: Key Financials, 2009 - 2013 (USD MN)
Table 35 Net Sales, By Business Segment, 2009- 2013 (USD MN)
Table 36 Net Sales, By Geographical Segment, (USD MN)
Table 37 Baker Hughes Incorporated: Key Financial, 2009- 2013 (USD MN)
Table 38 Net Sales, By Business Segment, 2009 - 2013 (USD MN)
Table 39 Net Sales, By Geographical Segment, 2009 - 2013 (USD MN)
Table 40 Net Sales, By Business Segment, 2009-2013 (USD MN)
Table 41 Net Sales, By Geographical Segment, 2009-2013 (USD MN)
Table 42 Expro International Group Holdings Ltd.: Key Financial, 2009 - 2013 (USD MN)
Table 43 Nabors Industries Ltd.: Key Financial, 2009-2013 (USD MN)
Table 44 Net Sales, By Geographical Segment, 2009-2013 (USD MN)
List of Figures (45 Figures)
Figure 1 North America Wireline Services Market: Segmentation and Coverage
Figure 2 Wireline Services Market: Integrated Ecosystem
Figure 3 Research Methodology
Figure 4 Top-Down Approach
Figure 5 Bottom-Up Approach
Figure 6 Demand Side Approach
Figure 7 Macroindicator-Based Approach
Figure 8 North America Wireline Services Market Snapshot
Figure 9 North America Wireline Services Market: Comparison With Parent Market
Figure 10 North America Wireline Services Market, By Application, 2014 & 2019 (USD MN)
Figure 11 North America Wireline Services Market, By Country, 2013 (USD MN)
Figure 12 North America Wireline Services Market, By Application, 2014 & 2019 (USD MN)
Figure 13 Demand Side Analysis
Figure 14 North America Onshore Wireline Services Market, By Country, 2013 - 2019 (USD MN)
Figure 15 North America Offshore Wireline Services Market, By Country, 2013- 2019 (USD MN)
Figure 16 North America Wireline Services Market, By Type, 2014 - 2019 (USD MN)
Figure 17 North America Wireline Services Market: Type Comparison With the Oilfield Services Market, 2013–2019 (USD MN)
Figure 18 North America Logging Services Market, By Country, 2013–2019 (USD MN)
Figure 19 North America Well Intervention Services Market, By Country, 2013 - 2019 (USD MN)
Figure 20 North America Completion Services Market, By Country, 2013 - 2019 (USD MN)
Figure 21 North America Wireline Services Market: Growth Analysis, By Country, 2014 & 2019 (USD MN)
Figure 22 Canada Wireline Services Market Overview, 2014 & 2019 (%)
Figure 23 Canada Wireline Services Market, By Application, 2013-2019 (USD MN)
Figure 24 Canada Wireline Services Market: Application Snapshot
Figure 25 Canada Wireline Services Market, By Type, 2013 - 2019 (USD MN)
Figure 26 Canada Wireline Services Market Share (Value), By Type, 2014 &2019 (%)
Figure 27 U.S. Wireline Services Market Overview, 2014 & 2019 (%)
Figure 28 U.S. Wireline Services Market, By Application, 2013-2019 (USD MN)
Figure 29 U.S. Wireline Services Market: Application Snapshot
Figure 30 U.S. Wireline Services Market, By Type, 2013 - 2019 (USD MN)
Figure 31 U.S. Wireline Services Market Share (Value), By Type, 2014 &2019 (%)
Figure 32 Mexico Wireline Services Market Overview, 2014 & 2019 (%)
Figure 33 Mexico Wireline Services Market, By Application, 2013 - 2019 (USD MN)
Figure 34 Mexico Wireline Services Market: Application Snapshot
Figure 35 Mexico Wireline Services Market, By Type, 2013 - 2019 (USD MN)
Figure 36 Mexico Wireline Services Market: Type Snapshot
Figure 37 North America Wireline Services Market: Company Share Analysis, 2013 (%)
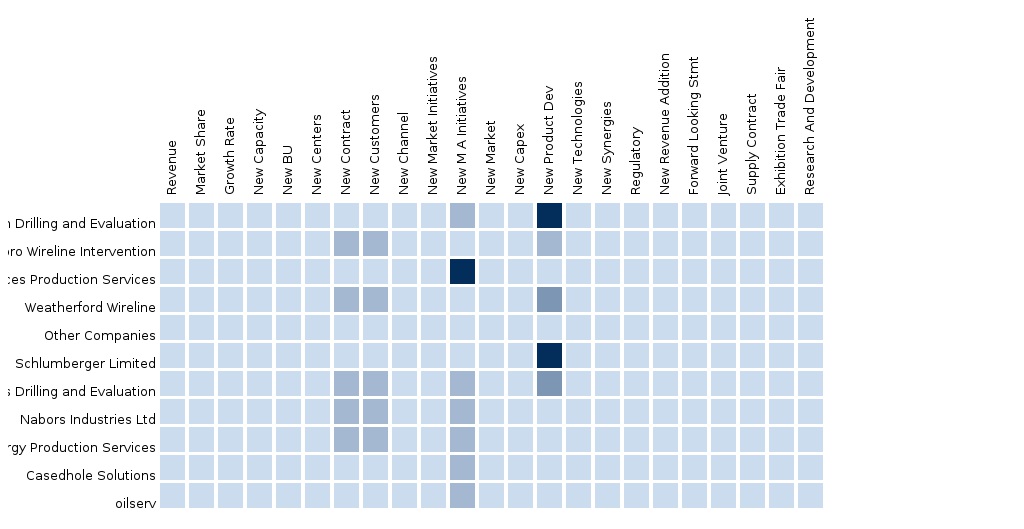
Figure 38 Wireline Services: Company Product Coverage, By Type, 2013
Figure 39 Weatherford International Plc. Revenue Mix, 2013 (%)
Figure 40 Superior Energy Services, Revenue Mix, 2013 (%)
Figure 41 Schlumberger Ltd.: Revenue Mix, 2013 (%)
Figure 42 Baker Hughes Inc.: Revenue Mix, 2013 (%)
Figure 43 Halliburton: Revenue Mix, 2013 (%)
Figure 44 Expro International Group Holdings Ltd.: Revenue Mix, 2013 (%)
Figure 45 Nabors Industries Limited, Revenue Mix, 2013 (%)
Wireline services are used for varied purposes during a well’s life cycle that includes exploration, drilling, completion, stimulation, intervention, and others. These services are precisely used to run tools and equipment into the downhole before and after the completion is done. Wireline services are provided by oilfield service companies to the oil and natural gas E&P companies. In this report, the market has been analyzed on the basis of revenue generated by wireline services, which is a part of the oilfield services market.
Potential increase in recoverable resources and increased exploration & production and completion activities are the most important drivers of the wireline services market. Wireline services are used to recover both oil and natural gas; these services are necessary for any well type in order to complete it and begin production. Increasing focus towards natural gas production also requires wireline services. Currently, natural gas is referred to as transitional fuel for being the chain between conventional resources and renewable energy. This proves to be an advantage to the international natural gas market, and hence, to the wireline services market.
Drilling and completion activities are growing rapidly around the world with over 50% of these activities being carried out in North America, thereby accounting for over 45% of the market share in the global wireline services market. The U.S. is driving the North American wireline services market due to shale boom.
The wireline services market in North America was valued at $8,566.1 million in 2014, and is projected to reach $9,985.1 million by 2019, at a CAGR of 3.1% from 2014 and 2019. The U.S. held the largest share of 81% in 2014, and is expected to reach a value of $8,018 million by 2019, at a CAGR of 2.9% from 2014 to 2019.
An in-depth market share analysis, by revenue, of the top companies has been included in the report. These numbers are arrived at based on key facts, annual financial information from annual reports, and interviews with industry experts and key opinion leaders, such as CEOs, directors, and marketing executives. Schlumberger Limited (U.S.), Halliburton Co. (U.S.), and Baker Hughes (U.S.) are the major players operating in the North America wireline services market.
Please visit https://www.micromarketmonitor.com/custom-research-services.html to specify your custom Research Requirement
| PRODUCT TITLE | PUBLISHED | |
|---|---|---|
|
|
South America Oilfield Services The oilfield services market in South America was valued around $14.04 billion in 2013, with a market share of 9.3% globally. Projected to grow at a CAGR of 17% from 2014 to 2019, the market is led by Weatherford, Halliburton, Schlumberger, and Baker Hughes. It is segmented on the basis of types of oilfield services and countries present in the region. |
Apr 2015 |
|
|
Asia-Pacific Oilfield Services The oilfield services market in Asia Pacific was valued around $31598 million in 2013, with a market share of almost 20% globally. Projected to grow at a CAGR of 14% from 2014 to 2019, the market is led by Weatherford, Halliburton, Schlumberger, and Baker Hughes. It is segmented on the basis of types of oilfield services and countries in the region. |
Apr 2015 |
|
|
Middle East Oilfield Services Middle East oilfield services market was valued at $73,405.6 million in 2014 and is projected to grow at a CAGR of 4.2% from 2014 to 2019 to reach a market size of $90,150.1 by 2019. The large share is attributed to the rise in exploration of new reserves which requires increased drilling activities. |
May 2015 |
|
|
Africa Oilfield Services The oilfield services market in Africa was valued around $7642 million in 2013, with a market share of 5% globally. Projected to grow at a CAGR of 14.4% from 2014 to 2019, the market is led by Weatherford, Halliburton, Schlumberger, and Baker Hughes. It is segmented on the basis of types of oilfield services and countries present in the region. |
Apr 2015 |
|
|
Europe Oilfield Services The European oilfield services market was valued at $45,592.5 million in 2014, and is projected to reach $60,017.5 million by 2019, at a CAGR of 5.7% from 2014 to 2019. The growth of this market can be attributed to the rise in exploration activities of new reserves, which requires increased drilling activities. The drilling services segment accounted for the largest share of 59.2% of the European oilfield services market in 2014. |
Apr 2015 |
|
|
North America Oilfield Services The oilfield services market in North America was valued around $76.85 billion in 2013, with a market share of 50.8% globally. Projected to grow at a CAGR of 9.8% from 2014 to 2019, the market is led by Weatherford, Halliburton, Schlumberger, and Baker Hughes. It is segmented on the basis of types of oilfield services and countries present in the region. |
Upcoming |


