

North America Food and Beverage Hydrocolloids Market by Application (Bakery, Confectionery, Meat and Poultry Products, Sauces and Dressing, Beverages, Dairy Products), by Function, by Type, by Geography - Analysis and Forecast to 2019
- Publish Date: May 2015


The North America food and beverage hydrocolloids market is estimated to grow at a CAGR of 5.3% between 2014 and 2019. Hydrocolloids are polymers with water-binding capacity that can be utilized to impart volume or viscosity to the substances. They are essential food ingredients that impart texture, shape, and flexibility to the food products. Food and beverage hydrocolloids segment is considered as the fastest-growing food additives segment owing to the increasing demand for convenience and healthy food.
Gelatin, xanthan gum, carrageenan, alginates, agar, pectin, guar, locust bean gum, gum arabic, and CMC are the different types of commonly used hydrocolloids. The production cost of these hydrocolloids depends on the source from which they are produced. Some of the raw materials used are commodity market dependent as it is traded in future as well as spot markets globally.
North America food and beverage hydrocolloids market is dominated by the U.S., followed by Canada. In the U.S., the growing health consciousness of consumers and increasing demand for natural products drive the demand for natural food additives. Consumers believe that natural food additives have a positive impact on health, which drives the demand for natural hydrocolloids in food products. This has driven the interest of food manufacturers in natural gums. Natural gums are not only useful functional ingredients, but also natural sources of soluble dietary fiber and are considered healthy ingredients.
The North America food and beverage hydrocolloids market is a competitive market, with various firms such as Cargill, Inc. (U.S.), Ashland Inc. (U.S.), and CP Kelco (U.S.) expanding their presence in this regional market through including new product development, partnerships, mergers & acquisitions and facility expansion.
Scope of the Report
This research report categorizes the North America Hydrocolloids market into the following segments and sub-segments:
By Type
- Gelatin
- Xanthan Gum
- Carrageenan
- Alginates
- Agar
- Pectin
- Guar
- Locust Bean Gum
- Gum Arabic
- CMC
- Others
By Application
- Bakery
- Confectionary
- Meat & Poultry Products
- Sauces & Dressings
- Beverages
- Dairy Products
- Others
By Function
- Thickener
- Stabilizer
- Gelling Agent
- Fat Replacer
- Coating Material
- Others
By Geography
- U.S.
- Canada
- Mexico
Table of Contents
1 Introduction (Page No. - 14)
1.1 Objectives of the Study
1.2 Market Segmentation & Coverage
1.3 Stakeholders
2 Research Methodology (Page No. - 16)
2.1 Integrated Ecosystem of Food and Beverage Hydrocolloids Market
2.2 Arriving at the Food and Beverage Hydrocolloids Market Size
2.2.1 Top-Down Approach
2.2.2 Bottom-Up Approach
2.2.3 Macro Indicator-Based Approach
2.3 Assumptions
3 Executive Summary (Page No. - 24)
4 Market Overview (Page No. - 26)
4.1 Introduction
4.2 Food and Beverage Hydrocolloids Market: Comparison With Food and Beverage Ingredients Market
4.3 Market Drivers and Inhibitors
4.4 Key Market Dynamics
4.5 Demand Side Analysis
5 Food and Beverage Hydrocolloids Market, By Application (Page No. - 34)
5.1 Introduction
5.2 Demand Side Analysis
5.3 Food and Beverage Hydrocolloids in Bakery, By Geography
5.4 Food and Beverage Hydrocolloids in Confectionery, By Geography
5.5 Food and Beverage Hydrocolloids Market in Meat and Poultry Products, By Geography
5.6 Food and Beverage Hydrocolloids Market in Sauces and Dressing, By Geography
5.7 Food and Beverage Hydrocolloids Market in Beverages, By Geography
5.8 Food and Beverage Hydrocolloids Market in Dairy Products, By Geography
6 Food and Beverage Hydrocolloids Market, By Function (Page No. - 49)
6.1 Introduction
6.2 Food and Beverage Hydrocolloids in Thickener, By Geography
6.3 Food and Beverage Hydrocolloids Market in Stabilizer, By Geography
6.4 Food and Beverage Hydrocolloids Market in Gelling Agent, By Geography
6.5 Food and Beverage Hydrocolloids Market in Fat Replacer, By Geography
6.6 Food and Beverage Hydrocolloids in Coating Material, By Geography
7 Food and Beverage Hydrocolloids Market, By Type (Page No. - 61)
7.1 Introduction
7.2 North America Food and Beverage Hydrocolloids Market, Type Comparison With Food and Beverage Ingredients Market
7.3 North America Hydrocolloids Gelatin Market, By Geography
7.4 North America Hydrocolloids Xanthan Gum Market, By Geography
7.5 North America Hydrocolloids Carrageenan Market, By Geography
7.6 North America Hydrocolloids Alginates Market, By Geography
7.7 North America Hydrocolloids Agar Market, By Geography
7.8 North America Hydrocolloids Pectin Market, By Geography
7.9 North America Hydrocolloids Guar Market, By Geography
7.10 North America Hydrocolloids Locust Bean Gum Market, By Geography
7.11 North America Hydrocolloids Gum Arabic Market, By Geography
7.12 North America Hydrocolloids Cmc Market, By Geography
8 Food and Beverage Hydrocolloids Market, By Geography (Page No. - 84)
8.1 Introduction
8.2 U.S. Food and Beverage Hydrocolloids Market
8.2.1 U.S. Food and Beverage Hydrocolloids Market, By Application
8.2.2 U.S. Food and Beverage Hydrocolloids Market, By Function
8.2.3 U.S. Food and Beverage Hydrocolloids Market, By Type
8.3 Mexico Food and Beverage Hydrocolloids Market
8.3.1 Mexico Food and Beverage Hydrocolloids Market, By Application
8.3.2 Mexico Food and Beverage Hydrocolloids Market, By Function
8.3.3 Mexico Food and Beverage Hydrocolloids Market, By Type
8.4 Canada Food and Beverage Hydrocolloids Market
8.4.1 Canada Food and Beverage Hydrocolloids Market, By Application
8.4.2 Canada Food and Beverage Hydrocolloids Market, By Function
8.4.3 Canada Food and Beverage Hydrocolloids Market, By Type
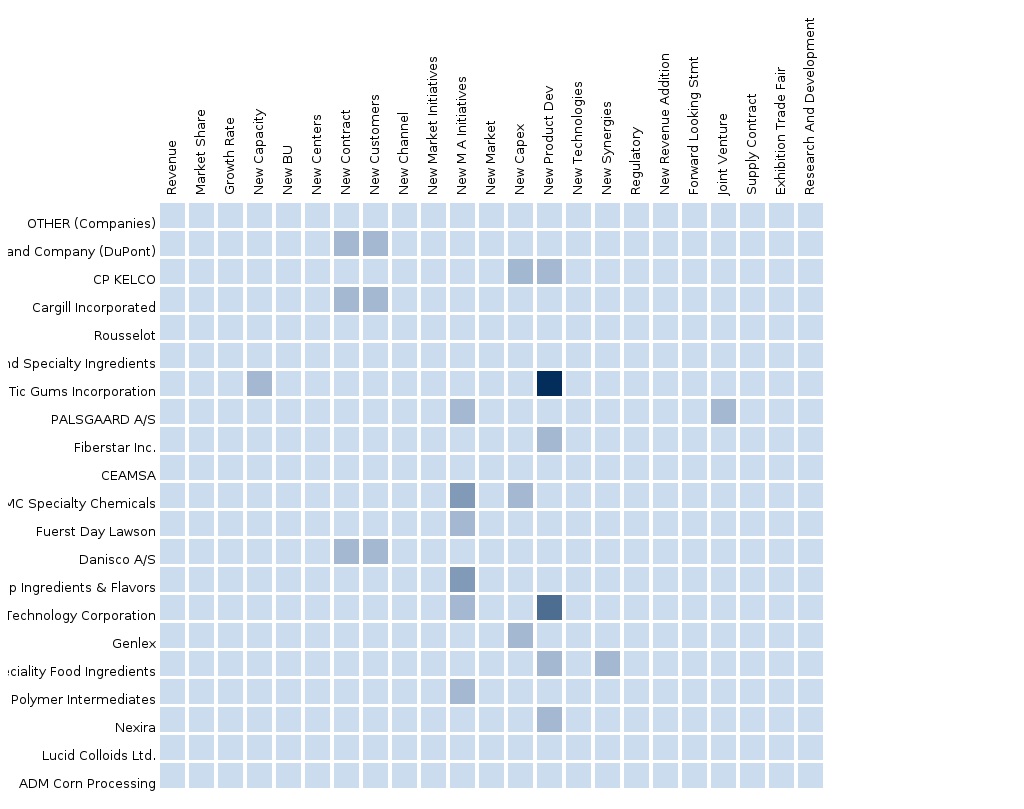
9 Food and Beverage Hydrocolloids Market: Competitive Landscape (Page No. - 112)
9.1 Food and Beverage Hydrocolloids Market: Company Share Analysis
9.2 Company Presence in Food and Beverage Hydrocolloids Market, By Type
9.3 New Product Launches and New Product Development
9.4 Expansions and Approvals
9.5 Investments
10 Food and Beverage Hydrocolloids Market, By Company (Page No. - 116)
(Overview, Financials, Products & Services, Strategy, and Developments)*
10.1 Ashland Inc. (U.S.)
10.2 Cargill Inc. (U.S.)
10.3 CP Kelco (U.S.)
10.4 E. I. Du Pont De Nemours and Company (U.S.)
10.5 Rousselot Sas. (France)
*Details on Overview, Financials, Product & Services, Strategy, and Developments Might Not Be Captured in Case of Unlisted Company
11 Appendix (Page No. - 131)
11.1 Customization Options
11.1.1 Technical Analysis
11.1.2 Low-Cost Sourcing Locations
11.1.3 Regulatory Framework
11.1.4 Impact Analysis
11.1.5 Trade Analysis
11.1.6 Historical Data and Trends
11.2 Related Reports
11.3 Introducing RT: Real Time Market Intelligence
11.3.1 RT Snapshots
List of Tables (94 Tables)
Table 1 Global Food and Beverage Hydrocolloids Peer Market Size, 2014 (USD MN)
Table 2 North America Food and Beverage Hydrocolloids Market: Macro Indicator, By Geography, 2014 (Thousand)
Table 3 North America Food and Beverage Hydrocolloids Market: Comparison With Food and Beverage Ingredients Market, 2013-2019 (USD MN)
Table 4 North America Food and Beverage Hydrocolloids Market: Comparison With Food and Beverage Ingredients Market, 2013-2019 (Tons)
Table 5 North America Food and Beverage Hydrocolloids Market: Drivers and Inhibitors
Table 6 North America Food and Beverage Hydrocolloids Market, By Application, 2013-2019 (USD MN)
Table 7 North America Food and Beverage Hydrocolloids Market, By Application, 2013-2019 (Tons)
Table 8 North America Food and Beverage Hydrocolloids Market, By Type,2013-2019 (USD MN)
Table 9 North America Food and Beverage Hydrocolloids Market, By Type,2013-2019 (Tons)
Table 10 North America Food and Beverage Hydrocolloids Market, Comparison With Application Market, 2013-2019 (USD MN)
Table 11 North America Food and Beverage Hydrocolloids Market, By Application, 2013-2019 (USD MN)
Table 12 North America Food and Beverage Hydrocolloids Market, By Application, 2013-2019 (Tons)
Table 13 North America Food and Beverage Hydrocolloids Market in Bakery,By Geography, 2013-2019 (USD MN)
Table 14 North America Food and Beverage Hydrocolloids in Bakery,By Geography, 2013-2019 (Tons)
Table 15 North America Food and Beverage Hydrocolloids Market in Confectionery, By Geography, 2013-2019 (USD MN)
Table 16 North America Food and Beverage Hydrocolloids in Confectionery,By Geography, 2013-2019 (Tons)
Table 17 North America Food and Beverage Hydrocolloids Market in Meat and Poultry Products, By Geography, 2013-2019 (USD MN)
Table 18 North America Food and Beverage Hydrocolloids Market in Meat & Poultry Products, By Geography, 2013-2019 (Tons)
Table 19 North America Food and Beverage Hydrocolloids Market in Sauces and Dressing, By Geography, 2013-2019 (USD MN)
Table 20 North America Food and Beverage Hydrocolloids Market in Sauces and Dressing, By Geography, 2013-2019 (Tons)
Table 21 North America Food and Beverage Hydrocolloids Market in Beverages,By Geography, 2013-2019 (USD MN)
Table 22 North America Food and Beverage Hydrocolloids Market in Beverages,By Geography, 2013-2019 (Tons)
Table 23 North America Food and Beverage Hydrocolloids Market in Dairy Products, By Geography, 2013-2019 (USD MN)
Table 24 North America Food and Beverage Hydrocolloids Market in Dairy Products, By Geography, 2013-2019 (Tons)
Table 25 North America Food and Beverage Hydrocolloids Market, By Function, 2013-2019 (USD MN)
Table 26 North America Food and Beverage Hydrocolloids Market, By Function, 2013-2019 (Tons)
Table 27 North America Food and Beverage Hydrocolloids Market in Thickener,By Geography, 2013-2019 (USD MN)
Table 28 North America Food and Beverage Hydrocolloids in Thickener,By Geography, 2013-2019 (Tons)
Table 29 North America Food and Beverage Hydrocolloids Market in Stabilizer,By Geography, 2013-2019 (USD MN)
Table 30 North America Food and Beverage Hydrocolloids Market in Stabilizer,By Geography, 2013-2019 (Tons)
Table 31 North America Food and Beverage Hydrocolloids Market in Gelling Agent, By Geography, 2013-2019 (USD MN)
Table 32 North America Food and Beverage Hydrocolloids Market in Gelling Agent, By Geography, 2013-2019 (Tons)
Table 33 North America Food and Beverage Hydrocolloids Market in Fat Replacer, By Geography, 2013-2019 (USD MN)
Table 34 North America Food and Beverage Hydrocolloids Market in Fat Replacer, By Geography, 2013-2019 (Tons)
Table 35 North America Food and Beverage Hydrocolloids Market in Coating Material, By Geography, 2013-2019 (USD MN)
Table 36 North America Food and Beverage Hydrocolloids Market in Coating Material, By Geography, 2013-2019 (Tons)
Table 37 North America Food and Beverage Hydrocolloids Market, By Type,2013-2019 (USD MN)
Table 38 North America Food and Beverage Hydrocolloids Market, By Type,2013-2019 (Tons)
Table 39 North America Food and Beverage Hydrocolloids Market: Type Comparison With Parent Market, 2013-2019 (USD MN)
Table 40 North America Hydrocolloids Gelatin Market, By Geography,2013-2019 (USD MN)
Table 41 North America Hydrocolloids Gelatin Market, By Geography,2013-2019 (Tons)
Table 42 North America Hydrocolloids Xanthan Gum Market, By Geography,2013-2019 (USD MN)
Table 43 North America Hydrocolloids Xanthan Gum Market, By Geography,2013-2019 (Tons)
Table 44 North America Hydrocolloids Carrageenan Market, By Geography,2013-2019 (USD MN)
Table 45 North America Hydrocolloids Carrageenan Market, By Geography,2013-2019 (Tons)
Table 46 North America Hydrocolloids Alginates Market, By Geography,2013-2019 (USD MN)
Table 47 North America Hydrocolloids Alginates Market, By Geography,2013-2019 (Tons)
Table 48 North America Hydrocolloids Agar Market, By Geography,2013-2019 (USD MN)
Table 49 North America Hydrocolloids Agar Market, By Geography,2013-2019 (Tons)
Table 50 North America Hydrocolloids Pectin Market, By Geography,2013-2019 (USD MN)
Table 51 North America Hydrocolloids Pectin Market, By Geography,2013-2019 (Tons)
Table 52 North America Hydrocolloids Guar Market, By Geography,2013-2019 (USD MN)
Table 53 North America Hydrocolloids Guar Market, By Geography,2013-2019 (Tons)
Table 54 North America Hydrocolloids Locust Bean Gum Market, By Geography, 2013-2019 (USD MN)
Table 55 North America Hydrocolloids Locust Bean Gum Market, By Geography, 2013-2019 (Tons)
Table 56 North America Hydrocolloids Gum Arabic Market, By Geography,2013-2019 (USD MN)
Table 57 North America Hydrocolloids Gum Arabic Market, By Geography,2013-2019 (Tons)
Table 58 North America Hydrocolloids Cmc Market, By Geography,2013-2019 (USD MN)
Table 59 North America Hydrocolloids Cmc Market, By Geography, 2013-2019 (Tons)
Table 60 North America Food and Beverage Hydrocolloids Market, By Geography, 2013-2019 (USD MN)
Table 61 North America Food and Beverage Hydrocolloids Market, By Geography, 2013-2019 (Tons)
Table 62 U.S. Food and Beverage Hydrocolloids Market, By Application,2013-2019 (USD MN)
Table 63 U.S. Food and Beverage Hydrocolloids Market, By Application,2013-2019 (Tons)
Table 64 U.S. Food and Beverage Hydrocolloids Market, By Function,2013-2019 (USD MN)
Table 65 U.S. Food and Beverage Hydrocolloids Market, By Function,2013-2019 (Tons)
Table 66 U.S. Food and Beverage Hydrocolloids Market, By Type, 2013-2019 (USD MN)
Table 67 U.S. Food and Beverage Hydrocolloids Market, By Type, 2013-2019 (Tons)
Table 68 Mexico Food and Beverage Hydrocolloids Market, By Application,2013-2019 (USD MN)
Table 69 Mexico Food and Beverage Hydrocolloids Market, By Application,2013-2019 (Tons)
Table 70 Mexico Food and Beverage Hydrocolloids Market, By Function,2013-2019 (USD MN)
Table 71 Mexico Food and Beverage Hydrocolloids Market, By Function,2013-2019 (Tons)
Table 72 Mexico Food and Beverage Hydrocolloids Market, By Type,2013-2019 (USD MN)
Table 73 Mexico Food and Beverage Hydrocolloids Market, By Type,2013-2019 (Tons)
Table 74 Canada Food and Beverage Hydrocolloids Market, By Application,2013-2019 (USD MN)
Table 75 Canada Food and Beverage Hydrocolloids Market, By Application,2013-2019 (Tons)
Table 76 Canada Food and Beverage Hydrocolloids Market, By Function,2013-2019 (USD MN)
Table 77 Canada Food and Beverage Hydrocolloids Market, By Function,2013-2019 (Tons)
Table 78 Canada Food and Beverage Hydrocolloids Market, By Type,2013-2019 (USD MN)
Table 79 Canada Food and Beverage Hydrocolloids Market, By Type,2013-2019 (Tons)
Table 80 Food and Beverage Hydrocolloids Market: Company Share Analysis,2014 (%)
Table 81 North America Food and Beverage Hydrocolloids Market: New Product Launches and New Product Development
Table 82 North America Food and Beverage Hydrocolloids Market: Expansions and Approvals
Table 83 North America Food and Beverage Hydrocolloids Market: Investments
Table 84 Ashland Inc. (U.S.): Key Operations Data, 2009-2013 (USD MN)
Table 85 Ashland Inc. (U.S.): Key Financials, 2010-2014 (USD MN)
Table 86 Ashland Inc. (U.S.): Key Financials,By Geographical Segment,2010-2014 (USD MN)
Table 87 Cargill Incorporated (U.S.): Key Operations Data, 2010-2014 (USD MN)
Table 88 Cargill Incorporated (U.S.): Key Financials, 2010-2014 (USD MN)
Table 89 Key Financials: By Business Segment, 2009-2013 (USD MN)
Table 90 Key Financials: By Geographical Segment, 2009-2013 (USD MN)
Table 91 Key Operations Data, 2009-2013 (USD MN)
Table 92 Rousselot SAS (France): Key Financials, By Business Segment,2012–2013 (USD MN)
Table 93 Rousselot SAS (France): Key Financials, By Geographical Segment,2012–2013 (USD MN)
Table 94 Rousselot SAS (France): Key Operations Data, 2012-2013 (USD MN)
List of Figures (66 Figures)
Figure 1 North America Food and Beverage Hydrocolloids Market: Segmentation & Coverage
Figure 2 Food and Beverage Hydrocolloids Market: Integrated Ecosystem
Figure 3 Research Methodology
Figure 4 Top-Down Approach
Figure 5 Bottom-Up Approach
Figure 6 Macro Indicator-Based Approach
Figure 7 North America Food and Beverage Hydrocolloids Market Snapshot
Figure 8 North America Food & Beverage Hydrocolloids Market Snapshot
Figure 9 Food and Beverage Hydrocolloids Market: Growth Aspects
Figure 10 North America Food and Beverage Hydrocolloids Market, By Application, 2014 vs 2019
Figure 11 North America Food and Beverage Hydrocolloids Types, By Geography, 2014 (USD MN)
Figure 12 North America Food and Beverage Hydrocolloids Types, By Growth Analysis, 2014
Figure 13 North America Food and Beverage Hydrocolloids Market: Growth Analysis, By Application, 2013-2019 (%)
Figure 14 North America Food and Beverage Hydrocolloids Market, By Application, 2014-2019 (USD MN)
Figure 15 North America Food and Beverage Hydrocolloids Market, By Application, 2014-2019 (Tons)
Figure 16 North America Food and Beverage Hydrocolloids Market in Bakery,By Geography, 2013-2019 (USD MN)
Figure 17 North America Food and Beverage Hydrocolloids Market in Confectionery, By Geography, 2013-2019 (USD MN)
Figure 18 North America Food and Beverage Hydrocolloids Market in Meat and Poultry Products, By Geography, 2013-2019 (USD MN)
Figure 19 North America Food and Beverage Hydrocolloids Market in Sauces and Dressing, By Geography, 2013-2019 (USD MN)
Figure 20 North America Food and Beverage Hydrocolloids Market in Beverages,By Geography, 2013-2019 (USD MN)
Figure 21 North America Food and Beverage Hydrocolloids Market in Dairy Products, By Geography, 2013-2019 (USD MN)
Figure 22 North America Food and Beverage Hydrocolloids Market, By Function, 2014-2019 (USD MN)
Figure 23 North America Food and Beverage Hydrocolloids Market, By Function, 2014-2019 (Tons)
Figure 24 North America Food and Beverage Hydrocolloids Market in Thickener,By Geography, 2013-2019 (USD MN)
Figure 25 North America Food and Beverage Hydrocolloids Market in Stabilizer,By Geography, 2013-2019 (USD MN)
Figure 26 North America Food and Beverage Hydrocolloids Market in Gelling Agent, By Geography, 2013-2019 (USD MN)
Figure 27 North America Food and Beverage Hydrocolloids Market in Fat Replacer, By Geography, 2013-2019 (USD MN)
Figure 28 North America Food and Beverage Hydrocolloids Market in Coating Material, By Geography, 2013-2019 (USD MN)
Figure 29 North America Food and Beverage Hydrocolloids Market, By Type,2014-2019 (USD MN)
Figure 30 North America Food and Beverage Hydrocolloids Market, By Type,2014 & 2019 (Tons)
Figure 31 North America Food and Beverage Hydrocolloids Market: Type Comparison With Food and Beverage Ingredients Market,2013-2019 (USD MN)
Figure 32 North America Hydrocolloids Gelatin Market, By Geography,2013-2019 (USD MN)
Figure 33 North America Hydrocolloids Xanthan Gum Market, By Geography,2013-2019 (USD MN)
Figure 34 North America Hydrocolloids Carrageenan Market, By Geography,2013-2019 (USD MN)
Figure 35 North America Hydrocolloids Alginates Market, By Geography,2013-2019 (USD MN)
Figure 36 North America Hydrocolloids Agar Market, By Geography,2013-2019 (USD MN)
Figure 37 North America Hydrocolloids Pectin Market, By Geography,2013-2019 (USD MN)
Figure 38 North America Hydrocolloids Guar Market, By Geography, 2013-2019 (USD MN)
Figure 39 North America Hydrocolloids Locust Bean Gum Market, By Geography, 2013-2019 (USD MN)
Figure 40 North America Hydrocolloids Gum Arabic Market, By Geography,2013-2019 (USD MN)
Figure 41 North America Hydrocolloids Cmc Market, By Geography,2013-2019 (USD MN)
Figure 42 North America Food and Beverage Hydrocolloids Market: Growth Analysis, By Geography, 2014-2019 (USD MN)
Figure 43 North America Food and Beverage Hydrocolloids Market: Growth Analysis, By Geography, 2014-2019 (Tons)
Figure 44 U.S. Food and Beverage Hydrocolloids Market Overview, 2014 & 2019 (%)
Figure 45 U.S. Food and Beverage Hydrocolloids Market, By Application,2013-2019 (USD MN)
Figure 46 U.S. Food and Beverage Hydrocolloids Market: Application Snapshot
Figure 47 U.S. Food and Beverage Hydrocolloids Market, By Function,2013-2019 (USD MN)
Figure 48 U.S. Food and Beverage Hydrocolloids Market: Function Snapshot
Figure 49 U.S. Food and Beverage Hydrocolloids Market, By Type, 2013-2019 (USD MN)
Figure 50 U.S. Food and Beverage Hydrocolloids Market Share, By Type, 2013-2019 (%)
Figure 51 Mexico Food and Beverage Hydrocolloids Market Overview,2014 & 2019 (%)
Figure 52 Mexico Food and Beverage Hydrocolloids Market, By Application,2013-2019 (USD MN)
Figure 53 Mexico Food and Beverage Hydrocolloids Market: Application Snapshot
Figure 54 Mexico Food and Beverage Hydrocolloids Market, By Function,2013-2019 (USD MN)
Figure 55 Mexico Food and Beverage Hydrocolloids Market: Function Snapshot
Figure 56 Mexico Food and Beverage Hydrocolloids Market, By Type,2013-2019 (USD MN)
Figure 57 Mexico Food and Beverage Hydrocolloids Market Share, By Type,2013-2019 (%)
Figure 58 Canada Food and Beverage Hydrocolloids Market Overview,2014 & 2019 (%)
Figure 59 Canada Food and Beverage Hydrocolloids Market, By Application, 2013-2019 (USD MN)
Figure 60 Canada Food and Beverage Hydrocolloids Market: Application Snapshot
Figure 61 Canada Food and Beverage Hydrocolloids Market, By Function,2013-2019 (USD MN)
Figure 62 Canada Food and Beverage Hydrocolloids Market: Function Snapshot
Figure 63 Canada Food and Beverage Hydrocolloids Market, By Type,2013-2019 (USD MN)
Figure 64 Canada Food and Beverage Hydrocolloids Market Share, By Type,2013-2019 (%)
Figure 65 Food and Beverage Hydrocolloids Market: Company Share Analysis,2014 (%)
Figure 66 Food and Beverage Hydrocolloids Market: Company Product Coverage, By Type, 2014
Hydrocolloids are used in different industries, such as oil, food, pharmaceuticals, and so on. The water binding property of hydrocolloids has been explored in different industries. In food, hydrocolloids are used as gelling agents, texturants, fat replacers, and thickeners, to name a few. The global hydrocolloids market has witnessed significantly growth in recent years. The wide range of functions of hydrocolloids in food industry is an important driving force for its market.
Most of the hydrocolloids are extracted from natural resources. The increasing demand for natural foods over synthetic foods from the health conscious consumers is increasing the demand for natural hydrocolloids. The key factors that may restrain the growth of food and beverage hydrocolloids industry in NA are the fluctuation in prices of raw materials and seasonal changes that result in decline of raw material production.
This report includes revenue forecasts, market trends, and opportunities for the period from 2014 to 2019. The analysis has been conducted on the various market segments derived on the basis of application and types of food and beverage hydrocolloids.
The North America Hydrocolloids market was valued at $2,101.3 million in 2014, which is projected to reach $2,714.1 million by 2019, at a CAGR of 5.3% during the forecast period. The market, by application was led by dairy Products segment in 2014 with 27.4% share. Gelatin is the leading segment among hydrocolloids types though pectin segment is expected to grow with the highest CAGR during the forecast period.
Please visit https://www.micromarketmonitor.com/custom-research-services.html to specify your custom Research Requirement


