

Middle East Wireline Services Market by Service Type (Logging, Well Intervention, Completion), by Application (Onshore & Offshore) and by Country - Analysis and Forecasts to 2019
- Publish Date: Apr 2015


The purpose of this report is to cover the definition, description, and forecast of the Middle Eastern wireline services market. The report involves a deep dive analysis of the market segmentation, which is based on the types of services in the Middle Eastern wireline services market, applications, that is, onshore and offshore, and countries. The report also gives profound insights into the competitive landscape of the market through a strategic analysis of the key participants in the market. The Middle Eastern wireline services market in terms of the type of has been segmented into logging, well intervention, and completion services.
The Middle Eastern wireline services market constitutes 6.5% of the global wireline services market and is expected to grow at a CAGR of 4.1% from 2014 to 2019. Well intervention is the fastest-growing market within the Middle Eastern wireline services market. The wireline services market in Saudi Arabia was valued at $470.7 million in 2014. Between 2014 and 2019, the Saudi Arabia wireline services market is expected to grow at a CAGR of 3.6% to reach $561.0 million in 2019.
The growth in exploration and production activities is considered a key driver influencing the growth of Middle Eastern wireline services market. On the basis of various factors such as geological conditions and type of reservoir, different types of wireline services are required to assist drilling and completion activities. The rise in the demand for energy has resulted in an increased number of drilling and completion activities around the world. This has also put pressure on operators to extract more from each well, and as a result, further deep explorations are consequently performed. This increase in drilling and completion activity increases the requirement of wireline services.
The report also provides a detailed competitive landscape of companies operating in this market. Segment and country-specific company shares, news & deals, M&A, contracts and agreements, new product launches developed by the companies and geographical and business expansions have also been profiled in the report. The players mainly operating in the Middle East market are Schlumberger Ltd. (U.S.), Halliburton Co. (U.S.), Baker Hughes Inc. (U.S.), Weatherford International Ltd (Ireland), (U.S.), Superior Energy Services (U.S.), and Expro International Group (U.K.).
Table of Contents
1 Introduction (Page No. - 11)
1.1 Objectives of the Study
1.2 Market Segmentation & Coverage
1.3 Stakeholders
2 Research Methodology (Page No. - 13)
2.1 Integrated Ecosystem of Wireline Services Market
2.2 Arriving at the Wireline Services Market Size
2.2.1 Top-Down Approach
2.2.2 Bottom-Up Approach
2.2.3 Demand Side Approach
2.2.4 Macroindicator-Based Approach
2.3 Assumptions
3 Executive Summary (Page No. - 22)
4 Market Overview (Page No. - 24)
4.1 Introduction
4.2 Wireline Services Market: Comparison With Parent Market
4.3 Market Drivers and Inhibitors
4.4 Key Market Dynamics
4.5 Demand Side Analysis
5 Wireline Services Market, By Application (Page No. - 32)
5.1 Introduction
5.2 Wireline Services Market in Onshore, By Country
5.3 Middle East Wireline Services Market in Offshore, By Country
6 Wireline Services Market, By Service Type (Page No. - 38)
6.1 Introduction
6.2 Middle East Wireline Services Market, Services Comparison With Parent Market
6.3 Middle East Logging Services Market, By Country
6.4 Middle East Well Intervention Services Market, By Country
6.5 Middle East Completion Services Market, By Country
7 Wireline Services Market, By Country (Page No. - 46)
7.1 Introduction
7.2 Saudi Arabia Wireline Services Market
7.2.1 Saudi Arabia Wireline Services Market, By Application
7.2.2 Saudi Arabia Wireline Services Market, By Service Type
7.3 Abu Dhabi Wireline Services Market
7.3.1 Abu Dhabi Wireline Services Market, By Application
7.3.2 Abu Dhabi Wireline Services Market, By Service Type
7.4 Qatar Wireline Services Market
7.4.1 Qatar Wireline Services Market, By Application
7.4.2 Qatar Wireline Services Market, By Service Type
7.5 Oman Wireline Services Market
7.5.1 Oman Wireline Services Market, By Application
7.5.2 Oman Wireline Services Market, By Service Type
7.6 Iraq Wireline Services Market
7.6.1 Iraq Wireline Services Market, By Application
7.6.2 Iraq Wireline Services Market, By Service Type
7.7 Kuwait Wireline Services Market
7.7.1 Kuwait Wireline Services Market, By Application
7.7.2 Kuwait Wireline Services Market, By Service Type
8 Wireline Services Market: Competitive Landscape (Page No. - 70)
8.1 Wireline Services Market: Company Share Analysis
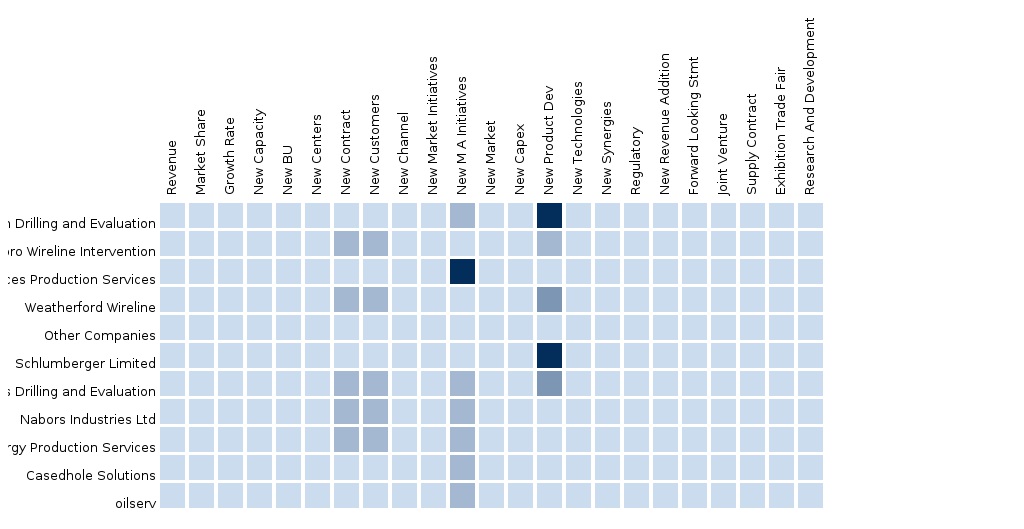
8.2 Company Presence in Wireline Services, By Services
8.3 Mergers & Acquisitions
8.4 New Contracts
8.5 New Product Launches
8.6 New Technologies
8.7 Other Expansions
9 Company Profiles (Page No. - 76)
(Overview, Financials, Products & Services, Strategy, and Developments)*
9.1 Baker Hughes Incorporated
9.2 Halliburton Company
9.3 Schlumberger Limited.
9.4 Weatherford International Ltd.
9.5 Superior Energy Services Inc.
9.6 Nabors Industries Limited
9.7 Expro International Group Holdings Ltd.
*Details On Overview, Financials, Product & Services, Strategy, and Developments Might Not be Captured in Case of Unlisted Company
10 Appendix (Page No. - 97)
10.1 Customization Options
10.1.1 Products and Services Benchmarking Analysis
10.1.2 Regulatory Framework
10.1.3 Impact Analysis
10.1.4 Current Industry Challenges
10.1.5 Historical Data and Trends
10.1.6 Well Intervention In-Depth Value Chain Analysis
10.2 Related Reports
10.3 Introducing RT: Real Time Market Intelligence
10.3.1 RT Snapshots
List of Tables (52 Tables)
Table 1 Global Oilfield Services Market Size, 2013 (USD MN)
Table 2 Middle East Wireline Services Market, 2013 (USD MN)
Table 3 Middle East Wireline Services Market: Macroindicators, By Country, 2013
Table 4 Middle East Wireline Services Market: Comparison With Parent Market, 2013 – 2019 (USD MN)
Table 5 Middle East Wireline Services Market: Drivers and Inhibitors
Table 6 Middle East Wireline Services Market, By Application, 2013 – 2019 (USD MN)
Table 7 Middle East Wireline Services Market, Bycountry, 2013 – 2019 (USD MN)
Table 8 Middle East Wirline Services Market, By Service Type, 2013 – 2019 (USD MN)
Table 9 Middle East Wireline Services Market: Comparison With Application Markets, 2013 – 2019 (USD MN)
Table 10 Middle East Wireline Services Market, By Application, 2013 – 2019 (USD MN)
Table 11 Middle East Wireline Services Market in Onshore, By Country, 2013 – 2019 (USD MN)
Table 12 Middle East Wireline Services Market in Offshore, By Country, 2013 – 2019 (USD MN)
Table 13 Middle East Wireline Services Market, By Service Type, 2013 – 2019 (USD MN)
Table 14 Middle East Wireline Services Market: Services Comparison With Parent Market, 2013 – 2019 (USD MN)
Table 15 Middle East Logging Services Market, By Country, 2013 – 2019 (USD MN)
Table 16 Middle East Well Intervention Services Market, By Country, 2013 – 2019 (USD MN)
Table 17 Saudi Arabia Completion Market, By Country, 2013 – 2019 (USD MN)
Table 18 North America Drilling Waste Management Market, By Country, 2013 – 2019 (USD MN)
Table 19 Saudi Arabia Wireline Services Market, By Application, 2013 – 2019 (USD MN)
Table 20 Saudi Arabia Wireline Services Market, By Service Type, 2013 – 2019 (USD MN)
Table 21 Abu Dhabi Wireline Services Market, By Application, 2013 – 2019 (USD MN)
Table 22 Abu Dhabi Wireline Services Market, By Service Type, 2013 – 2019 (USD MN)
Table 23 Qatar Wireline Services Market, By Application, 2013 – 2019 (USD MN)
Table 24 Qatar Wireline Services Market: By Service Type, 2013 – 2019 (USD MN)
Table 25 Oman Wireline Services Market, By Application, 2013 – 2019 (USD MN)
Table 26 Oman Wireline Services Market: By Service Type, 2013 – 2019 (USD MN)
Table 27 Iraq Wireline Services Market, By Application, 2013 – 2019 (USD MN)
Table 28 Iraq Wireline Services Market: By Service Type, 2013 – 2019 (USD MN)
Table 29 Kuwait Wireline Services Market, By Application, 2013 – 2019 (USD MN)
Table 30 Kuwait Wireline Services Market: By Service Type, 2013 – 2019 (USD MN)
Table 31 Wireline Services Market: Company Share Analysis, 2013 (%)
Table 32 Middle East Wireline Services Market: Mergers & Acquisitions
Table 33 Middle East Wireline Services Market: New Contracts
Table 34 Middle East Wireline Services Market: New Product Launches
Table 35 Table 35 Middle East Wireline Services Market: New Technology
Table 36 Middle East Wireline Services Market: Other Expansions
Table 37 Baker Hughes Incorporated: Key Operating Data, 2009 – 2013 (USD MN)
Table 38 Baker Hughes Incorporated.: Revenue By Business Segment, 2009 – 2013 (USD MN)
Table 39 Baker Hughes Incorporated.: Revenue By Geographical Segment, 2009 – 2013 (USD MN)
Table 40 Halliburton Company: Key Operations Data, 2009 – 2013 (USD MN)
Table 41 Halliburton Company.: Key Financials, By Business Segment, 2009 – 2013 (USD MN)
Table 42 Halliburton Company.: Key Financials, By Geographical Segment, 2009 – 2013 (USD MN)
Table 43 Schlumberger Limited: Key Operations Data, 2009 – 2013 (USD MN)
Table 44 Schlumberger Limited: Key Financials, By Business Segment, 2009 – 2013 (USD MN)
Table 45 Weatherford International Ltd.: Key Financials, 2009 – 2013 (USD MN)
Table 46 Weatherford International Ltd.: Key Financials, By Business Segment 2009 – 2013 (USD MN)
Table 47 Weatherford International Ltd.: Key Financials, By Geographical Segment 2009 – 2013 (USD MN)
Table 48 Superior Energy Services : Key Financials, 2009 – 2013 (USD MN)
Table 49 Superior Energy Services : Geographical Revenue, 2009 – 2013 (USD MN)
Table 50 Nabors Industries Ltd.: Key Financials 2009 – 2013 (USD MN)
Table 51 Nabors Industries Ltd.: Geographical Revenue, 2009 – 2013 (USD MN)
Table 52 Key Financials, 2009 – 2013 (USD MN)
List of Figures (62 Figures)
Figure 1 Middle East Wireline Services Market: Segmentation & Coverage
Figure 2 Wireline Services Market: Integrated Ecosystem
Figure 3 Research Methodology
Figure 4 Top-Down Approach
Figure 5 Bottom-Up Approach
Figure 6 Demand Side Approach
Figure 7 Macroindicator-Based Approach
Figure 8 Middle East Wireline Services Market Snapshot
Figure 9 Wireline Services Market: Growth Aspects
Figure 10 Middle East Wireline Services Market: Comparison With Parent Market
Figure 11 Middle East Wireline Services Market, By Application, 2014 Vs 2019
Figure 12 Middle East Wireline Services Market Services, By Country, 2013 (USD MN)
Figure 13 Demand Side Analysis
Figure 14 Wireline Services: Application Market Scenario
Figure 15 Middle East Wireline Services Market, By Application, 2014 – 2019 (USD MN)
Figure 16 Middle East Wireline Services Market in Onshore, By Country, 2013 – 2019 (USD MN)
Figure 17 Middle East Wireline Services Market in Offshore, By Country, 2013 – 2019 (USD MN)
Figure 18 Middle East Wireline Services Market, By Service Type, 2014 – 2019 (USD MN)
Figure 19 Middle East Wireline Services Market: Services Comparison With Parent Market, 2013–2019 (USD MN)
Figure 20 Middle East Logging Services Market, By Country, 2013 – 2019 (USD MN)
Figure 21 Middle East Well Intervention Services Market, By Country, 2013 – 2019 (USD MN)
Figure 22 Middle East Completion Services Market, By Country, 2013 – 2019 (USD MN)
Figure 23 Middle East Wireline Services Market: Growth Analysis, By Country, 2014 – 2019 (USD MN)
Figure 24 Saudi Arabia Wireline Services Market Overview, 2014 & 2019 (%)
Figure 25 Saudi Arabia Wireline Services Market, By Application, 2013 – 2019 (USD MN)
Figure 26 Saudi Arabia Wireline Services Market: Application Snapshot, 2014 – 2019 (USD MN)
Figure 27 Saudi Arabia Wireline Services Market, By Service Type, 2013 – 2019 (USD MN)
Figure 28 Saudi Arabia Wireline Services Market Share, By Service Type, 2014 – 2019 (%)
Figure 29 Abu Dhabi Wireline Services Market Overview, 2014 & 2019 (%)
Figure 30 Abu Dhabi Wireline Services Market, By Application, 2013 – 2019 (USD MN)
Figure 31 Abu Dhabi Wireline Services Market: Application Snapshot, 2014 – 2019 (USD MN)
Figure 32 Abu Dhabi Wireline Services Market, By Service Type, 2013 – 2019 (USD MN)
Figure 33 Abu Dhabi Wireline Services Market Share, By Service Type, 2014 – 2019 (%)
Figure 34 Qatar Wireline Services Market Overview, 2014 & 2019 (%)
Figure 35 Qatar Wireline Services Market, By Application, 2013 – 2019 (USD MN)
Figure 36 Qatar Wireline Services Market: Application Snapshot, 2014 – 2019 (USD MN)
Figure 37 Qatar Wireline Services Market, By Service Type, 2013 – 2019 (USD MN)
Figure 38 Qatar Wireline Services Market: Service Type Snapshot, 2014 – 2019 (%)
Figure 39 Oman Wireline Services Market Overview, 2014 & 2019 (%)
Figure 40 Oman Wireline Services Market, By Application, 2013 – 2019 (USD MN)
Figure 41 Oman Wireline Services Market: Application Snapshot, 2014 – 2019 (USD MN)
Figure 42 Oman Wireline Services Market, By Service Type, 2013 – 2019 (USD MN)
Figure 43 Oman Wireline Services Market: Service Type Snapshot, 2014 – 2019 (USD MN)
Figure 44 Iraq Wireline Services Market Overview, 2014 & 2019 (%)
Figure 45 Iraq Wireline Services Market, By Application, 2013 – 2019 (USD MN)
Figure 46 Iraq Wireline Services Market: Application Snapshot, 2014 – 2019 (USD MN)
Figure 47 Iraq Wireline Services Market, By Service Type, 2013 – 2019 (USD MN)
Figure 48 Iraq Wireline Services Market: Service Type Snapshot, 2014 – 2019 (USD MN)
Figure 49 Kuwait Wireline Services Market Overview, 2014 & 2019 (%)
Figure 50 Kuwait Wireline Services Market, By Application, 2013 – 2019 (USD MN)
Figure 51 Kuwait Wireline Services Market: Application Snapshot, 2014 – 2019 (USD MN)
Figure 52 Kuwait Wireline Services Market, By Service Type, 2013 – 2019 (USD MN)
Figure 53 Kuwait Wireline Services Market: Service Type Snapshot, 2014 – 2019 (USD MN)
Figure 54 Wireline Services Market: Company Share Analysis, 2013 (%)
Figure 55 Wireline Services: Company Product Coverage, By Services, 2013
Figure 56 Baker Hughes Incorporat6ed: Revenue Mix, 2013 (%)
Figure 57 Halliburton Company Revenue Mix, 2013 (%)
Figure 58 Schlumberger Limited Revenue Mix, 2013 (%)
Figure 59 Weatherford International Ltd. Revenue Mix, 2013 (%)
Figure 60 Superior Energy Services, Revenue Mix, 2013 (%)
Figure 61 Nabors Industries Ltd., Revenue Mix, 2013 (%)
Figure 62 Expro International Group Holdings Ltd.: Revenue Mix, 2013 (%)
Wireline services are used for a wide range of purposes in the lifecycle of a well that includes exploration, drilling, completion, stimulation, intervention among others. Wireline services are used to run the tools and equipment into the downhole before and after the completion is done. Wireline services are provided by oilfield service companies to the oil & natural gas E&P companies.
In 2014, the Middle Eastern region held 6.5% of the global wireline services market. Most of the countries in this region produce huge amounts of oil and gas. Based on the developments expected in the Middle East, drilling activities have increased by 2% from 2011 to 2012. The number of major investments made in completion and production activities in Oman and Saudi Arabia are likely to increase and drive the growth of the wireline services market.
The Middle East has the highest reserves of hydrocarbons in the world; therefore it is the primary exporter to all the regions in the global oil & gas market. This region has nearly 56.0% of the world’s proved reserves. It is characterized with a high amount of conventional reserves that are yet to reach its peak production.
Saudi Arabia is the largest producer of crude oil in the world and holds 23% of the globe’s proved crude oil reserves. The state owned company, Saudi Aramco, controls the overall oil & gas sector in the country, with Saudi Arabia’s Ministry of Petroleum and Mineral Resources. The government maintains a positive approach in enhancing its reserves, as around 80% of the country’s revenue comes from exporting oil & gas.
This report estimates the Middle Eastern wireline services market in terms of service types, applications and Middle Eastern countries. The Middle Eastern wireline services market was valued at $1,240.4 million in 2014 and is expected to reach $1,516.2 million in 2019. Logging held a major share of 83.3% of the total Middle Eastern wireline services market in 2014 by service type. Logging is followed by well intervention and completion with respective shares of 15.7% and 1.0%.
An in-depth market share analysis, by revenue, of the top companies is included in the report. These numbers are arrived at, on the basis of key facts, annual financial information from annual reports and interviews with industry experts and key opinion leaders, such as CEOs, directors, and marketing executives. Top market players that have established their base in the Middle Eastern wireline services market are Schlumberger (U.S.), Halliburton (U.S.), Baker Hughes (U.S.), Weatherford International Ltd (Ireland), (U.S.), Superior Energy Services (U.S.), and Expro International Group (U.K.).
Please visit https://www.micromarketmonitor.com/custom-research-services.html to specify your custom Research Requirement
| PRODUCT TITLE | PUBLISHED | |
|---|---|---|
|
|
South America Oilfield Services The oilfield services market in South America was valued around $14.04 billion in 2013, with a market share of 9.3% globally. Projected to grow at a CAGR of 17% from 2014 to 2019, the market is led by Weatherford, Halliburton, Schlumberger, and Baker Hughes. It is segmented on the basis of types of oilfield services and countries present in the region. |
Apr 2015 |
|
|
Asia-Pacific Oilfield Services The oilfield services market in Asia Pacific was valued around $31598 million in 2013, with a market share of almost 20% globally. Projected to grow at a CAGR of 14% from 2014 to 2019, the market is led by Weatherford, Halliburton, Schlumberger, and Baker Hughes. It is segmented on the basis of types of oilfield services and countries in the region. |
Apr 2015 |
|
|
Middle East Oilfield Services Middle East oilfield services market was valued at $73,405.6 million in 2014 and is projected to grow at a CAGR of 4.2% from 2014 to 2019 to reach a market size of $90,150.1 by 2019. The large share is attributed to the rise in exploration of new reserves which requires increased drilling activities. |
May 2015 |
|
|
Africa Oilfield Services The oilfield services market in Africa was valued around $7642 million in 2013, with a market share of 5% globally. Projected to grow at a CAGR of 14.4% from 2014 to 2019, the market is led by Weatherford, Halliburton, Schlumberger, and Baker Hughes. It is segmented on the basis of types of oilfield services and countries present in the region. |
Apr 2015 |
|
|
Europe Oilfield Services The European oilfield services market was valued at $45,592.5 million in 2014, and is projected to reach $60,017.5 million by 2019, at a CAGR of 5.7% from 2014 to 2019. The growth of this market can be attributed to the rise in exploration activities of new reserves, which requires increased drilling activities. The drilling services segment accounted for the largest share of 59.2% of the European oilfield services market in 2014. |
Apr 2015 |
|
|
North America Oilfield Services The oilfield services market in North America was valued around $76.85 billion in 2013, with a market share of 50.8% globally. Projected to grow at a CAGR of 9.8% from 2014 to 2019, the market is led by Weatherford, Halliburton, Schlumberger, and Baker Hughes. It is segmented on the basis of types of oilfield services and countries present in the region. |
Upcoming |


