

Africa Oilfield Equipment Rental Market by Type (Drilling Equipment, Pressure & Flow Control Equipment, Fishing Equipment & Others), by Application (Onshore & Offshore), by Country - Analysis & Forecast To 2019
- Publish Date: Apr 2015


Oilfield equipment is required by the drilling operators to produce oil & gas from reservoirs. Key driving factor of the oilfield equipment market is the increase in the offshore drilling activities due to the rise for energy demand in Africa. Also, factors such as the growing unconventional hydrocarbon market and new exploration activities at the deep and ultra-deep offshore drilling areas of Africa are driving the growth of the Africa oilfield equipment rental market. Countries such as Nigeria, Angola, Egypt, and Algeria are the most promising countries for the drilling activities of oil & gas.
Most of the oilfield equipment is expensive hence it is easier for operating companies to rent them out as an alternative of purchasing such tools. Renting offers significant savings and helps in minimizing cost of inventory. It further reduces costs by eliminating the need for large equipment storage area and infrastructure, and enables operators to pick the right type and size of equipment for a particular operation. It also reduced downtime, thus the saved capital can be utilized for more profitable ventures.
It involves a deep-dive analysis of the market segmentation, which is based on equipment, type, and country. The oilfield equipment rental market, in terms of equipment, has been segmented into drilling equipment, pressure & flow control equipment, fishing equipment and other equipment.
The African oilfield equipment rental (OER) market is estimated to reach $3,619 million by 2019, at a CAGR of 4.0% from 2014 to 2019. The market is expected to grow due to the increase in the exploration and development activities in countries such as Nigeria and Algeria. The African market is untapped and has high reserves of crude oil; major players are investing substantially in these countries for revenue. Thus, the market for OER is expected to grow in this region.
Angola is one of the dominant countries in terms of revenue for the OER market in the African region, owing to huge capital expenditure taking place in the oil & gas sector. Angola accounted for the largest market share of 40.8% in 2013.
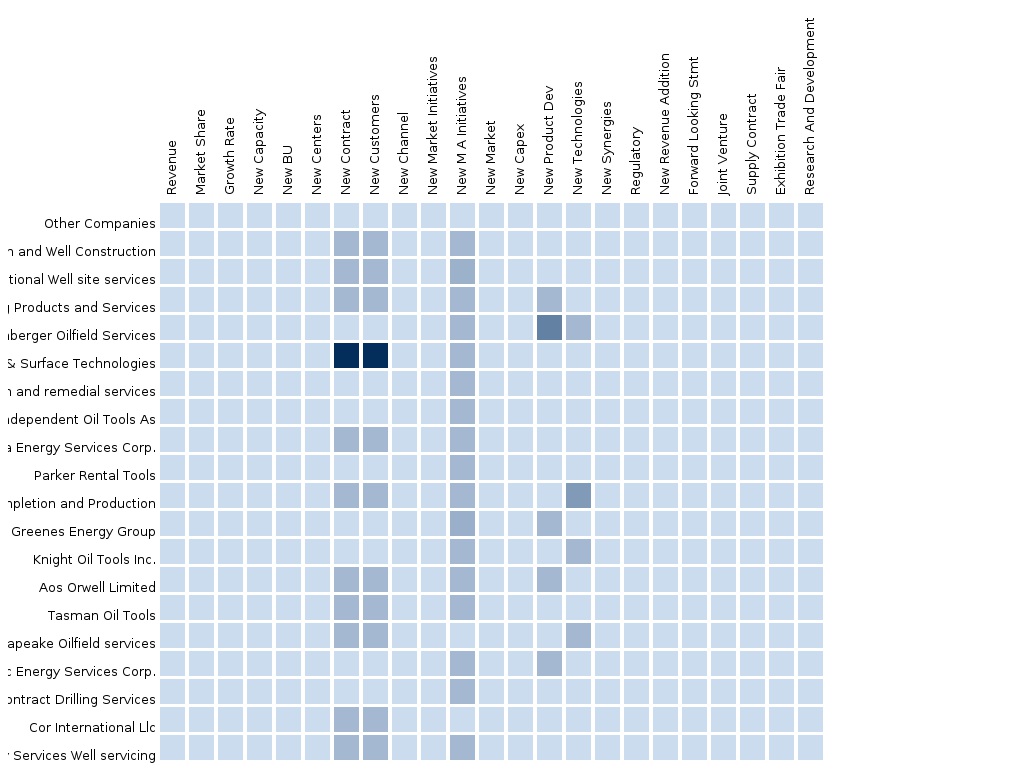
The major players in the market are identified through secondary and primary research, based on which their market shares are evaluated. This includes a study of the annual reports of top market players and interviews with key opinion leaders such as the CEOs, Directors, and marketing people. To provide an in-depth understanding of the competitive landscape, the report includes profiles of some of the major drilling waste market participants, which combines manufacturers as well as service providers such as Schlumberger Ltd. (U.S.), Superior Energy Services (U.S.), and Weatherford International Ltd. (Ireland).
Table of Contents
1 Introduction (Page No. - 10)
1.1 Objectives of the Study
1.2 Market Segmentation & Coverage
1.3 Stakeholders
2 Research Methodology (Page No. - 12)
2.1 Integrated Ecosystem of Africa Oilfield Equipment Rental Market
2.2 Arriving at the Africa Oilfield Equipment Rental Market
2.2.1 Top-Down Approach
2.2.2 Bottom-Up Approach
2.2.3 Demand Side Approach
2.2.4 Macro Indicator-Based Approach
2.3 Assumptions
3 Executive Summary (Page No. - 20)
4 Market Overview (Page No. - 22)
4.1 Introduction
4.2 Africa Oilfield Equipment Rental Market: Comparison With Parent Market (USD MN)
4.3 Market Drivers and Inhibitors
4.4 Key Market Dynamics
4.5 Demand Side Analysis
5 Africa Oilfield Equipment Rental Market, By Application (Page No. - 29)
5.1 Introduction
5.2 Africa Oilfield Equipment Rental Market, By Application
5.3 Africa Oilfield Equipment Rental Market, Onshore Area, By Country
5.4 Africa Oilfield Equipment Rental Market, Offshore Area, By Country
6 Africa Oilfield Equipment Rental Market, By Type (Page No. - 34)
6.1 Introduction
6.2 Africa Oilfield Equipment Rental Market, Type Comparison With Parent Market
6.3 Africa Drilling Equipment Rental Market, By Geography
6.4 Africa Pressure & Flow Control Equipment Rental Market, By Geography
6.5 Africa Fishing Equipment Rental Market, By Geography
7 African Oilfield Equipment Rental Market, By Geography (Page No. - 42)
7.1 Introduction
7.2 Angola Oilfield Equipment Rental Market
7.2.1 Angola Oilfield Equipment Rental Market, By Application
7.2.2 Angola Oilfield Equipment Rental Market, By Type
7.3 Nigeria Oilfield Equipment Rental Market
7.3.1 Nigeria Oilfield Equipment Rental Market, By Application
7.3.2 Nigeria Oilfield Equipment Rental Market, By Type
7.4 Algeria Oilfield Equipment Rental Market
7.4.1 Algeria Oilfield Equipment Rental Market, By Application
7.4.2 Algeria Oilfield Equipment Rental Market, By Type
7.5 Egypt Oilfield Equipment Rental Market
7.5.1 Egypt Oilfield Equipment Rental Market, By Application
7.5.2 Egypt Oilfield Equipment Rental Market, By Type
8 Africa Oilfield Equipment Rental Market: Competitive Landscape (Page No. - 61)
8.1 Company Presence in Oilfield Equipment Rental Market, By Type
8.2 Mergers & Acquisitions
8.3 New Product/Service Launch
9 Africa Oilfield Equipment Rental Market, By Company (Page No. - 66)
9.1 Weatherford International Ltd.
9.2 Superior Energy Services Inc.
9.3 Oil States International Inc.
9.4 Schlumberger Ltd
9.5 Halliburton
10 Appendix (Page No. - 88)
10.1 Customization Options
10.2 Related Reports
10.3 Introducing RT: Real-Time Market Intelligence
10.3.1 RT Snapshots
List of Tables (46 Tables)
Table 1 Global Oilfield Equipment Rental Peer Market Size, 2013 (USD MN)
Table 2 Africa Oilfield Equipment Rental Market, 2013 (USD MN)
Table 3 Africa Oilfield Equipment Rental Market: Macro Indicators, By Country, 2013 (Number of New Well Count)
Table 4 Africa Oilfield Equipment Rental Market: Comparison With Parent Market, 2013 – 2019 (USD MN)
Table 5 Africa Oilfield Equipment Rental Market: Drivers and Inhibitors
Table 6 Africa Oilfield Equipment Rental Market, By Application, 2014 Vs 2019
Table 7 Africa Oilfield Equipment Rental Market, By Type, 2013 – 2019 (Usd Mon)
Table 8 Africa Oilfield Equipment Rental Market: Comparison With Application Markets, 2013 - 2019 (USD MN)
Table 9 Africa Oilfield Equipment Rental Market, By Application,2013 - 2019 (USD MN)
Table 10 Africa Oilfield Equipment Rental Market in Onshore Area, By Country, 2013 - 2019 (USD MN)
Table 11 Africa Oilfield Equipment Rental Market in Offshore Area, By Country, 2013 - 2019 (USD MN)
Table 12 Africa Oilfield Equipment Rental Market, By Type, 2013-2019 (USD MN)
Table 13 Africa Oilfield Drilling Equipment Rental Market, By Type,2013-2019 (USD MN)
Table 14 Africa Oilfield Pressure & Flow Control Equipment Rental Market,By Type, 2013-2019 (USD MN)
Table 15 Africa Oilfield Equipment Rental Market, Type Comparison With Parent Market (USD MN)
Table 16 Africa Drilling Equipment Rental Market, By Geography,2013–2019 (USD MN)
Table 17 Africa Pressure & Flow Control Equipment Rental Market, By Geography, 2013 - 2019 (USD MN)
Table 18 Africa Fishing Equipment Rental Market, By Geography,2013 - 2019 (USD MN)
Table 19 Africa Oilfield Equipment Rental Market, By Geography,2013 - 2019 (USD MN)
Table 20 Angola Oilfield Equipment Rental Market, By Application,2013-2019 (USD MN)
Table 21 Angola Oilfield Equipment Rental Market, By Type, 2013 - 2019 (USD MN)
Table 22 Nigeria Oilfield Equipment Rental Market, By Application,2013 - 2019 (USD MN)
Table 23 Nigeria Oilfield Equipment Rental Market, By Type, 2013 - 2019 (USD MN)
Table 24 Algeria Oilfield Equipment Rental Market, By Application,2013 - 2019 (USD MN)
Table 25 Algeria Oilfield Equipment Rental Market, By Type, 2013 - 2019 (USD MN)
Table 26 Egypt Oilfield Equipment Rental Market, By Application,2013 - 2019 (USD MN)
Table 27 Egypt Oilfield Equipment Rental Market, By Type, 2013 - 2019 (USD MN)
Table 28 Oilfield Equipment Rental Market: Company Share Analysis, 2013 (%)
Table 29 Oilfield Equipment Rental Market: Mergers & Acquisitions
Table 30 Oilfield Equipment Rental Market: New Product/Service Launch
Table 31 Oilfield Equipment Rental Market: Other Developments
Table 32 Weatherford International Ltd.: Key Financials, 2009 - 2013 (USD MN)
Table 33 Weatherford International Ltd. : Business Revenue, 2009-2013 (USD MN)
Table 34 Weatherford International Ltd. : Geographic Revenue, 2009-2013 (USD MN)
Table 35 Superior Energy Services Inc. : Key Financials, 2009 - 2013 (USD MN)
Table 36 Superior Energy Services Inc. : Business Revenue, 2009-2013 (USD MN)
Table 37 Superior Energy Services Inc. : Geographic Revenue, 2009-2013 (USD MN)
Table 38 Oil State International Inc.: Key Financials 2009 - 2013 (USD MN)
Table 39 Oil State International Inc.: Business Revenue, 2009-2013 (USD MN)
Table 40 Oil State International Inc.: Geographic Revenue, 2009-2013 (USD MN)
Table 41 Schlumberger Ltd. : Key Financials, 2009 - 2013 (USD MN)
Table 42 Schlumberger Ltd. :Business Revenue, 2009-2013 (USD Million)
Table 43 Schlumberger Ltd. : Geographic Revenue, 2009-2013 (USD Million)
Table 44 Halliburton: Key Operations Data, 2009 - 2013 (USD MN)
Table 45 Halliburton: Business Revenue, 2009 - 2013 (USD MN)
Table 46 Halliburton: Geographic Revenue, 2009 - 2013 (USD MN)
List of Figures (50 Figures)
Figure 1 Africa Oilfield Equipment Rental Market: Segmentation & Coverage
Figure 2 Africa Oilfield Equipment Rental Market: Integrated Ecosystem
Figure 3 Research Methodology
Figure 4 Top-Down Approach
Figure 5 Bottom-Up Approach
Figure 6 Demand Side Approach
Figure 7 Macro Indicator-Based Approach
Figure 8 Africa Oilfield Equipment Rental Market Snapshot
Figure 9 Africa Oilfield Equipment Rental Market: Growth Aspects
Figure 10 Africa Oilfield Equipment Rental Market: Comparison With Parent Market (USD MN)
Figure 11 Africa Oilfield Equipment Rental Market, By Application, 2014 Vs 2019
Figure 12 Africa Oilfield Equipment Rental Market Type, By Country, 2013 (USD MN)
Figure 13 Africa Oilfield Equipment Rental Market, By Application,2014 - 2019 (USD MN)
Figure 14 Africa Oilfield Equipment Rental Market in Onshore Area, By Country, 2013-2019 (USD MN)
Figure 15 Africa Oilfield Equipment Rental Market in Offshore Area, By Country, 2013 - 2019 (USD MN)
Figure 16 Africa Oilfield Equipment Rental Market, By Type, 2014-2019 (USD MN)
Figure 17 Africa Oilfield Drilling Equipment Rental Market, By Type,2014-2019 (USD MN)
Figure 18 Africa Oilfield Pressure & Flow Control Equipment Rental Market,By Type, 2014-2019 (USD MN)
Figure 19 Africa Oilfield Equipment Rental Market, Type Comparison With Parent Market 2013–2019 (USD MN)
Figure 20 Africa Drilling Equipment Rental Market, By Geography,2013–2019 (USD MN)
Figure 21 Africa Pressure & Flow Control Equipment Rental Market, By Geography, 2013 - 2019 (USD MN)
Figure 22 Africa Fishing Equipment Rental Market, By Geography,2013 - 2019 (USD MN)
Figure 23 Africa Oilfield Equipment Rental Market: Growth Analysis, By Geography, 2014 & 2019 (USD MN)
Figure 24 Angola Oilfield Equipment Rental Market Overview, 2014 & 2019 (%)
Figure 25 Angola Oilfield Equipment Rental Market, By Application,2013-2019 (USD MN)
Figure 26 Angola Oilfield Equipment Rental Market, By Application,2013-2019 (USD MN)
Figure 27 Angola Oilfield Equipment Rental Market, By Type, 2013 - 2019 (USD MN)
Figure 28 Angola Oilfield Equipment Rental Market Share, By Type, 2014 & 2019 (%)
Figure 29 Nigeria Oilfield Equipment Rental Market Overview, 2014 & 2019 (%)
Figure 30 Nigeria Oilfield Equipment Rental Market, By Application,2013-2019 (USD MN)
Figure 31 Nigeria Oilfield Equipment Rental Market: Application Snapshot
Figure 32 Nigeria Oilfield Equipment Rental Market, By Type, 2013 - 2019 (USD MN)
Figure 33 Nigeria Oilfield Equipment Rental Market Share, By Type, 2014-2019 (%)
Figure 34 Algeria Oilfield Equipment Rental Market Overview, 2014 & 2019 (%)
Figure 35 Algeria Oilfield Equipment Rental Market, By Application,2013 - 2019 (USD MN)
Figure 36 Algeria Oilfield Equipment Rental Market: Application Snapshot
Figure 37 Algeria Oilfield Equipment Rental Market, By Type, 2013 - 2019 (USD MN)
Figure 38 Algeria Oilfield Equipment Rental Market: By Type, 2014-2019 (%)
Figure 39 Egypt Oilfield Equipment Rental Market Overview, 2014 & 2019 (%)
Figure 40 Egypt Oilfield Equipment Rental Market, By Application,2013 - 2019 (USD MN)
Figure 41 Egypt Oilfield Equipment Rental Market: Application Snapshot
Figure 42 Egypt Oilfield Equipment Rental Market, By Type, 2013 - 2019 (USD MN)
Figure 43 Egypt Oilfield Equipment Rental Market: By Type, 2014-2019 (%)
Figure 44 Oilfield Equipment Rental Market: Company Share Analysis, 2013 (%)
Figure 45 Oilfield Equipment Rental Market: Company Product Coverage,By Type, 2013
Figure 46 Weatherford International Ltd.: Revenue Mix, 2013 (%)
Figure 47 Superior Energy Services Inc., Revenue Mix, 2013 (%)
Figure 48 Oil States International Inc.: Revenue Mix, 2013 (%)
Figure 49 Schlumberger Ltd Revenue Mix, 2013 (%)
Figure 50 Halliburton Revenue Mix, 2013 (%)
The African oilfield rental equipment (OER) market is witnessing very high growth on an account of increased E&P activities and technological advancements in the oilfield equipment market around the globe due to rising energy demand, especially in African region. Angola holds major market share followed by Nigeria and Algeria. The market in Angola dominated the market due to its thriving drilling activities in the untapped African countries.
Technological developments have enabled the development of non-conventional oil & gas fields which were earlier considered unviable economically and now even the E&P companies are optimizing the proficiency of extraction from maturing oilfields. This has provided a renewed impetus to drilling industry which is the main driver of oilfield rental industry.
Most oilfield equipment is so expensive that it is easier for companies to rent such equipment instead of buying them. Renting provides significant savings over buying and helps in minimizing the inventory. Renting also significantly reduces the costs by eliminating the need for large equipment storage areas and buildings along with fitting the type and size of equipment to the job for economy and safety. It also minimizes downtime and then the capital can be utilized for more profitable ventures.
The African oilfield equipment rental market was valued at $2,968 million in 2014, and is projected to reach $3,619 million by 2019 at a CAGR of 4.0% from 2014 and 2019. The market in Angola accounted for a share of 41.1% in 2014. It is expected to reach $1,547 million by 2019, at a CAGR of 4.9% from 2014 to 2019.
An in-depth market share analysis, by revenue, of the top companies is included in the report. These numbers are arrived at, based on key facts, annual financial information from annual reports and interviews with industry experts and key opinion leaders, such as CEOs, directors, and marketing executives. The key companies in the rental business include Oil States International, Inc. (U.S.), Schlumberger Limited (U.S.), Superior Energy Services, Inc. (U.S.), and Weatherford International (Ireland).
Please visit https://www.micromarketmonitor.com/custom-research-services.html to specify your custom Research Requirement
| PRODUCT TITLE | PUBLISHED | |
|---|---|---|
|
|
South America Oilfield Services The oilfield services market in South America was valued around $14.04 billion in 2013, with a market share of 9.3% globally. Projected to grow at a CAGR of 17% from 2014 to 2019, the market is led by Weatherford, Halliburton, Schlumberger, and Baker Hughes. It is segmented on the basis of types of oilfield services and countries present in the region. |
Apr 2015 |
|
|
Asia-Pacific Oilfield Services The oilfield services market in Asia Pacific was valued around $31598 million in 2013, with a market share of almost 20% globally. Projected to grow at a CAGR of 14% from 2014 to 2019, the market is led by Weatherford, Halliburton, Schlumberger, and Baker Hughes. It is segmented on the basis of types of oilfield services and countries in the region. |
Apr 2015 |
|
|
Middle East Oilfield Services Middle East oilfield services market was valued at $73,405.6 million in 2014 and is projected to grow at a CAGR of 4.2% from 2014 to 2019 to reach a market size of $90,150.1 by 2019. The large share is attributed to the rise in exploration of new reserves which requires increased drilling activities. |
May 2015 |
|
|
Africa Oilfield Services The oilfield services market in Africa was valued around $7642 million in 2013, with a market share of 5% globally. Projected to grow at a CAGR of 14.4% from 2014 to 2019, the market is led by Weatherford, Halliburton, Schlumberger, and Baker Hughes. It is segmented on the basis of types of oilfield services and countries present in the region. |
Apr 2015 |
|
|
Europe Oilfield Services The European oilfield services market was valued at $45,592.5 million in 2014, and is projected to reach $60,017.5 million by 2019, at a CAGR of 5.7% from 2014 to 2019. The growth of this market can be attributed to the rise in exploration activities of new reserves, which requires increased drilling activities. The drilling services segment accounted for the largest share of 59.2% of the European oilfield services market in 2014. |
Apr 2015 |
|
|
North America Oilfield Services The oilfield services market in North America was valued around $76.85 billion in 2013, with a market share of 50.8% globally. Projected to grow at a CAGR of 9.8% from 2014 to 2019, the market is led by Weatherford, Halliburton, Schlumberger, and Baker Hughes. It is segmented on the basis of types of oilfield services and countries present in the region. |
Upcoming |


