

Dermatology Devices Market, by Type (Dermatology Treatment Devices, Dermatology Diagnostic Devices [Imaging Techniques (OCT, Ultrasound, MRI, CT), Dermatoscopes, Microscopes]), By Application, By Geography - Analysis & Forecast to 2019
- Publish Date: Jul 2015


The global dermatology devices market is expected to grow at a CAGR of 10.4% from 2014 to 2019. The rising incidence of various skin disorders such as melanoma, psoriasis, vascular lesions, and acne have led to an increased demand for dermatological devices and various procedures and surgeries for the treatment of these skin ailments. As per the latest statistics, every year around 2.7 to 3.2 million skin lesions are biopsied in the U.S., out of which 50,000 to 100,000 cases are diagnosed as melanoma.
The report segments the dermatology devices into two major type: diagnostic devices and treatment devices. The diagnostic devices segment is further segmented into imaging techniques (OCT, ultrasound, MRI, CT), dermatoscopes, and microscopes. Different types of treatment devices included in the report are LED light therapy, lasers, electrosurgical equipment, cryotherapy devices, and microdermabrasion devices.
Various sophisticated diagnostic instruments such as dermatoscopes and OCT scanners allow an early detection of skin anomalies, thereby improving survival rates, reducing the number of unnecessary biopsies, and saving the cost of care with reduced number of tests and duration of hospitalization. The optical coherence technology (OCT) is one of the major segments of imaging techniques, and is further segmented into time domain OCT and frequency domain OCT.
Technological advancements have enabled the development of accurate, and sensitive diagnostic instruments, which in turn has increased the accuracy of diagnostic procedures. Quantitative Thermographic Imaging (QTI), confocal microscopy, and Optical Coherence Tomography (OCT) have been revolutionizing the dermatology diagnostic procedures. White and polarized-light imaging, spatial & spectroscopic multispectral methods, and terahertz (THZ) imaging methods have also been adopted as potential diagnostic techniques.
The high growth potential in the emerging markets like Asia-pacific are expected to provide new growth opportunities to players in the dermatology devices market. The global dermatology devices market has been analyzed and segmented into geographies, such as North America, Europe, Asia-Pacific, and Rest of the World (RoW).
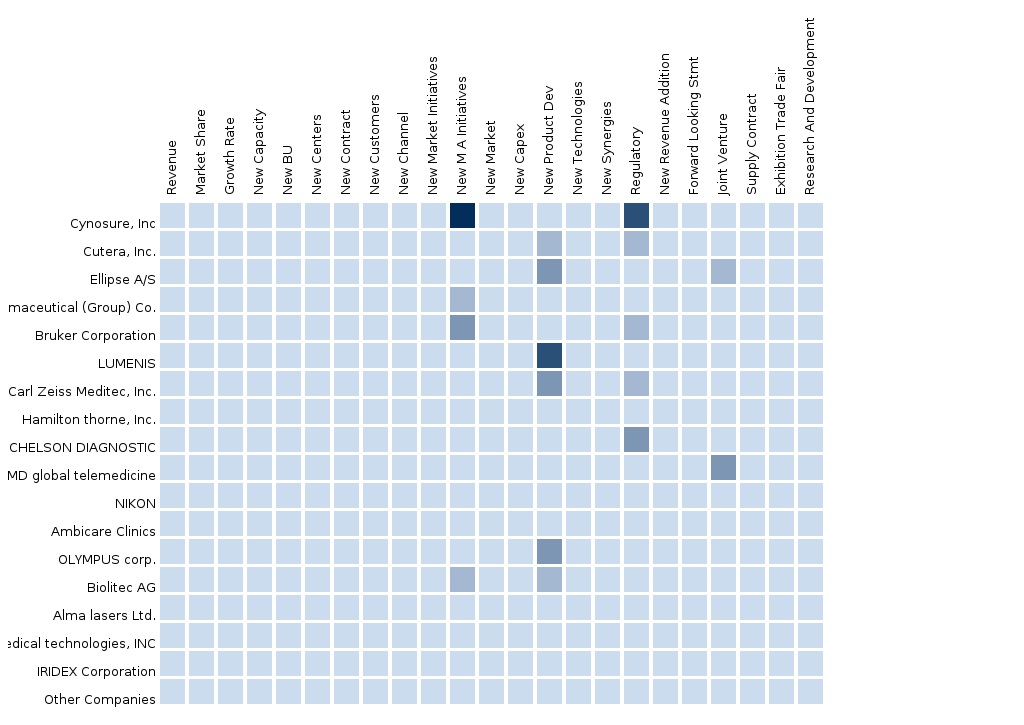
The major players profiled in the global dermatology devices market report includes Cynosure, Inc. (U.S.), Cutera, Inc. (U.S.), Lumenis Ltd. (Israel), Alma Lasers (Israel), Topcon Corporation (Japan), and Carl Ziess Meditec AG (Germany). The major developments and strategies adopted by the key players in the global dermatology devices market are included in the report.
Table Of Contents
1 Introduction (Page No. - 21)
1.1 Objectives Of The Study
1.2 Market Segmentation & Coverage
1.3 Stakeholders
2 Research Methodology (Page No. - 23)
2.1 Integrated Ecosystem Of Dermatology Devices Market
2.1.1 Arriving At The Dermatology Devices Market Size
2.1.1.1 Top-Down Approach
2.1.1.2 Demand Side Approach
2.2 Assumptions
3 Executive Summary (Page No. - 30)
4 Market Overview (Page No. - 32)
4.1 Introduction
4.2 Market Drivers And Inhibitors
5 Industry Trend Analysis (Page No. - 37)
5.1 Investor Analysis & Investment Opportunities In Optical Coherence Tomography (Oct)
5.1.1 Potential Investment Opportunities Of Oct As Compared To Its Peers
5.2 Optical Coherence Tomography (Oct) Product Matrix
5.3 Swot Analysis
5.4 Porter’s Five Force Analysis
5.5 Life Cycle Analysis, By Region
5.6 Key Product Launches
5.7 Price Analysis For The Oct Device Market
6 Dermatology Devices Market, By Type (Page No. - 49)
6.1 Introduction
6.1.1 Diagnostic Devices
6.1.2 Treatment Devices
6.2 Global Dermatology Devices Market, By Type
6.3 Global Dermatology Devices Market, By Geography
6.4 North America Dermatology Devices Market, By Type
6.5 Europe Dermatology Devices Market, By Type
6.6 Asia-Pacific Dermatology Devices Market, By Type
6.7 Row Dermatology Devices Market, By Type
7 Dermatology Diagnostic Device Market, By Type (Page No. - 56)
7.1 Introduction
7.1.1 Dermatoscope
7.1.2 Microscopes
7.1.3 Imaging Techniques
7.2 Global Dermatology Diagnostic Devices Market, By Type
7.2.1 Global Dermatology Dermatoscope Devices By Type
7.2.2 Global Dermatology Imaging Technique Devices Market, By Type
7.3 North America Dermatology Diagnostic Devices Market, By Type
7.3.1 North America Dermatology Dermatoscope Devices Market, By Type
7.3.2 North America Dermatology Imaging Technique Devices, By Type
7.4 Europe Dermatology Diagnostic Devices Market, By Type
7.4.1 Europe Dermatology Dermatoscope Devices Market, By Type
7.4.2 Europe Dermatology Imaging Technique Devices Market, By Type
7.5 Asia-Pacific Dermatology Diagnostic Devices Market, By Type
7.5.1 Asia-Pacific Dermatology Dermatoscope Devices Market, By Type
7.5.2 Asia-Pacific Dermatology Imaging Technique Devices Market, By Type
7.6 Row Dermatology Diagnostic Devices Market, By Type
7.6.1 Row Dermatology Dermatoscope Devices Market, By Type
7.6.2 Row Dermatology Imaging Technique Devices Market, By Type
8 Dermatology Treatment Device Market, By Type (Page No. - 74)
8.1 Introduction
8.1.1 Electrosurgical Equipment
8.1.2 Microdermabrasion
8.1.3 Cryotherapy Devices
8.1.4 Led Light Therapy Devices
8.1.5 Intense Pulse Light (Ipl)
8.1.6 Laser Devices
8.2 Global Dermatology Treatment Devices Market, By Type
8.3 North America Dermatology Treatment Devices Market, By Type
8.4 Europe Dermatology Treatment Devices Market, By Type
8.5 Asia-Pacific Dermatology Treatment Devices Market, By Type
8.6 Row Dermatology Treatment Devices Market, By Type
9 Dermatology Laser Device Market, By Type (Page No. - 83)
9.1 Introduction
9.1.1 Carbon Dioxide Laser
9.1.2 Nd:Yag Laser
9.1.3 Pulsed Dye Laser
9.1.4 Diode Laser
9.1.5 Argon Laser
9.1.6 Ruby Laser
9.1.7 Erbium-Yag Laser
9.2 Global Dermatology Laser Treatment Devices Market, By Type
9.2.1 North America Dermatology Laser Treatment Devices Market, By Type
9.2.2 Europe Dermatology Laser Treatment Devices Market, By Type
9.2.3 Asia-Pacific Dermatology Laser Treatment Devices Market, By Type
9.2.4 Row Dermatology Laser Treatment Devices Market, By Type
10 Laser Device Market, By Application
10.1 Introduction
10.1.1 Pigmented Lesions
10.1.2 Acne
10.1.3 Vascular Lesions
10.1.4 Skin Resurfacing
10.1.5 Psoriasis
10.2 Global Dermatology Laser Treatment Devices Market, By Application
10.2.1 North America Dermatology Laser Treatment Devices Market, By Application
10.2.2 Europe Dermatology Laser Treatment Devices Market, By Application
10.2.3 Asia-Pacific Dermatology Laser Treatment Devices Market, By Application
10.2.4 Row Dermatology Laser Treatment Devices Market, By Application
11 Optical Coherence Tomography (Oct) Devices Market, By Technology (Page No. - 99)
11.1 Introduction
11.2 Global Optical Coherence Tomography (Oct) Devices Market, By Technology
11.2.1 Global Optical Coherence Tomography (Oct) Devices Market, By Technology
11.3 North America Optical Coherence Tomography (Oct) Devices Market, By Technology
11.3.1.1 U.S. Optical Coherence Tomography (Oct) Devices Market, By Technology
11.3.1.2 Canada Optical Coherence Tomography (Oct) Devices Market, By Technology
11.3.1.3 Mexico Optical Coherence Tomography (Oct) Devices Market, By Technology
11.4 Europe Optical Coherence Tomography (Oct) Devices Market, By Technology
11.4.1.1 Germany Optical Coherence Tomography (Oct) Devices Market, By Technology
11.4.1.2 France Optical Coherence Tomography (Oct) Devices Market, By Technology
11.4.1.3 U.K. Optical Coherence Tomography (Oct) Devices Market, By Technology
11.4.1.4 Italy Optical Coherence Tomography (Oct) Devices Market, By Technology
11.4.1.5 Spain Optical Coherence Tomography (Oct) Devices Market, By Technology
11.4.1.6 Roe Optical Coherence Tomography (Oct) Devices Market, By Technology
11.5 Asia-Pacific (Apac) Optical Coherence Tomography (Oct) Devices, By Technology
11.5.1.1 China Optical Coherence Tomography (Oct) Devices Market, By Technology
11.5.1.2 Japan Optical Coherence Tomography (Oct) Devices Market, By Technology
11.5.1.3 India Optical Coherence Tomography (Oct) Devices Market, By Technology
11.5.1.4 Republic Of Korea Optical Coherence Tomography (Oct) Devices Market, By Technology
11.5.1.5 Rest Of Apac (Roa)Optical Coherence Tomography (Oct) Devices Market, By Technology
12 Optical Coherence Tomography (Oct) Devices Market, By Application (Page No. - 124)
12.1 Introduction
12.1.1 Ophthalmology
12.1.2 Cardiology
12.1.3 Dentistry
12.1.4 Dermatology
12.1.5 Oncology
12.1.6 Neurology
12.1.7 Developmental Biology
12.1.8 Clinical Research
12.1.8.1 Biomedical Research
12.1.8.2 Drug Discovery
12.1.8.3 Therapeutic Discovery
12.1.9 Life Sciences
12.1.10.1 Evaluation Of Paints And Coatings
12.1.10.2 Imaging Glass Reinforced Polymer Composites
12.2 Global Optical Coherence Tomography (Oct) Devices Market, By Application
12.3 North America Optical Coherence Tomography (Oct) Devices Market, By Application
12.3.1.1 U.S. Optical Coherence Tomography (Oct) Devices Market, By Application
12.3.1.2 Canada Optical Coherence Tomography (Oct) Devices Market, By Application
12.3.1.3 Mexico Optical Coherence Tomography (Oct) Devices Market, By Application
12.4 Europe Optical Coherence Tomography (Oct) Devices Market, By Application
12.4.1.1 Germany Optical Coherence Tomography (Oct) Devices Market, By Application
12.4.1.2 France Optical Coherence Tomography (Oct) Devices Market, By Application
12.4.1.3 U.K. Optical Coherence Tomography (Oct) Devices Market, By Application
12.4.1.4 Italy Optical Coherence Tomography (Oct) Devices Market, By Application
12.4.1.5 Spain Optical Coherence Tomography (Oct) Devices Market, By Application
12.4.1.6 Rest Of Europe (Roe) Optical Coherence Tomography (Oct) Devices Market, By Application
12.5 Asia-Pacific Optical Coherence Tomography (Oct) Devices Market, By Application
12.5.1.1 China Optical Coherence Tomography (Oct) Devices Market, By Application
12.5.1.2 Japan Optical Coherence Tomography (Oct) Devices Market, By Application
12.5.1.3 India Optical Coherence Tomography (Oct) Devices Market, By Application
12.5.1.4 Republic Of Korea Optical Coherence Tomography (Oct) Devices Market, By Application
12.5.1.5 Rest Of Asia-Pacific (Roa) Optical Coherence Tomography (Oct) Devices Market, By Application
12.5.1.6 Rest Of The World (Row) Optical Coherence Tomography (Oct) Devices Market, By Application
13 Competitive Landscape (Page No. - 150)
13.1 Market Share Analysis For Optical Coherence Tomography Marke
13.2 Product Launches
13.3 Mergers & Acquisitions
13.4 Collaborations , Joint Agreements & Expansions
13.5 Approvals , Alliances , Relocations & Licening
14 Global Dermatology Devices Market & Oct Market, By Companies (Page No. - 164)
14.1 Optovue, Inc.
14.2 Bioptigen, Inc.
14.3 Heidelberg Engineering
14.4 Tomey
14.5 Topcon Corporation
14.6 Carl Zeiss Meditec Ag
14.7 St. Jude Medical, Inc.
14.8 Canon Inc.
14.9 Optos Plc
14.1 Santec Corporation
14.11 Michelson Diagnostics Ltd.
14.12 Alma Lasers, Ltd.
14.13 Cutera, Inc.
14.14 Cynosure, Inc.
14.15 Ellipse A/S
14.16 Lumenis Ltd.
14.17 Heine Optotechnik
14.18 Welch Allyn
14.19 Amd Global Telemedicine Inc.
14.2 Applisonix Ltd.
14.21 Biolitec Ag
14.22 Fei Company
14.23 Fotofinder Systems Gmbh
14.24 Genesis Biosystems
14.25 Leica Microsystems
14.26 Nikon Corporation
14.27 Mela Sciences, Inc.
14.28 Verisante Technology, Inc.
14.29 Syneron Medical Ltd.
14.3 Solta Medical,
14.31 Photomedex, Inc.
14.32 Philips Healthcare
15 Appendix (Page No. - 233)
15.1 Customization Options
15.1.1 Product Analysis
15.1.2 Epidemiology Data
15.1.3 Surgeons/Physicians Percept Ion Analysis
15.1.4 Regulatory Framework
15.1.5 Competitive Intelligence
15.2 Related Reports
15.3 Introducing Rt: Real-Time Market Intelligence
15.3.1 Rt Snapshots
List Of Tables
Table 1 Global Dermatology Devices Peer Market Size, 2014 (Usd Mn)
Table 2 Dermatology Devices Market: Drivers And Inhibitors
Table 3 Oct Devices Market: Drivers And Inhibitors
Table 4 Oct Funding Sources
Table 5 Potential Investment Opportunities Of Oct When Compared To Its Peers
Table 6 Global Dermatology Devices Market, By Type, 2012-2019 (Usd Mn)
Table 7 Global Dermatology Devices Market, By Geography, 2012-2019 (Usd Mn)
Table 8 North America Dermatology Devices Market, By Type, 2012-2019 (Usd Mn)
Table 9 Europe Dermatology Devices Market, By Type, 2012-2019 (Usd Mn)
Table 10 Asia-Pacific Dermatology Devices Market, By Type, 2012-2019 (Usd Mn)
Table 11 Row Dermatology Devices Market, By Type, 2012-2019 (Usd Mn)
Table 12 Global Dermatology Diagnostic Devices Market, By Type, 2012-2019 (Usd Mn) 59
Table 13 Global Dermatoscope Devices Market, By Type, 2012-2019 (Usd Mn)
Table 14 Global Imaging Technique Devices Market, By Type, 2012-2019 (Usd Mn)
Table 15 North America Dermatology Diagnostic Devices Market, By Type, 2012-2019 (Usd Mn)
Table 16 North America Dermatology Dermatoscope Devices Market, By Type,2012-2019 (Usd Mn) 63
Table 17 North America Dermatology Imaging Technique Devices Market, By Type, 2012-2019 (Usd Mn)
Table 18 Europe Dermatology Diagnostic Devices Market, By Type, 2012-2019 (Usd Mn) 65
Table 19 Europe Dermatology Dermatoscope Devices Market, By Type, 2012-2019 (Usd Mn) 66
Table 20 Europe Dermatology Imaging Technique Devices Market, By Type, 2012-2019 (Usd Mn) 67
Table 21 Asia-Pacific Dermatology Diagnostic Devices Market, By Type, 2012-2019 (Usd Mn)
Table 22 Asia-Pacific Dermatology Dermatoscopes Devices Market, By Type, 2012-2019 (Usd Mn) 69
Table 23 Asia-Pacific Dermatology Imaging Techniques Devices Market, By Type, 2012-2019 (Usd Mn)
Table 24 Row Dermatology Diagnostic Devices Market, By Type, 2012-2019 (Usd Mn)
Table 25 Row Dermatology Dermatoscope Devices Market, By Type, 2012-2019 (Usd Mn) 72
Table 26 Row Dermatology Imaging Technique Devices Market, By Type, 2012-2019 (Usd Mn)
Table 27 Global Dermatology Treatment Devices Market, By Type, 2012-2019 (Usd Mn) 77
Table 28 North America Dermatology Treatment Devices Market, By Type, 2012-2019 (Usd Mn)
Table 29 Europe Dermatology Treatment Devices Market, By Type, 2012-2019 (Usd Mn) 79
Table 30 Asia-Pacific Dermatology Treatment Devices Market, By Type, 2012-2019 (Usd Mn)
Table 31 Row Dermatology Treatment Devices Market, By Type, 2012-2019 (Usd Mn)
Table 32 Global Dermatology Laser Treatment Devices Market, By Type, 2012-2019 (Usd Mn)
Table 33 North America Dermatology Laser Treatment Devices Market, By Type, 2012-2019 (Usd Mn)
Table 34 Europe Dermatology Laser Treatment Devices Market, By Type, 2012-2019 (Usd Mn)
Table 35 Asia-Pacific Dermatology Laser Treatment Devices Market, By Type,2012-2019 (Usd Mn) 89
Table 36 Row Dermatology Laser Treatment Devices Market, By Type, 2012-2019 (Usd Mn) 90
Table 37 Global Dermatology Laser Treatment Devices Market, By Application 2012-2019 (Usd Mn) 94
Table 38 North America Dermatology Laser Treatment Devices Market,By Application 2012-2019 (Usd Mn) 95
Table 39 Europe Dermatology Laser Treatment Devices Market, By Application 2012-2019 (Usd Mn) 96
Table 40 Asia-Pacific Dermatology Laser Treatment Devices Market, By Application 2012-2019 (Usd Mn)
Table 41 Row Dermatology Laser Treatment Devices Market, By Appliaction 2012-2019 (Usd Mn) 98
Table 42 Global Optical Coherence Tomography (Oct) Devices Market,By Technology 2012-2019 (Usd Mn) 102
Table 43 Global Optical Coherence Tomography (Oct) Devices Market,By Geography 2012-2019 (Usd Mn) 103
Table 44 North America Optical Coherence Tomography (Oct) Devices Market,By Technology, 2012-2019 (Usd Mn) 104
Table 45 North America Optical Coherence Tomography (Oct) Devices Market,By Country, 2012-2019 (Usd Mn) 105
Table 46 U.S. Optical Coherence Tomography (Oct) Devices Market, By Technology, 2012-2019 (Usd Mn)
Table 47 Canada Optical Coherence Tomography (Oct) Devices Market,By Technology, 2012-2019 (Usd Mn) 107
Table 48 Mexico Optical Coherence Tomography (Oct) Devices Market,By Technology, 2012-2019 (Usd Mn) 108
Table 49 Europe Optical Coherence Tomography (Oct) Devices Market,By Technology, 2012-2019 (Usd Mn) 109
Table 50 Europe Optical Coherence Tomography (Oct) Devices Market, By Country, 2012-2019 (Usd Mn)
Table 51 Germany Optical Coherence Tomography (Oct) Devices Market,By Technology, 2012-2019 (Usd Mn) 111
Table 52 France Optical Coherence Tomography (Oct) Devices Market,By Technology 2012-2019 (Usd Mn) 112
Table 53 U.K. Optical Coherence Tomography (Oct) Devices Market, By Technology, 2012-2019 (Usd Mn)
Table 54 Italy Optical Coherence Tomography (Oct) Devices Market, By Technology, 2012-2019 (Usd Mn)
Table 55 Spain Optical Coherence Tomography (Oct) Devices Market,By Technology, 2012-2019 (Usd Mn) 115
Table 56 Roe Optical Coherence Tomography (Oct) Devices Market, By Technology, 2012-2019 (Usd Mn)
Table 57 Asia-Pacific Optical Coherence Tomography (Oct) Devices Market,By Technology 2012-2019 (Usd Mn) 117
Table 58 Asia-Pacific Optical Coherence Tomography (Oct) Devices Market,By Country, 2012-2019 (Usd Mn) 118
Table 59 China Optical Coherence Tomography (Oct) Devices Market,By Technology 2012-2019 (Usd Mn) 119
Table 60 Japan Optical Coherence Tomography (Oct) Devices Market,By Technology 2012-2019 (Usd Mn) 120
Table 61 India Optical Coherence Tomography (Oct) Devices Market,By Technology 2012-2019 (Usd Mn) 121
Table 62 Republic Of Korea Optical Coherence Tomography (Oct) Devices Market,By Technology, 2012-2019 (Usd Mn) 122
Table 63 Rest Of Asia-Pacific Optical Coherence Tomography (Oct) Devices Market, By Technology 2012-2019 (Usd Mn)
Table 64 Manufacturers Of Oct Systems Based On Application
Table 65 Global Optical Coherence Tomography (Oct) Devices Market,By Application, 2012-2019 (Usd Mn) 131
Table 66 North America Optical Coherence Tomography (Oct) Devices Market,By Application, 2012-2019 (Usd Mn) 132
Table 67 U.S. Optical Coherence Tomography (Oct) Devices Market, By Application, 2012-2019 (Usd Mn)
Table 68 Canada Optical Coherence Tomography (Oct) Devices Market,By Application, 2012-2019 (Usd Mn) 134
Table 69 Mexico Optical Coherence Tomography (Oct) Devices Market,By Application, 2012-2019 (Usd Mn) 135
Table 70 Europe Optical Coherence Tomography (Oct) Devices Market,By Application, 2012-2019 (Usd Mn) 136
Table 71 Germany Optical Coherence Tomography (Oct) Devices Market,By Application, 2012-2019 (Usd Mn) 137
Table 72 France Optical Coherence Tomography (Oct) Devices Market,By Application, 2012-2019 (Usd Mn) 138
Table 73 U.K. Optical Coherence Tomography (Oct) Devices Market, By Application, 2012-2019 (Usd Mn)
Table 74 Italy Optical Coherence Tomography (Oct) Devices Market, By Application, 2012-2019 (Usd Mn)
Table 75 Spain Optical Coherence Tomography (Oct) Devices Market, By Application, 2012-2019 (Usd Mn)
Table 76 Rest Of Europe (Roe) Optical Coherence Tomography (Oct) Devices Market, By Application, 2012-2019 (Usd Mn)
Table 77 Asia-Pacific Optical Coherence Tomography (Oct) Devices Market,By Application, 2012-2019 (Usd Mn) 143
Table 78 China Optical Coherence Tomography (Oct) Devices Market,By Application, 2012-2019 (Usd Mn) 144
Table 79 Japan Optical Coherence Tomography (Oct) Devices Market,By Application, 2012-2019 (Usd Mn) 145
Table 80 India Optical Coherence Tomography (Oct) Devices Market, By Application, 2012-2019 (Usd Mn)
Table 81 Republic Of Korea (Rok) Optical Coherence Tomography (Oct) Devices Market, By Application, 2012-2019 (Usd Mn)
Table 82 Rest Of Asia-Pacific (Roa) Optical Coherence Tomography (Oct) Devices Market, By Application, 2012-2019 (Usd Mn)
Table 83 Rest Of The World (Row) Optical Coherence Tomography (Oct) Devices Market, By Application, 2012-2019 (Usd Mn)
Table 84 Optical Coherence Tomography : Company Share Analysis, 2014
Table 85 Product Launches
Table 86 Mergers & Acquisitions
Table 87 Collaborations , Joint Agreements & Expansions
Table 88 Approvals , Alliances , Relocation & Licening
Table 89 Key Financials: Topcon Corporation, 2010-2014 (Usd Mn)
Table 90 Carl Zeiss Meditec Ag: Key Financials, 2011-2013 (Usd Mn)
Table 91 St. Jude Medical, Inc.: By Business Segment, 2011-2014 (Usd Mn)
Table 92 St. Jude Medical, Inc.: By Geography, 2011-2014 (Usd Mn)
Table 93 Canon Inc.: Key Financials, 2011-2014 (Usd Mn)
Table 94 Optos Plc: Key Financials, By Geography, 2014 & 2013 (Usd Mn)
Table 95 Optos Plc: Key Financials, 2010-2014 (Usd Mn)
Table 96 Cutera, Inc.: Key Financials, By Geography, 2012-2014 (Usd Mn)
Table 97 Cutera, Inc.: Key Financials, By Business Segment, 2012-2014 (Usd Mn)
Table 98 Cynosure, Inc.: Key Financials, 2011-2014 (Usd Mn)
Table 99 Lumenis Ltd.: Key Financials, 2011-2014 (Usd Mn)
Table 100 Leica Microsystems: Key Financials, 2011 - 2013 (Usd Mn)
Table 101 Syneron Medical Ltd.: Key Financials, 20011 - 2013 (Usd Mn)
Table 102 Solta Medical, A Division Of Valeant Pharmaceuticals North America, Llc: Key Financials, 2011 - 2013 (Usd Mn)
Table 103 Photomedex, Inc.: Key Financials, 2011 - 2013 (Usd Mn)
List Of Figures
Figure 1 Market Segmentation & Coverage
Figure 2 Dermatology Devices Market: Integrated Ecosystem
Figure 3 Top-Down Approach
Figure 4 Global Skin Cancer Incidence, 2012 & 2015
Figure 5 Global Aging Population, By Major Countries, 2014
Figure 6 Malignant Melanoma European Incidence And Mortality, 2012
Figure 7 Prevalent Cases Of Skin Melanoma In Asia, 2014
Figure 8 New Cases Of Skin Melanoma In The U.S., 2013
Figure 9 Dermatology Devices Market Snapshot
Figure 10 Dermatology Devices Market: Growth Aspects
Figure 11 Year-Wise Nih Oct Funding (Usd Mn)
Figure 12 U.K., Nsf & Canada Funding For Oct (Usd Mn)
Figure 13 Potential Investment Opportunities Of Oct When Compared To Its Peers
Figure 14 Optical Coherence Tomography (Oct) Product Matrix
Figure 15 Dermatology Devices Market: Swot Analysis
Figure 16 Porter’s Five Force Analysis
Figure 17 Life Cycle Analysis, By Region
Figure 18 Global Dermatology Devices Market, By Type, 2012-2019 (Usd Mn)
Figure 19 Global Dermatology Devices Market, By Geography, 2012-2019 (Usd Mn)
Figure 20 North America Dermatology Devices Market, By Type, 2012-2019 (Usd Mn)
Figure 21 Europe Dermatology Devices Market, By Type, 2012-2019 (Usd Mn)
Figure 22 Asia-Pacific Dermatology Devices Market, By Type, 2012-2019 (Usd Mn)
Figure 23 Row Dermatology Devices Market, By Type, 2012-2019 (Usd Mn)
Figure 24 Global Dermatology Diagnostic Devices Market, By Type, 2012-2019 (Usd Mn) 59
Figure 25 Global Dermatoscope Devices Market, By Type, 2012-2019 (Usd Mn)
Figure 26 Global Imaging Technique Devices Market, By Type, 2012-2019 (Usd Mn)
Figure 27 North America Dermatology Diagnostic Devices Market, By Type, 2012-2019 (Usd Mn)
Figure 28 North America Dermatology Dermatoscope Devices Market, By Type, 2012-2019 (Usd Mn)
Figure 29 North America Dermatology Imaging Technique Devices Market, By Type, 2012-2019 (Usd Mn)
Figure 30 Europe Dermatology Diagnostic Devices Market, By Type, 2012-2019 (Usd Mn) 65
Figure 31 Europe Dermatology Dermatoscope Devices Market, By Type, 2012-2019 (Usd Mn) 66
Figure 32 Europe Dermatology Imaging Technique Devices Market, By Type, 2012-2019 (Usd Mn)
Figure 33 Asia-Pacific Dermatology Diagnostic Devices Market, By Type, 2012-2019 (Usd Mn)
Figure 34 Asia-Pacific Dermatology Dermatoscope Devices Market, By Type, 2012-2019 (Usd Mn)
Figure 35 Asia-Pacific Dermatology Imaging Techniques Devices Market, By Type, 2012-2019 (Usd Mn)
Figure 36 Row Dermatology Diagnostic Devices Market, By Type, 2012-2019 (Usd Mn)
Figure 37 Row Dermatology Dermatoscope Devices Market, By Type, 2012-2019 (Usd Mn) 72
Figure 38 Row Dermatology Imaging Technique Devices Market, By Type, 2012-2019 (Usd Mn)
Figure 39 Global Dermatology Treatment Devices Market By Type, 2012-2019 (Usd Mn)
Figure 40 North America Dermatology Treatment Devices Market, By Type, 2012-2019
Figure 41 Europe Dermatology Treatment Devices Market, By Type, 2012-2019
Figure 42 Asia-Pacific Dermatology Treatment Devices Market, By Type, 2012-2019
Figure 43 Row Dermatology Treatment Devices Market, By Type, 2012-2019
Figure 44 Global Dermatology Laser Treatment Devices Market, By Type, 2012-2019 (Usd Mn)
Figure 45 North America Dermatology Laser Treatment Devices Market, By Type, 2012-2019 (Usd Mn)
Figure 46 Europe Dermatology Laser Treatment Devices Market, By Type, 2012-2019 (Usd Mn)
Figure 47 Asia-Pacific Dermatology Laser Treatment Devices Market, By Type,2012-2019 (Usd Mn) 89
Figure 48 Row Dermatology Laser Treatment Devices Market, By Type, 2012-2019 (Usd Mn) 90
Figure 49 Global Dermatology Laser Treatment Devices Market, By Application 2012-2019 (Usd Mn) 94
Figure 50 North America Dermatology Laser Treatment Devices Market,By Application, 2012-2019 (Usd Mn) 95
Figure 51 Europe Dermatology Laser Treatment Devices Market, By Application 2012-2019 (Usd Mn) 96
Figure 52 Asia-Pacific Dermatology Laser Treatment Devices Market, By Application 2012-2019 (Usd Mn)
Figure 53 Row Dermatology Laser Treatment Devices Market, By Application 2012-2019 (Usd Mn) 98
Figure 54 Global Optical Coherence Tomography (Oct) Devices Market, By Technology 2012-2019 (Usd Mn)
Figure 55 North America Optical Coherence Tomography (Oct) Devices Market, By Technology 2012-2019 (Usd Mn)
Figure 56 North America Optical Coherence Tomography (Oct) Devices Market, By Country, 2012-2019 (Usd Mn)
Figure 57 U.S. Optical Coherence Tomography (Oct) Devices Market, By Technology, 2012-2019 (Usd Mn)
Figure 58 Canada Optical Coherence Tomography (Oct) Devices Market,By Technology, 2012-2019 (Usd Mn) 106
Figure 59 Mexico Optical Coherence Tomography (Oct) Devices Market,By Technology 2012-2019 (Usd Mn) 107
Figure 60 Europe Optical Coherence Tomography (Oct) Devices Market,By Technology, 2012-2019 (Usd Mn) 108
Figure 61 Europe Optical Coherence Tomography (Oct) Devices Market, By Counrty, 2012-2019 (Usd Mn)
Figure 62 Germany Optical Coherence Tomography (Oct) Devices Market,By Technology, 2012-2019 (Usd Mn) 110
Figure 63 France Optical Coherence Tomography (Oct) Devices Market,By Technology 2012-2019 (Usd Mn) 111
Figure 64 U.K. Optical Coherence Tomography (Oct) Devices Market, By Technology, 2012-2019 (Usd Mn)
Figure 65 Italy Optical Coherence Tomography (Oct) Devices Market, By Technology, 2012-2019 (Usd Mn)
Figure 66 Spain Optical Coherence Tomography (Oct) Devices Market,By Technology, 2012-2019 (Usd Mn) 114
Figure 67 Roe Optical Coherence Tomography (Oct) Devices Market, By Technology, 2012-2019 (Usd Mn)
Figure 68 Asia-Pacific Optical Coherence Tomography (Oct) Devices Market,By Technology, 2012-2019 (Usd Mn) 116
Figure 69 Asia-Pacific Optical Coherence Tomography (Oct) Devices Market,By Country, 2012-2019 (Usd Mn) 117
Figure 70 China Optical Coherence Tomography (Oct) Devices Market,By Technology, 2012-2019 (Usd Mn) 118
Figure 71 Japan Optical Coherence Tomography (Oct) Devices Market,By Technology, 2012-2019 (Usd Mn) 119
Figure 72 India Optical Coherence Tomography (Oct) Devices Market, By Technology 2012-2019 (Usd Mn)
Figure 73 Republic Of Korea Optical Coherence Tomography (Oct) Devices Market,By Technology, 2012-2019 (Usd Mn) 121
Figure 74 Rest Of Apac Optical (Roa)Coherence Tomography (Oct) Devices Market,By Technology, 2012-2019 (Usd Mn) 122
Figure 75 Optical Coherence Tomography : Company Share Analysis
Figure 76 Topcon Corporation Revenue Mix, (2014)
Figure 77 Carl Zeiss Meditec Ag: Revenue Mix, (2013)
Figure 78 St. Jude Medical, Inc.: Revenue Mix (2014)
Figure 79 Canon Inc.: Revenue Mix (2014)
Figure 80 Optos Plc: Revenue Mix (2014)
Figure 81 Cutera Inc.: Revenue Mix, (2014)
Figure 82 Cynosure, Inc. Revenue Mix, (2014)
Figure 83 Lumenis: Revenue Mix (2014)
Dermatology devices aid in the diagnosis and treatment of various skin disorders and cancer by helping dermatologists or physicians to identify the skin disorder at an early stage. The rising incidence of various skin disorders such as melanoma, psoriasis, vascular lesions, and acne have resulted in an increased demand for dermatological devices.
The global dermatology devices market was valued at $7.23 billion in 2014, and is projected grow at a CAGR of 10.4% from 2014 to 2019. The dermatology treatment devices segment is expected to grow at a CAGR of 10.6% during the forecast period, to reach $11.37 billion by 2019. This segment accounted for a share of 95.1% of the global dermatology devices market.
The rise in demand for aesthetic procedures, less-invasive surgeries, and quick recovery is expected to influence the overall demand for dermatology devices. The global dermatology devices market has been analyzed and segmented on the basis of type and geography. Based on geography, the market has been classified into North America, Europe, Asia-Pacific, and rest of the world (RoW).
North America accounted for the largest share of the global dermatology devices market, and is projected to grow at a CAGR of 10.3% from 2014 to 2019. The U.S. contributed the largest share to this market. As per the latest statistics, every year around 2.7 to 3.2 million skin lesions are biopsied in the U.S., out of which 50,000 to 100,000 cases are diagnosed as melanoma. Various sophisticated diagnostic instruments such as dermatoscopes and OCT scanners allow an early detection of melanoma, thereby improving survival rates.
Emerging economies such as Asia-Pacific and the Middle-East offer profitable business opportunities for this market. The countries like the Republic of Korea witness a high number of cosmetic surgeries, whereas Israel has highest incidences of skin cancers. This presents great opportunities for the growth of dermatology devices to be used for the diagnosis and treatment of skin ailments and cancer as well for aesthetic procedures. The healthcare infrastructure in these countries has undergone a significant change. The increased healthcare expenditures made by the governments in these countries has helped adoption of new technologies and aided them to cater to more patients over the years.
The major players profiled in the global dermatology devices market report include Cynosure, Inc. (U.S.), Cutera, Inc. (U.S.), Lumenis Ltd. (Israel), Alma Lasers (Israel), Topcon Corporation (Japan), and Carl Ziess Meditec AG (Germany).
The report gives comprehensive and detailed insights about the segments covered in particular countries in the geographic analysis chapter. It also presents in-depth competitive landscape covering major developments in the region from 2012 to 2015, and also the segment specific company share analysis for 2014.
Please visit https://www.micromarketmonitor.com/custom-research-services.html to specify your custom Research Requirement
| PRODUCT TITLE | PUBLISHED | |
|---|---|---|
|
|
Dermatology Diagnostic Devices Diagnostic Devices and Treatment Devices adds up to total |
Mar 2015 |
|
|
Global Dermatology Treatment Devices Market Treatment Devices and Diagnostic Devices adds up to total |
May 2015 |
|
|
Dermatoscope Dermatoscope and Microscopes and Imaging Techniques adds up to... |
Upcoming |
|
|
Microscopes Microscopes and Dermatoscope and Imaging Techniques adds up to... |
Upcoming |
|
|
Imaging Techniques Imaging Techniques and Dermatoscope and Microscopes adds up to total |
Upcoming |
|
|
surgical Instruments Market The global electrosurgical instruments market was valued at $1,913.4 million in 2013 and is expected to reach $2,653.2 million by 2019, growing at a CAGR of 6.8% during the forecast period. The main companies leading the market and extensively covered in this report are Covidien plc (Ireland), Ethicon, Inc. (U.S.), Olympus Corporation (Japan), CONMED Corporation (U.S.), ERBE Elektromedizin GmbH (Germany), Bovie Medical Corporation (U.S.), and BOWA-electronic GmbH & Co. KG (Germany). The details of segment and country-specific company shares, news and deals, mergers and acquisitions, segment-specific pipeline products, product approvals, and product recalls of the major companies have also been covered in the report. |
Upcoming |
|
|
Liposuction Devices Liposuction Devices and Electrosurgical Equipment, |
Upcoming |
|
|
Microdermabrasion Microdermabrasion and Electrosurgical Equipment, |
Upcoming |
|
|
Cryotherapy Devices Cryotherapy Devices and Electrosurgical Equipment, |
Upcoming |
|
|
Led Light Therapy Devices Led Light Therapy Devices and Electrosurgical Equipment, |
Upcoming |
|
|
Lasers Laser market consist of Lasers and Electrosurgical Equipment, Liposuction Devices, Microdermabrasion, Cryotherapy Devices and Led Light Therapy Devices adds up to total Treatment Devices market. Lasers Market is segmented by Geographies, Types and Applications. Geographies of Lasers are North America, Asia, Rest of World and Europe. |
Upcoming |
|
|
Traditional dermatoscope Traditional dermatoscope and Digital dermatoscope adds up to total |
Upcoming |
|
|
Digital dermatoscope Digital dermatoscope and Traditional dermatoscope adds up to total |
Upcoming |
|
|
European Dermatology Treatment Devices The dermatology treatment devices market in Europe is expected to grow at a CAGR of 12.5% from 2012 to 2018. The market dynamics, along with the drivers and restraints for this market, have been elaborated in this report. |
Upcoming |
|
|
Asian Dermatology Treatment Devices In the Asian region, the demand for laser devices such as argon, pulsed dye, and intense pulse light laser has increased in the recent past. The geographies segment comprises major countries in this region, which includes China, Japan, and India. |
Upcoming |
|
|
North American Dermatology Treatment Devices The dermatology treatment devices market is expected to witness substantial growth in the near future, as they facilitate less-invasive surgeries and help with quick recovery. This report on the dermatology treatment devices market provides in-depth and country-specific data for the concerned market. |
Apr 2015 |
|
|
North American Dermatology Diagnostic Devices North America is considered as the largest market in the dermatology diagnostic devices market segment, which is anticipated to grow at a CAGR of 9.6% from 2012 to 2013. Factors that drive this market are a rise in the number of non-invasive cosmetic procedures, prevalence of skin disorders among people, and rapid technological developments made in the field of dermatology. |
Apr 2015 |
|
|
Asian Dermatology Diagnostic Devices The Asian dermatology diagnostic devices market is considered as the third largest market, which is anticipated to rise at a CAGR of 11.5% from 2012 to 2018. This report significantly analyzes the concerned market, with respect to market estimates and forecasts of revenue. It also sheds light on the current and future trends that define the growth of this market. |
Apr 2015 |
|
|
European Dermatology Diagnostic Devices The global healthcare industry is witnessing a shift in paradigm and is now skewed towards non-invasive diagnostics, which helps in easy and painless diagnosis. Dermatology diagnostic devices are one such device that aids in the easy detection of the various skin disorders such as Melanoma. Of the various diagnostic devices, digital photography tool and dermatoscope are majorly used by dermatologist are. Dermatoscope aids in better diagnosis, beyond what the naked eye can see. The device projects light on the skin and causes magnification of the skin structure thus, helping in better diagnosis. The digital photography involves the total cutaneous imaging of the skin lesion, with serial images that are recorded over a period of time, which are then further analyzed. |
Jun 2015 |
|
|
North America Dermatology Devices The major factors driving the demand for dermatological devices in the U.S. are the desire for youthful appearance, increasing incidence rates of skin diseases, increasing trend towards non-invasive aesthetic procedures, and technological advancements. People are becoming more conscious about their appearance and are aware of the skin disorders caused due to exposure to the sun. |
Feb 2015 |


