

Asia Dermatology Diagnostic Devices Market by Diagnostic Device (Dermatoscope, Microscope, Imaging Techniques), by Treatment Device (Liposuction, Microdermabrasion, Lasers), by Application (Cancer Diagnosis, Psoriasis, Hair Removal) - Analysis and Forecast to 2019
- Publish Date: Apr 2015


The global healthcare industry is shifting towards noninvasive diagnostics. To this end, dermatology diagnostic devices are being put into use as they aid in the easy detection of various skin disorders such as melanoma. There are various kinds of diagnostic devices in the market; the most adopted are digital photography tools and dermatoscopes.
Based on type of product, the market is segmented into dermatoscopes, imaging techniques, and microscopes. The dermatology diagnostic devices market is dominated by the imaging techniques, holding over 62.0% of the market and expected to grow at a CAGR of 7.0% during the forecast period, 2014-2019. The imaging techniques segment is also the fastest-growing market. This market segment is classified into ultrasound, CT, MRI, and OCT, of which the ultrasound market held the highest market share—50.0%. The dermatoscopes market is further divided into traditional and digital dermatoscopes, with traditional dermatoscopes holding the highest market share—59.7%.
In Asia, China dominates the market, followed by Japan. The Indian region is the fastest-growing region and expected to register a CAGR of 7.3% during the forecast period. This is due to the increasing demand for dermatologists and increasing awareness of skin disorders in this region.
An in-depth market share analysis, by revenue, of top companies is also included in the report. These numbers were arrived at based on key facts, annual financial information from SEC filings, annual reports and interviews with industry experts, and key opinion leaders such as CEOs, directors, and marketing executives. A detailed market share analysis of the major players in the Asian diagnostic devices market is covered in this report. The major companies in this market include AMD Global Telemedicine, Inc., Heine Optotechnik (Germany), Optomed Oy (Finland), FotoFinder Systems (Germany), Michelson Diagnostics (U.K.), GE Healthcare (U.K.), Philips Healthcare (Netherlands), Welch Allyn (U.S.), Carl Zeiss Meditec, Inc. (U.S.), Hitachi (Japan), Leica Microsystems (Germany), Olympus (Japan), Toshiba Medical Systems (Japan), and Siemens Healthcare (Germany).
Table of Contents
1 Introduction (Page No. - 12)
1.1 Objectives of the Study
1.2 Market Segmentation & Coverage
1.3 Stakeholders
2 Research Methodology (Page No. - 14)
2.1 Integrated Ecosystem of the Asian Dermatology Diagnostic Devices Market
2.2 Arriving at the Asian Dermatology Diagnostic Devices Market Size
2.2.1 Top-Down Approach
2.2.2 Macroindicator-Based Approach
2.3 Assumptions
3 Executive Summary (Page No. - 19)
4 Market Overview (Page No. - 21)
4.1 Introduction
4.2 Asian Dermatology Diagnostic Devices Market: Comparison With Parent Market (Asian Dermatological Devices Market)
4.3 Market Drivers and Inhibitors
4.4 Key Market Dynamics
5 Asian Dermatology Diagnostic Devices, By Product (Page No. - 27)
5.1 Introduction
5.2 Asian Dermatology Devices Market: Comparison With Parent Market
5.3 Asian Dermatology Diagnostic Devices Market for Imaging Techniques
5.4 Asian Dermatology Diagnostic Devices Market for Dermatoscopes
6 Asian Dermatology Diagnostic Devices Market, By End User (Page No. - 34)
6.1 Introduction
6.1.1 Asian Dermatology Diagnostic Devices Market Size for Clinics, By Geography
6.1.2 Asian Dermatology Diagnostic Devices Market for Hospitals, By Geography
6.2 Asian Dermatology Diagnostic Devices Market: End-User Comparison
7 Asian Dermatology Diagnostic Devices Market, By Geography (Page No. - 41)
7.1 Introduction
7.2 Chinese Dermatology Diagnostic Devices Market
7.2.1 Chinese Dermatology Diagnostic Devices Market
7.2.2 Chinese Dermatology Diagnostic Devices Market, By Product
7.2.3 Chinese Imaging Techniques Market, By Type
7.2.4 Chinese Dermatoscopes Market, By Type
7.3 Japanese Dermatology Diagnostic Devices Market
7.3.1 Japanese Dermatology Diagnostic Devices Market
7.3.2 Japanese Dermatology Diagnostic Devices Market, By Product
7.3.3 Japanese Imaging Techniques Market, By Product
7.3.4 Japanese Dermatoscopes Market, By Product
7.4 Indian Dermatology Diagnostic Devices Market
7.4.1 Indian Dermatology Diagnostic Devices Market
7.4.2 Indian Dermatology Diagnostic Devices Market, By Product
7.4.3 Indian Imaging Techniques Market, By Product
7.4.4 Indian Dermatoscopes Market, By Product
7.5 Korean Dermatology Diagnostic Devices Market
7.5.1 Korean Dermatology Diagnostic Devices Market
7.5.2 Korean Dermatology Diagnostic Devices Market, By Product
7.5.3 Korean Imaging Techniques Market, By Product
7.5.4 Korean Dermatoscopes Market, By Product
7.6 Singaporean Dermatology Diagnostic Devices Market
7.6.1 Singaporean Dermatology Diagnostic Devices Market
7.6.2 Singaporean Dermatology Diagnostic Devices Market, By Product
7.6.3 Singaporean Imaging Techniques Market, By Product
7.6.4 Singaporean Dermatoscopes Market, By Product
7.7 Malaysian Dermatology Diagnostic Devices Market
7.7.1 Malaysian Dermatology Diagnostic Devices Market
7.7.2 Malaysian Dermatology Diagnostic Devices Market, By Product
7.7.3 Malaysian Imaging Techniques Market, By Product
7.7.4 Malaysian Dermatoscopes Market, By Product
7.8 Indonesian Dermatology Diagnostic Devices Market
7.8.1 Indonesian Dermatology Diagnostic Devices Market
7.8.2 Indonesian Dermatology Diagnostic Devices Market, By Product
7.8.3 Indonesian Imaging Techniques Market, By Product
7.8.4 Indonesian Dermatoscopes Market, By Product
7.9 Rest of Asia (RoA) Dermatology Diagnostic Devices Market
7.9.1 Rest of Asia (RoA) Dermatology Diagnostic Devices Market
7.9.2 Rest of Asia (RoA) Dermatology Diagnostic Devices Market, By Product
7.9.3 Rest of Asia (RoA) Imaging Techniques Market, By Product
7.9.4 Rest of Asia (RoA) Dermatoscopes Market, By Product
8 Asian Dermatology Diagnostic Devices Market: Competitive Landscape (Page No. - 83)
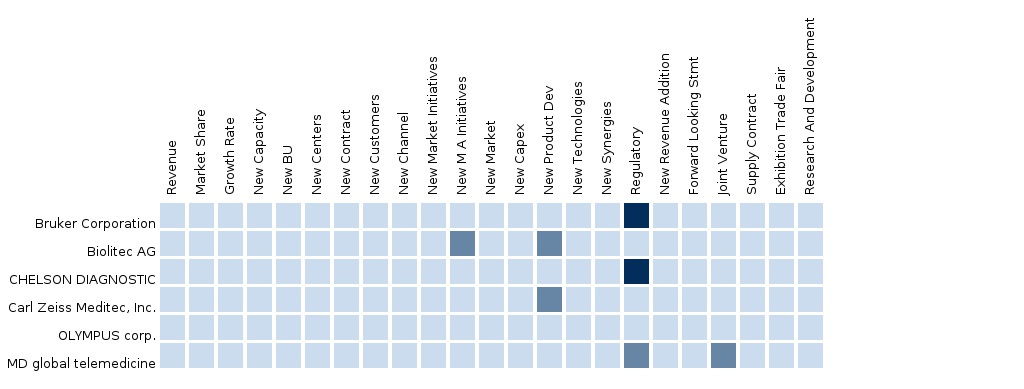
8.1 Asian Dermatology Diagnostic Devices Market: Company Share Analysis
8.2 Mergers & Acquisitions
8.3 New Product Launches
9 Asian Dermatology Devices Market, By Company (Page No. - 87)
(Overview, Financials, Products & Services, Strategy, and Developments)*
9.1 Welch Allyn
9.2 Bruker Corporation
9.3 Philips Healthcare
9.4 Toshiba Medical Systems
9.5 Siemens Healthcare
9.6 GE Healthcare
9.7 AMD Global Telemedicine, Inc.
9.8 Carl Zeiss
9.9 FEI Company
9.10 Fotofinder Systems Gmbh
9.11 Leica Microsystems
9.12 Michelson Diagnostics Ltd.
9.13 Nikon Corporation
9.14 MELA Sciences, Inc.
9.15 Verisante Technology, Inc.
9.16 Heine Optotechnik
9.17 Photomedex, Inc.
*Details on Overview, Financials, Product & Services, Strategy, and Developments Might Not Be Captured in Case of Unlisted Company
10 Appendix (Page No. - 114)
10.1 Customization Options
10.1.1 Impact Analysis
10.2 Related Reports
10.3 Introducing RT: Real-Time Market Intelligence
10.3.1 RT Snapshots
List of Tables (52 Tables)
Table 1 Asia: Dermatology Diagnostic Devices Peer Market Size, 2014 (USD MN)
Table 2 Asian Dermatology Devices Market: Prevalent Cases of Skin Melanoma (Males and Females), By Geography, 2014
Table 3 Asian Dermatology Diagnostic Devices Market: Comparison With Parent Market, 2013 – 2019 (USD MN)
Table 4 Asian Dermatology Diagnostic Devices Market: Drivers and Inhibitors
Table 5 Asia: Dermatology Diagnostic Devices Market Size, By Geography,2013–2019 (USD MN)
Table 6 Asia: Dermatology Devices Market Size, By Product, 2013–2019 (USD MN)
Table 7 Asia: Imaging Techniques Market Size, By Product, 2013-2019 (USD MN)
Table 8 Asia: Dermatoscopes Market Size, By Product, 2013-2019 (USD MN)
Table 9 Asia: Dermatology Diagnostic Devices Market Size, By Product,2013-2019 (USD MN)
Table 10 Asian Dermatology Diagnostic Devices Market: Comparison With Parent Market
Table 11 Asia: Dermatology Diagnostic Devices Market for Imaging Techniques,By Product, 2013–2019 (USD MN)
Table 12 Asia: Dermatology Diagnostic Devices Market for Dermatoscopes,By Types, 2013–2019 (USD MN)
Table 13 Asia: Dermatology Diagnostic Devices Market Size, By End User,2013–2019 (USD MN)
Table 14 Asia: Dermatology Devices Market Size for Clinics, By Geography,2013–2019 (USD MN)
Table 15 Asian Dermatology Diagnostic Devices Market Size for Hospitals,By Geography, 2013–2019 (USD MN)
Table 16 Asia: Dermatology Devices Market, End-User Comparison, 2013–2019
Table 17 Asia: Dermatology Diagnostic Devices Market Size, By Geography,2013–2019 (USD MN)
Table 18 China: Dermatology Diagnostic Devices Market Size, 2013–2019 (USD MN)
Table 19 China: Dermatology Diagnostic Devices Market Size, By Product,2013–2019 (USD MN)
Table 20 China: Imaging Techniques Market Size, By Type, 2013–2019 (USD MN)
Table 21 China: Dermatoscopes Market Size, By Type, 2013–2019 (USD MN)
Table 22 Japan: Dermatology Diagnostic Devices Market Size, 2013–2019 (USD MN)
Table 23 Japan: Dermatology Diagnostic Devices Market Size, By Product,2013–2019 (USD MN)
Table 24 Japan: Imaging Techniques Market Size, By Product, 2013–2019 (USD MN)
Table 25 Japan: Dermatoscopes Market Size, By Product, 2013–2019 (USD MN)
Table 26 India: Dermatology Diagnostic Devices Market Size, 2013–2019 (USD MN)
Table 27 India: Dermatology Diagnostic Devices Market Size, By Product,2013–2019 (USD MN)
Table 28 India: Imaging Techniques Market Size, By Product, 2013–2019 (USD MN)
Table 29 India: Dermatoscopes Market Size, By Product, 2013–2019 (USD MN)
Table 30 Korea: Dermatology Diagnostic Devices Market Size, 2013–2019 (USD MN)
Table 31 Korea: Dermatology Diagnostic Devices Market Size, By Product,2013–2019 (USD MN)
Table 32 Korea: Imaging Techniques Market Size, By Product, 2013–2019 (USD MN)
Table 33 Korea: Dermatoscopes Market Size, By Product, 2013–2019 (USD MN)
Table 34 Singapore: Dermatology Diagnostic Devices Market Size,2013–2019 (USD MN)
Table 35 Singapore: Dermatology Diagnostic Devices Market Size, By Product,2013–2019 (USD MN)
Table 36 Singapore: Imaging Techniques Market Size, By Product, 2013–2019 (USD MN)
Table 37 Singapore: Dermatoscopes Market Size, By Product, 2013–2019 (USD MN)
Table 38 Malaysia: Dermatology Diagnostic Devices Market Size, 2013–2019 (USD MN)
Table 39 Malaysia: Dermatology Diagnostic Devices Market Size, By Product,2013–2019 (USD MN)
Table 40 Malaysia: Imaging Techniques Market Size, By Product, 2013–2019 (USD MN)
Table 41 Malaysia: Dermatoscopes Market Size, By Product, 2013–2019 (USD MN)
Table 42 Indonesia: Dermatology Diagnostic Devices Market Size,2013–2019 (USD MN)
Table 43 Indonesia: Dermatology Diagnostic Devices Market Size, By Product,2013–2019 (USD MN)
Table 44 Indonesia: Imaging Techniques Market Size, By Product, 2013–2019 (USD MN)
Table 45 Indonesia: Dermatoscopes Market Size, By Product, 2013–2019 (USD MN)
Table 46 Rest of Asia (RoA): Dermatology Diagnostic Devices Market Size,2013–2019 (USD MN)
Table 47 Rest of Asia (RoA): Dermatology Diagnostic Devices Market Size,By Product, 2013–2019 (USD MN)
Table 48 Rest of Asia (RoA): Imaging Techniques Market Size, By Product,2013–2019 (USD MN)
Table 49 Rest of Asia (RoA): Dermatoscopes Market Size, By Product,2013–2019 (USD MN)
Table 50 Asian Dermatology Diagnostic Devices Market: Company Share Analysis, 2014 (%)
Table 51 Asia Dermatology Devices Market: Mergers & Acquisitions
Table 52 Asia Dermatology Devices Market: New Product Launches
List of Figures (63 Figures)
Figure 1 Asian Dermatology Diagnostic Devices Market: Segmentation & Coverage
Figure 2 Dermatology Diagnostic Devices Market: Integrated Ecosystem
Figure 3 Top-Down Approach
Figure 4 Asian Dermatology Diagnostic Devices Market: Prevalent Cases of Melanoma of Skin (Males and Females), By Geography, 2014
Figure 5 Asian Dermatology Diagnostic Devices Market Snapshot, 2014
Figure 6 Asian Dermatology Diagnostic Devices Market: Comparison With Parent Market
Figure 7 Asian Dermatology Diagnostic Devices Market, By Geography,2014 Vs 2019 (USD MN)
Figure 8 Asian Dermatology Diagnostic Devices Market, By Product,2014 Vs. 2019 (USD MN)
Figure 9 Asian Imaging Techniques Market, By Product, 2014 Vs. 2019 (USD MN)
Figure 10 Asian Dermatoscopes Market, By Product, 2014 Vs. 2019 (USD MN)
Figure 11 Asian Dermatology Diagnostic Devices Market By Products,2014 & 2019 (USD MN)
Figure 12 Asian Dermatology Diagnostic Devices Market, By Product: Comparison With Parent Market
Figure 13 Asian Dermatology Diagnostic Devices Market for Imaging Techniques,By Product, 2014 & 2019 (USD MN)
Figure 14 Asian Dermatology Diagnostic Devices Market for Imaging Techniques,By Product, 2013–2019 (USD MN)
Figure 15 Asian Dermatology Diagnostic Devices Market for Dermatoscopes,By Type, 2013 & 2019 (USD MN)
Figure 16 Asian Dermatology Diagnostic Devices Market for Dermatoscopes,By Type, 2013–2019 (USD MN)
Figure 17 Asian Dermatology Devices Market, By End User, 2014
Figure 18 Asian Dermatology Diagnostic Devices Market, By End User: Number of Plastic Surgeons, 2013
Figure 19 Asian Dermatology Diagnostic Devices Market, By End User,2014 Vs 2019 (USD MN)
Figure 20 Asian Dermatology Diagnostic Devices Market for Clinics, By Geography, 2013–2019 (USD MN)
Figure 21 Asian Dermatology Diagnostic Devices Market for Hospitals,By Geography, 2013–2019 (USD MN)
Figure 22 Asian Dermatology Devices Market: End-User Comparison 2013 – 2019 (USD MN)
Figure 23 Chinese Dermatology Diagnostic Devices Market, 2014 Vs 2019
Figure 24 Chinese Dermatology Diagnostic Devices Market, 2014 Vs 2019 (USD MN)
Figure 25 Chinese Dermatology Diagnostic Devices Market, By Product,2013–2019 (USD MN)
Figure 26 Chinese Imaging Techniques Market, By Type, 2013–2019 (USD MN)
Figure 27 Chinese Dermatoscopes Market, By Type, 2013–2019 (USD MN)
Figure 28 Japanese Dermatology Diagnostic Devices Market, By Product,2014 Vs 2019 (USD MN)
Figure 29 Japanese Dermatology Diagnostic Devices Market, 2014 -2019 (USD MN)
Figure 30 Japanese Dermatology Diagnostic Devices Market, By Product,2013–2019 (USD MN)
Figure 31 Japanese Imaging Techniques Market, By Product, 2013–2019 (USD MN)
Figure 32 Japanese Dermatoscopes Market, By Product, 2013–2019 (USD MN)
Figure 33 Indian Dermatology Diagnostic Devices Market, By Product, 2014 Vs 2019
Figure 34 Indian Dermatology Diagnostic Devices Market, 2014 Vs 2019 (USD MN)
Figure 35 Indian Dermatology Diagnostic Devices Market, By Product,2013–2019 (USD MN)
Figure 36 Indian Imaging Techniques Markets, By Product, 2013–2019 (USD MN)
Figure 37 Indian Dermatoscopes Market, By Product, 2013–2019 (USD MN)
Figure 38 Korean Dermatology Diagnostic Devices Market, By Product,2014 & 2019 ($Million)
Figure 39 Korean Dermatology Diagnostic Devices Market, 2013 Vs 2019 (USD MN)
Figure 40 Korean Dermatology Diagnostic Devices Market, By Product,2013–2019 (USD MN)
Figure 41 Korean Imaging Techniques Market, By Product, 2013–2019 (USD MN)
Figure 42 Korean Dermatoscopes Market, By Product, 2013–2019 (USD MN)
Figure 43 Singaporean Dermatology Diagnostic Devices Market, By Product,2014 & 2019
Figure 44 Singaporean Dermatology Diagnostic Devices Market,2014 Vs 2019 (USD MN)
Figure 45 Singaporean Dermatology Diagnostic Devices Market, By Product,2013–2019 (USD MN)
Figure 46 Singaporean Imaging Techniques Market, By Product, 2013–2019 (USD MN)
Figure 47 Singaporean Dermatoscopes Market, By Product, 2013–2019 (USD MN)
Figure 48 Malaysian Dermatology Diagnostic Devices Market, By Product,2014 Vs 2019
Figure 49 Malaysian Dermatology Diagnostic Devices Market, 2014 Vs 2019 (USD MN)
Figure 50 Malaysian Dermatology Diagnostic Devices Market, By Product,2013–2019 (USD MN)
Figure 51 Malaysian Imaging Techniques Market, By Product, 2013–2019 (USD MN)
Figure 52 Malaysian Dermatoscopes Market, By Product, 2013–2019 (USD MN)
Figure 53 Indonesian Dermatology Diagnostic Devices Market, 2014 & 2019
Figure 54 Indonesian Dermatology Diagnostic Devices Market,2014 Vs 2019 (USD MN)
Figure 55 Indonesian Dermatology Diagnostic Devices Market, By Product,2013–2019 (USD MN)
Figure 56 Indonesian Imaging Techniques Market, By Product, 2013–2019 (USD MN)
Figure 57 Indonesian Dermatoscopes Market, By Product, 2013–2019 (USD MN)
Figure 58 Rest of Asia (RoA) Dermatology Diagnostic Devices Market, 2014 & 2019
Figure 59 Rest of Asia (RoA) Dermatology Diagnostic Devices Market,2014 Vs 2019 (USD MN)
Figure 60 Rest of Asia (RoA) Dermatology Diagnostic Devices Market, By Product, 2013–2019 (USD MN)
Figure 61 Rest of Asia (RoA) Imaging Techniques Market, By Product,2013–2019 (USD MN)
Figure 62 Rest of Asia (RoA) Dermatoscopes Market, By Product, 2013–2019 (USD MN)
Figure 63 Asian Dermatology Diagnostic Devices: Company Share Analysis, 2014 (%)
In this report, the market has been segmented based on products, end users, and geography. Products include imaging techniques, dermatoscopes, and microscopes. The end-user segments include hospitals and clinics. The geographies covered are China, Japan, India, Korea, Singapore, Malaysia, Indonesia, and the Rest of Asia (RoA). The RoA segment covers Taiwan, Mauritius, Vietnam, and the Philippines, among others. The study is based on primary and secondary research, and analyzes the market based on patents, product sales, and the competitive scenario. It also studies and analyzes trends and opportunities in the market.
The incidences of various skin disorders, such as melanoma, psoriasis, vascular lesions, and acne, are rising. Melanoma, of these, is a cancer of the skin that is easily visible to the naked eye. However, the challenge lies in recognizing early symptoms so that the appropriate treatment can be initiated before the tumor reaches a thickness of 0.76 mm, which can be fatal. In recent years, there has been a significant increase in the demand for various procedures and surgeries for the treatment of skin ailments. Various sophisticated diagnostic instruments, such as dermatoscopes, OCT scanners, and handheld scanners, allow for the early detection of melanoma, thereby improving survival rates and reducing the number of biopsies in the future, the associated morbidity, and the cost of treatment. Quantitative Thermographic Imaging (QTI), Confocal Microscopy, and Optical Coherence Tomography (OCT) have revolutionized diagnostics.
In 2014, the Asian dermatology diagnostic devices market was valued at $97.6 million. The market is expected to reach $133.3 million by 2019, at a CAGR of 6.4% from 2014 to 2019. The demand for dermatology diagnostic devices in emerging countries is expected to rise due to factors such as increasing awareness among surgeons and the price-sensitive nature of the market. Major players in the dermatology diagnostic devices market are facing tough competition from low-cost manufacturers in China and Italy, as these manufacturers offer devices at prices 60% to 70% lower than those of other players. For instance, in October 2014, U.S.-based Cynosure, Inc., a provider of low-cost devices, reported that in its third-quarter revenue of $71.5 million, the revenue from Asian subsidiaries had increased to 46.0% over the previous quarter.
The major players in the dermatology diagnostic devices market include Heine Optotechnik (Germany), Optomed Oy (Finland), FotoFinder Systems (Germany), Michelson Diagnostics (U.K.), GE Healthcare (U.K.), Philips Healthcare (Netherlands), Welch Allyn (U.S.), Carl Zeiss Meditec, Inc. (U.S.), Hitachi (Japan), Leica Microsystems (Germany), Olympus (Japan), Toshiba Medical Systems (Japan), and Siemens Medical Systems (Germany).
Please visit https://www.micromarketmonitor.com/custom-research-services.html to specify your custom Research Requirement
| PRODUCT TITLE | PUBLISHED | |
|---|---|---|
|
|
Asia Dermatology Devices The report also provides the strategic analysis of the key players in this market. Based on product types, the Asian dermatology devices market has been segmented into dermatology treatment devices and dermatology diagnostic devices, wherein the dermatology treatment devices segment dominates the market, having accounted for a 94.6% of the overall market share in 2014. On the basis of end-users, the dermatology devices market is categorized into hospitals and clinics. |
Feb 2015 |
|
|
North America Dermatology Devices The major factors driving the demand for dermatological devices in the U.S. are the desire for youthful appearance, increasing incidence rates of skin diseases, increasing trend towards non-invasive aesthetic procedures, and technological advancements. People are becoming more conscious about their appearance and are aware of the skin disorders caused due to exposure to the sun. |
Feb 2015 |


