

North America Drilling and Completion Fluids Market by Type (Water Based, Synthetic Based, Oil Based & others), By Application (onshore & Offshore), By Countries - Regional Trend & Forecast to 2019
- Publish Date: Apr 2015


The North America drilling and completion fluids market is directly dependent on drilling activities carried out across the globe. The recent increase in oilfield discoveries and rise in drilling activities are expected to drive this market in the next five years. Increasing drilling and exploration activities for shale and other resources has led to widespread consumption of drilling fluids, which forms one of the reasons for the growth of the drilling and completion fluids market in North America.
In North America, drilling and completion fluids use different base fluids such as water-based system, oil-based system, synthetic-based system, and others. Out of these, the water-based segment holds more than half of the total drilling and completion fluids market in North America.
The use of a particular drilling fluid base depends on the cost of the fluid, the desired performance, and environmental impact. In addition, growing world energy demand and rise in population are creating pressure to drill at high depths and enter deep and ultra-deepwaters. These factors have been the major drivers of the North America drilling and completion fluids market.
The U.S. is leading the North America drilling and completion fluids market as maximum drilling and exploration activities are taking place in the U.S. The U.S. is the market leader in the North America oil & gas sector, and onshore drilling activities are on a continuous rise, providing opportunities to key players. After the U.S., Canada holds the remaining share in the North America drilling and completion fluids market, and is projected to grow at a CAGR of 4.8% during the forecasted period.
Scope of the Report
The report focuses on drilling and completion fluids used in onshore and offshore application areas. The segmentation followed in the report has been listed below.
On the basis of application
- Onshore
- Offshore
On the basis of type
- Water-based system
- Oil-based system
- Synthetic-based system
- Others
On the basis of country
- U.S.
- Canada
Table of Contents
1 Introduction (Page No. - 9)
1.1 Objectives of the Study
1.2 Market Segmentation and Coverage
1.3 Stakeholders
2 Research Methodology (Page No. - 11)
2.1 Integrated Ecosystem of the North America Drilling and Completion Fluids Market
2.2 Arriving at the North America Drilling and Completion Fluids Market Value
2.2.1 Top-Down Approach
2.2.2 Bottom-Up Approach
2.2.3 Demand Side Approach
2.2.4 Macro Indicator-Based Approach
2.3 Assumptions
3 Executive Summary (Page No. - 18)
4 Market Overview (Page No. - 20)
4.1 Introduction
4.2 North America Drilling and Completion Fluids Market: Comparison With Parent Market
4.3 Market Drivers and Inhibitors
4.4 Key Market Dynamics
4.5 Demand Side Analysis
5 North America Drilling and Completion Fluids Market, By Application (Page No. - 25)
5.1 Introduction
5.2 North America Onshore Drilling and Completion Fluids Market,By Country, 2013 - 2019 (USD MN)
5.3 North America Offshore Drilling and Completion Fluids Market,By Country, 2013 - 2019 (USD MN)
5.4 Sneak View: North America Drilling and Completion Fluids Market,By Application
6 North America Drilling and Completion Fluids Market, By Type (Page No. - 30)
6.1 Introduction
6.2 North America Water-Based Drilling and Comp0letion Fluids Market,By Country
6.3 North America Oil-Based Drilling and Completion Fluids Market,By Country
6.4 North America Synthetic-Based Drilling and Completion Fluids Market, By Country
7 Drilling and Completion Fluids Market, By Country (Page No. - 35)
7.1 Introduction
7.2 U.S. Drilling and Completion Fluids Market
7.2.1 U.S. Drilling and Completion Fluids Market, By Application
7.2.2 U.S. Drilling and Completion Fluids Market, By Type
7.3 Canada Drilling and Completion Fluids Market
7.3.1 Canada Drilling and Completion Fluids Market, By Application
7.3.2 Canada Drilling and Completion Fluids Market, By Type
8 North America Drilling and Completion Fluids Market: Competitive Landscape (Page No. - 44)
8.1 North America Drilling and Completion Fluids Market: Company Share Analysis
8.2 Mergers & Acquisitions
8.3 Expansion
8.4 New Product/Service Developments
8.5 Contracts/Agreements
8.6 Others (Divestments/Joint Ventures)
9 Company Profiles (Page No. - 50)
(Overview, Financials, Products & Services, Strategy, And Developments)*
9.1 M-I Swaco
9.2 Halliburton
9.3 Baker Hughes
9.4 Newpark Resources Inc.
9.5 Tetra Technologies Inc.
9.6 Weatherford International Ltd.
9.7 National Oilwell Varco Ltd.
*Details On Overview, Financials, Product & Services, Strategy, And Developments Might Not Be Captured In Case Of Unlisted Company
10 Appendix (Page No. - 72)
10.1 Introducing RT: Real-Time Market Intelligence
10.1.1 RT Snapshots
10.2 Related Reports
List of Tables (46 Tables)
Table 1 North America Drilling and Completion Fluids Market, By Application, 2013 (USD MN)
Table 2 North America Drilling and Completion Fluids Market: Macro Indicators, By Country, Number of Wells, 2013
Table 3 North America Drilling and Completion Fluids Market: Comparison With Parent Market, 2013 – 2019 (USD MN)
Table 4 North America Drilling and Completion Fluids Market: Drivers and Inhibitors
Table 5 North America Drilling and Completion Fluids Market, By Type,2013 - 2019 (USD MN)
Table 6 North America Drilling and Completion Fluids Market, By Country,2013 - 2019 (USD MN)
Table 7 North America Drilling and Completion Fluids Market: By Application, 2013 - 2019 (USD MN)
Table 8 North America Drilling and Completion Fluids Market, By Application, 2013 - 2019 (USD MN)
Table 9 North America Onshore Drilling and Completion Fluids Market,By Country, 2013 - 2019 (USD MN)
Table 10 North America Offshore Drilling and Completion Fluids Market,By Country, 2013 - 2019 (USD MN)
Table 11 North America Drilling and Completion Fluids Market, By Type,2013 - 2019 (USD MN)
Table 12 North America Water-Based Drilling and Completion Fluids Market,By Country, 2013–2019 (USD MN)
Table 13 North America Oil-Based Drilling and Completion Fluids Market,By Country, 2013 - 2019 (USD MN)
Table 14 North America Synthetic-Based Drilling and Completion Fluids Market, By Country, 2013 - 2019 (USD MN)
Table 15 North America Drilling and Completion Fluids Market, By Country,2013-2019 (USD MN)
Table 16 U.S. Drilling and Completion Fluids Market, By Application,2013-2019 (USD MN)
Table 17 U.S. Drilling and Completion Fluids Market, By Type, 2013- 2019 (USD MN)
Table 18 Canada Drilling and Completion Fluids Market, By Application,2013 - 2019 (USD MN)
Table 19 Canada Drilling and Completion Fluids Market, By Type,2013 - 2019 (USD MN)
Table 20 Drilling and Completion Fluids Market: Company Share Analysis, 2013
Table 21 North America Drilling and Completion Fluids Market: Mergers & Acquisitions
Table 22 North America Drilling and Completion Fluids Market: Expansion
Table 23 North America Drilling and Completion Fluids Market: New Product/Service Developments
Table 24 North America Drilling and Completion Fluids Market: Contracts/Agreements
Table 25 North America Drilling and Completion Fluids Market: Divestments/Joint Ventures
Table 26 Schlumberger : Key Financials, 2009 - 2013 (USD MN)
Table 27 Net Sales, By Business Segment, 2010-2013 (USD MN)
Table 28 Net Sales, By Geographical Segment, 2009-2013 (USD MN)
Table 29 Halliburton: Key Financials, 2009 - 2013 (USD MN)
Table 30 Net Sales, By Business Segment, 2009-2013 (USD MN)
Table 31 Net Sales, By Geographical Segment, 2009-2013 (USD MN)
Table 32 Baker Hughes : Key Financials, 2009 - 2013 (USD MN)
Table 33 Net Sales, By Business Segment, 2009-2013 (USD MN)
Table 34 Net Sales, By Geographical Segment, 2009-2013 (USD MN)
Table 35 Newpark Resources Inc.: Key Financials, 2009 - 2013 (USD MN)
Table 36 Net Sales, By Business Segment, 2009-2013 (USD MN)
Table 37 Net Sales, By Geographical Segment, 2009-2013 (USD MN)
Table 38 Tetra Technologies Inc.: Key Financials, 2009 - 2013 (USD MN)
Table 39 Net Sales, By Business Segment, 2009-2013 (USD MN)
Table 40 Net Sales, By Geographical Segments, 2009-2013 (USD MN)
Table 41 Weatherford: Key Financials, 2009 - 2013 (USD MN)
Table 42 Net Sales, By Business Segment, 2009-2013 (USD MN)
Table 43 Net Sales, By Geographical Segment, 2009-2013 (USD MN)
Table 44 National Oilwell Varco.: Key Financials, 2009 - 2013 (USD MN)
Table 45 Net Sales, By Business Segment, 2009-2013 (USD MN)
Table 46 Net Sales, By Geographical Segments, 2009-2013 (USD MN)
List of Figures (36 Figures)
Figure 1 North America Drilling and Completion Fluids Market: Segmentation and Coverage
Figure 2 North America Drilling and Completion Fluids Market: Integrated Ecosystem
Figure 3 Research Methodology
Figure 4 Top-Down Approach
Figure 5 Bottom-Up Approach
Figure 6 Demand Side Approach
Figure 7 Macro Indicator-Based Approach: Number of Wells (2013)
Figure 8 North America Drilling and Completion Fluid Market Snapshot
Figure 9 North America Drilling and Completion Fluids Market, By Type,2013 (USD MN)
Figure 10 North America Drilling and Completion Fluids Market,By Application, 2014 & 2019 (USD MN)
Figure 11 North America Onshore Drilling and Completion Fluids Market,By Country, 2013 - 2019 (USD MN)
Figure 12 North America Offshore Drilling and Completion Fluids Market,By Country, 2013 - 2019 (USD MN)
Figure 13 Sneak View: North America Drilling and Completion Fluids Market
Figure 14 North America Drilling and Completion Fluids Market,By Type, 2014 & 2019 (USD MN)
Figure 15 North America Water-Based Drilling and Completion Fluids Market,By Country, 2013–2019 (USD MN)
Figure 16 North America Oil-Based Drilling and Completion Fluids Market,By Country, 2013 - 2019 (USD MN)
Figure 17 North America Synthetic-Based Drilling and Completion Fluids Market, By Country, 2013 - 2019 (USD MN)
Figure 18 North America Drilling and Completion Fluids Market: Growth Analysis, By Country, 2014 & 2019 (USD MN)
Figure 19 U.S. Drilling and Completion Fluids Market Overview, 2014 & 2019
Figure 20 U.S. Drilling and Completion Fluids Market, By Application,2013-2019 (USD MN)
Figure 21 U.S. Drilling and Completion Fluids Market: Application Snapshot
Figure 22 U.S. Drilling and Completion Fluids Market, By Type, 2013- 2019 (USD MN)
Figure 23 U.S. Drilling and Completion Fluids Market Share (Value),By Type, 2014 & 2019 (%)
Figure 24 Canada Drilling and Completion Fluids Market Overview,2014 & 2019
Figure 25 Canada Drilling and Completion Fluids Market, By Application,2013-2019 (USD MN)
Figure 26 Canada Drilling and Completion Fluids Market: Application Snapshot
Figure 27 Canada Drilling and Completion Fluids Market, By Type,2013- 2019 (USD MN)
Figure 28 Canada Drilling and Completion Fluids Market Share (Value),By Type, 2014 & 2019 (%)
Figure 29 North America Drilling and Completion Fluids Market: Company Share Analysis, 2013
Figure 30 Schlumberger Revenue Mix, 2013
Figure 31 Halliburton Revenue Mix, 2013
Figure 32 Baker Hughes Revenue Mix, 2013
Figure 33 Newpark Resources Inc. Revenue Mix, 2013
Figure 34 Tetra Technologies Inc. Revenue Mix, 2013 (%)
Figure 35 Weatherford Revenue Mix, 2013
Figure 36 Tetra Technologies Inc. Revenue Mix, 2013
Drilling and completion fluids serve various purposes, including removal of cuttings from wellbore, suspend and release cuttings, counterbalance the formation pressure, seal permeable formations, maintain wellbore stability, minimize formation damages, work as a coolant and lubricant for drilling bit, transmit hydraulic energy to drill bit, and control corrosion of an equipment. The North America drilling and completion fluids market is growing due to increase in energy demand, environmental concerns, and exploration of hydrocarbons in new frontiers.
The drilling and completion fluids market is growing all over the world, and the same trend has been forecast for the next five years in North America. The North America market has been segmented on the basis of application, type, and country. The onshore application held the maximum market share i; however, the offshore application is expected to grow at a higher CAGR of 5.4% during the forecast period. The reason for a higher growth rate is the increase in deepwater and ultra-deepwater exploration activities.
The majority of drilling and exploration activities are carried out in the U.S. and Canada. The water-based system segment captures the major market share, followed by oil and synthetic-based systems, respectively. The water-based drilling fluid system accounts for 60% of the drilling and completion fluids market.
Growing drilling activities, increase in oil production, and technological developments are driving the North America market. However, environmental concerns, stringent government regulations, and shortage of professionals are the major challenges faced by the market players. North America has been very conscious about its environment, and thus, strict environmental regulations are also a major challenge.
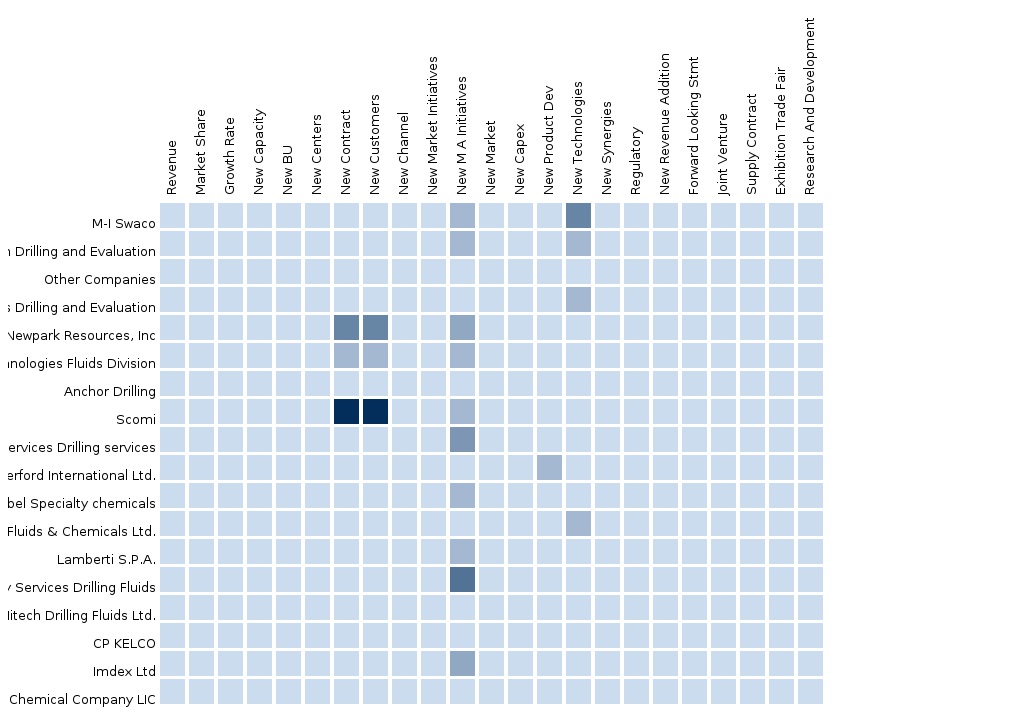
In the North America market, leading players are adopting strategies such as innovations, R&D investments, agreements, collaborations, joint ventures, and expansions. Collaborations, investments, and agreements with research institutes and oil & gas universities for technological innovation have been adopted by players to retain their position in the market. Innovation and R&D have been the key adopted strategies, aiding companies in enhancing their market position, providing cost-effective technologies, and providing a competitive edge.
M-I SWACO, Halliburton, Baker Hughes Inc., Weatherford International Ltd. are key players in the North America drilling and completion fluids market. All key players have also been focusing on innovating and developing their existing product lines, which is also their major expansion strategy.
Please visit https://www.micromarketmonitor.com/custom-research-services.html to specify your custom Research Requirement


