

Middle East Drilling Waste Management Market by Service (Solid Control, Containment & Handling, Treatment & Disposal), by Application (Onshore, Offshore ), by Country - Analysis and Forecast to 2019
- Publish Date: Mar 2015


Waste management activities are critical for drilling and production operations. Suitable application of waste management principles is essential for environmental protection. The largest potential waste stream includes used drilling fluids and cuttings that are produced while drilling the well.
Factors which drive the drilling waste management market in Middle East are high E&P activities, stringent government regulations, increasing investments from oil & gas operators, and a surge in offshore activities to meet the energy requirements. The Middle East drilling waste management services market is projected to reach $341.1 million by 2019, at a CAGR of 3.0% between 2014 and 2019.
The Middle East market is expected to witness stable growth in near future, supported by various government guiding principles for effective management of drilling wastes. Oman is estimated to have the largest market share, followed by Saudi Arabia and Kuwait in 2019.
The report highlights the market forecast for various segments and also describes some of the important dynamics, such as drivers, restraints, opportunities, and challenges in the drilling waste management market.
The drilling waste management market analyzed in this report is based on the waste management hierarchy, that is, solid control, containment & handling, and treatment & disposal. The application areas covered in this report are onshore and offshore areas.
To provide an in-depth understanding of the competitive landscape, the report includes profiles of some of the leading drilling waste market participants, which combines manufacturers as well as service providers, such as Schlumberger (U.S.), National Oilwell Varco (U.S.), Halliburton (U.S.), Secure Energy services (Canada), Scomi Group BHD (Malaysia), and Baker Hughes (U.S.).
Table of Contents
1 Introduction (Page No. - 9)
1.1 Objectives of the Study
1.2 Market Segmentation & Coverage
1.3 Stakeholders
2 Research Methodology (Page No. - 13)
2.1 Integrated Ecosystem of Drilling Waste Management Market
2.2 Arriving at the Drilling Waste Managementmarket Size
2.2.1 Top-Down Approach
2.2.2 Bottom-Up Approach
2.2.3 Demand Side Approach
2.2.4 Macro Indicator-Based Approach
2.3 Assumptions
3 Executive Summary (Page No. - 20)
4 Market Overview (Page No. - 22)
4.1 Introduction
4.2 Drilling Waste Management Market: Comparison With Parent Market
4.3 Market Drivers and Inhibitors
4.4 Key Market Dynamics
4.5 Demand Side Analysis
5 Middle East Drilling Waste Management Market, By Application (Page No. - 31)
5.1 Introduction
5.2 Demand Side Analysis
5.3 Middle-East Drilling Waste Management In Onshore, By Geography
5.4 Middle-East Drilling Waste Management In Offshore, By Country
6 Middle East Drilling Waste Management Market, By Services (Page No. - 37)
6.1 Introduction
6.2 Middle-East Drilling Waste Management Market, Services Comparison With Drilling Services Market
6.3 Middle-East Treatment and Disposal Market, By Country
6.4 Middle East Solid Control Services Market, By Geography
6.5 Middle East Containment and Handling Market, By Country
7 Middle East Drilling Waste Management Market, By Geography (Page No. - 44)
7.1 Introduction
7.2 Saudi Arabia Drilling Wsate Management Market
7.2.1 Saudi Arabia Drilling Waste Management Market, By Application
7.2.2 Saudi Arabia Drilling Waste Management Market, By Services
7.3 Oman Drilling Waste Management Market
7.3.1 Oman Drilling Waste Management Market, By Application
7.3.2 Oman Drilling Waste Management Market, By Services
7.4 Kuwait Drilling Waste Management Market
7.4.1 Kuwait Drilling Waste Management Market, By Application
7.4.2 Kuwait Drilling Waste Management Market, By Service
7.5 Qatar Drilling Waste Management Market
7.5.1 Qatar Drilling Waste Management Market, By Application
7.5.2 Qatar Drilling Waste Management Market, By Services
7.6 Abu Dhabi Drilling Waste Management Market
7.6.1 Abu Dhabi Drilling Waste Management Market, By Application
7.6.2 Abu Dhabi Drilling Waste Management Market, By Service
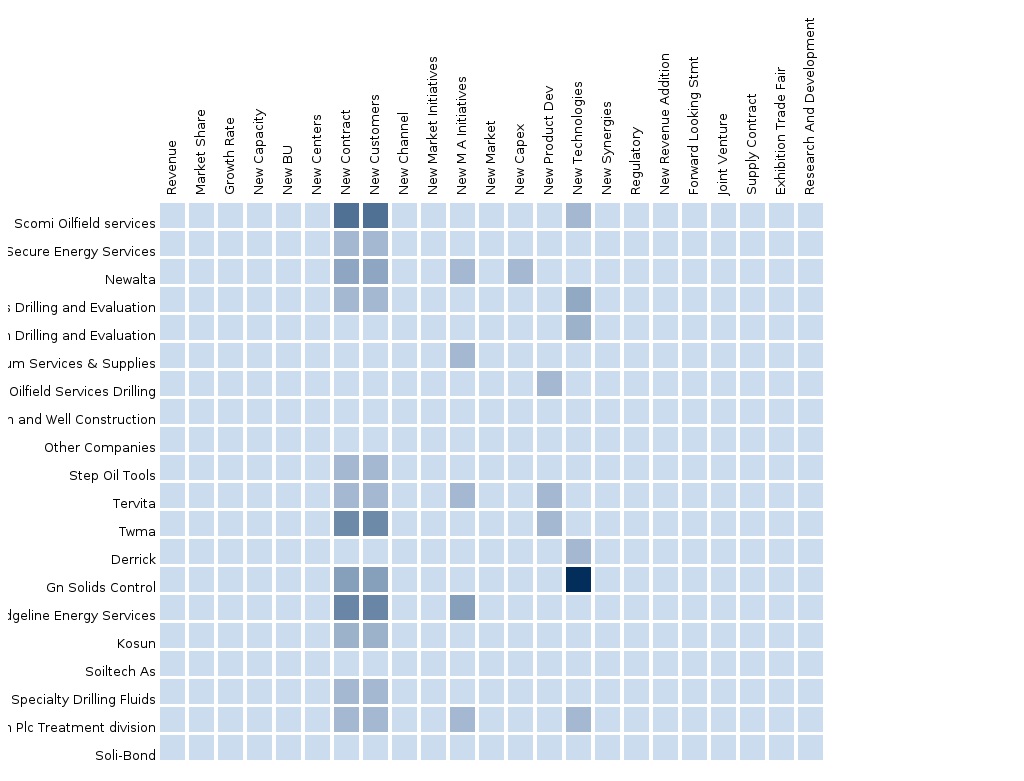
8 Middle East Drilling Waste Management Market: Competitive Landscape (Page No. - 68)
8.1 Drilling Waste Management Market: Company Share Analysis
8.2 Mergers & Acquisitions
8.3 New Contracts
8.4 Agreements
8.5 New Product/Service Launches
8.6 Other Expansions
9 Middle East Drilling Waste Management Market, By Company (Page No. - 75)
9.1 Halliburton Co.
9.1.1 Overview
9.1.2 Key Financials
9.1.3 Product and Service Offerings
9.1.4 Related Developments
9.2 Imdex Limited.
9.2.1 Overview
9.2.2 Key Operations Data
9.2.3 Key Financials
9.2.4 Product and Service Offerings
9.2.5 Related Developments
9.3 Schlumberger
9.3.1 Overview
9.3.2 Key Operations Data
9.3.3 Product and Service Offerings
9.3.4 Related Developments
9.4 Baker Hughes
9.4.1 Overview
9.4.2 Key Financials
9.4.3 Product and Service Offerings
9.4.4 Related Developments
9.5 Weatherford International
9.5.1 Overview
9.5.2 Key Operations Data
9.5.3 Product and Service Offerings
9.5.4 Related Developments
9.6 National Oilwell Varco, Inc.
9.6.1 Overview
9.6.2 Key Operations Data
9.6.3 Product and Service Offerings
9.6.4 Related Developments
9.7 TWMA
9.7.1 Overview
9.7.2 Key Operations Data
9.7.3 Product and Service Offerings
9.7.4 Related Developments
10. Appendix (Page No. - )
10.1 Customization Options
10.2 Related Reports
10.3 Introducing RT: Real Time Market Intelligence
10.3.1 RT Snapshots
List of Tables (52 Tables)
Table 1 Global Drilling Waste Management Market Size, 2013 (USD Million)
Table 2 Middle-East Drilling Waste Management Application Market, 2013 (USD Million)
Table 3 Middle-East Drilling Waste Management Market: Macro Indicators, By Geography, 2013
Table 4 Middle-East Drilling Waste Management Market: Comparison With Parent Market, 2013 – 2019 (USD MN)
Table 5 Middle-East Drilling Waste Management Market: Drivers and Inhibitors
Table 6 Middle-East Drilling Waste Management Market, By Application, 2013 - 2019 (USD MN)
Table 7 Middle-East Drilling Waste Management Market, By Services, 2013 - 2019 (USD MN)
Table 8 Middle-East Drilling Waste Management Market, By Geography, 2013 - 2019 (USD MN)
Table 9 Middle-East Drilling Waste Management Market: Comparison With Application Markets, 2013 - 2019 (USD MN)
Table 10 Middle-East Drilling Waste Management Market, By Application, 2013 - 2019 (USD MN)
Table 11 Middle-East Drilling Waste Management In Onshore, By Geography, 2013 - 2019 (USD MN)
Table 12 Middle-East Drilling Waste Management Market In Offshore, By Country, 2013 - 2019 (USD MN)
Table 13 Middle-East Drilling Waste Management Market, By Services, 2013 - 2019 (USD MN)
Table 14 Middle-East Drilling Waste Management Market:Services, Comparison With Drilling Services Market, 2013–2019 (USD MN)
Table 15 Middle East Treatment and Disposal Services, By Country, 2012–2018 (USD MN)
Table 16 Middle East Control Services Market, By Country, 2013-2019 (USD MN)
Table 17 Middle East Containment and Handling Market, By Country, 2013 - 2019 (USD MN)
Table 18 Middle East Drilling Wsate Management Market, By Geography, 2013 - 2019 (USD MN)
Table 19 Saudi Arabia Drilling Waste Management Market, By Application, 2013-2019 (USD MN)
Table 20 Saudi Arabia Drilling Waste Management, By Services, 2013 - 2019 (USD MN)
Table 21 Oman Drilling Waste Management Market, By Application, 2013 - 2019 (USD MN)
Table 22 Oman Drilling Waste Management Market, By Service, 2013 - 2019 (USD MN)
Table 23 Kuwait Drilling Waste Management Market, Market, By Application, 2013 - 2019 (USD MN)
Table 24 Kuwait Drilling Waste Management Market, By Service, 2013 - 2019 (USD MN)
Table 25 Qatar Drilling Waste Management Market, By Application, 2013 - 2019 (USD MN)
Table 26 Qatar Drilling Waste Management Market, By Service, 2013 - 2019 (USD MN)
Table 27 Abu Dhabi Drilling Waste Management Market, By Application, 2013 - 2019 (USD MN)
Table 28 Abu Dhabi Drilling Waste Management Market, By Service, 2013 - 2019 (USD MN)
Table 29 Middle East Drilling Waste Management Market: Company Share Analysis, 2013 (%)
Table 30 Middle-East Drilling Waste Management Market: Mergers & Acquisitions
Table 31 Middle-East Drilling Waste Management Market: New Contracts
Table 32 Middle-East Drilling Waste Management Market: Agreements
Table 33 Middle-East Drilling Waste Management Market: New Product/Service Launches
Table 34 Middle-East Drilling Waste Management Market: Other Expansions
Table 35 Halliburton Co., Key Financials, 2009 - 2013 (USD MN)
Table 36 Halliburton Co.: Net Sales, By Business Segment, 2009-2013 (USD Million)
Table 37 Halliburton Co.: Net Sales, By Geographical Segment, 2009-2013 (USD Million)
Table 38 Imdex Limited, Inc.: Key Financials, 2010 - 2014 (USD MN)
Table 39 Imdex Limited, Inc.: Net Sales, By Business Segment, 2010-2014 (USD Million)
Table 40 Imdex Limited, Inc.: Net Sales, By Geographical Segment, 2010-2014 (USD Million)
Table 41 Schlumberger, Key Operations Data, 2009 - 2013 (USD MN)
Table 42 Schlumberger: Net Sales, By Business Segment, 2009-2013 (USD Million)
Table 43 Schlumberger: Net Sales, By Geographical Segment, 2010-2014 (USD Million)
Table 44 Baker Hughes. Key Operations Data,2009 - 2013 (USD MN)
Table 45 Baker Hughes: Net Sales, By Business Segment, 2009-2013 (USD Million)
Table 46 Baker Hughes: Net Sales, By Geographical Segment, 2009-2013 (USD Million)
Table 47 Weatherford. Key Operations Data,2009 - 2013 (USD MN)
Table 48 Weatherford: Net Sales, By Business Segment, 2009-2013 (USD Million)
Table 49 Weatherford: Net Sales, By Geographical Segment, 2009-2013 (USD Million)
Table 50 National Oilwell Varco, Inc.: Key Operations Data,2009 - 2013 (USD MN)
Table 51 National Oilwell Varco, Inc.: Net Sales, By Business Segment, 2009-2013 (USD Million)
Table 52 National Oilwell Varco, Inc.: Net Sales, By Geographical Segment, 2009-2013 (USD Million)
List of Figures (52 Figures)
Figure 1 Middle-East Drilling Waste Management Market: Segmentation & Coverage
Figure 2 Drilling Waste Management Market: Integrated Ecosystem
Figure 3 Research Methodology
Figure 4 Top-Down Approach
Figure 5 Bottom-Up Approach
Figure 6 Demand Side Approach
Figure 7 Macro Indicator-Based Approach
Figure 8 Middle-East Drilling Waste Management Market Snapshot
Figure 9 Drilling Waste Management Market: Growth Aspects ,2013
Figure 10 Middle East Drilling Waste Management Services, By Country 2013 (USD MN)
Figure 11 Drilling Waste Management: Application Market Scenario
Figure 12 Middle-East Drilling Waste Management Market, By Application, 2014 - 2019 (USD MN)
Figure 13 Middle-East Drilling Waste Management Market In Onshore, By Country, 2013 - 2019 (USD MN)
Figure 14 Middle-East Drilling Waste Management In Offshore, By Country, 2013 - 2019 (USD MN)
Figure 15 Middle-East Drilling Waste Management Market, By Services, 2014 - 2019 (USD MN)
Figure 16 Middle-East Drilling Waste Management Market: Services Comparison With Middle East Drilling Services Market, 2013–2019 (USD MN)
Figure 17 Middle East Treatment and Disposal Market, By Country, 2013–2019 (USD MN)
Figure 18 Middle East Solid Control Services, By Country, , 2013 - 2019 (USD MN)
Figure 19 Middle East Containment and Handling Market, By Country, 2013 - 2019 (USD MN)
Figure 20 Middle-East Drilling Waste Management Market: Growth Analysis, By Geography, 2014-2019 (USD MN)
Figure 21 Saudi Arabia Drilling Waste Management Market Overview, 2014 & 2019 (%)
Figure 22 Saudi Arabia Drilling Waste Management Market, By Application, 2013-2019 (USD MN)
Figure 23 Saudi Arabia Drilling Waste Management Market: Application Snapshot
Figure 24 Saudi Arabia Drilling Wate Management Market, By Services, 2013 - 2019 (USD MN)
Figure 25 Saudi Arabia Drilling Waste Management Market Share, By Services, 2014-2019 (%)
Figure 26 Oman Drilling Waste Management Market Overview, 2014 & 2019 (%)
Figure 27 Oman Drilling Waste Management Market, By Application, 2013-2019 (USD MN)
Figure 28 Oman Drilling Wate Management Market: Application Snapshot
Figure 29 Oman Drilling Waste Management Market, By Services, 2013 - 2019 (USD MN)
Figure 30 Oman Drilling Waste Management Market Share, By Services, 2014 & 2019 (%)
Figure 31 Kuwait Drilling Waste Management Overview, 2014 & 2019 (%)
Figure 32 Kuwait Drilling Waste Management, By Application, 2014 - 2019 (USD MN)
Figure 33 Kuwait Drilling Waste Management Market: Application Snapshot
Figure 34 Kuwait Drilling Waste Management Market, By Service, 2013 - 2019 (USD MN)
Figure 35 Kuwait Drilling Waste Management Market: Services Snapshot,2014 & 2019
Figure 36 Qatar Drilling Waste Management Market Overview, 2014 & 2019 (%)
Figure 37 Qatar Drilling Waste Management Market, By Application, 2013-2019 (USD MN)
Figure 38 Qatar Drilling Wate Management Market: Application Snapshot
Figure 39 Qatar Drilling Waste Management Market, By Services, 2013 - 2019 (USD MN)
Figure 40 Qatar Drilling Waste Management Market Share, By Services, 2013-2019 (%)
Figure 41 Abu Dhabi Drilling Waste Management Overview, 2014 & 2019 (%)
Figure 42 Abu Dhabi Drilling Waste Management, By Application, 2013 - 2019 (USD MN)
Figure 43 Abu Dhabi Drilling Waste Management Market: Application Snapshot
Figure 44 Abu Dhabi Drilling Waste Management Market, By Service, 2013 - 2019 (USD MN)
Figure 45 Abu Dhabi Drilling Waste Management Market: Services Snapshot
Figure 46 Drilling Waste Management Market: Company Share Analysis, 2013 (%)
Figure 47 Halliburton Co.: Revenue Mix, 2013 (%)
Figure 48 Imdex Limited. Revenue Mix, 2013 (%)
Figure 49 Schlumberger Corporation Revenue Mix, 2013 (%)
Figure 50 Baker Hughes Revenue Mix, 2013 (%)
Figure 51 Weatherford, Revenue Mix, 2013 (%)
Figure 52 National Oilwell Varco, Inc: Revenue Mix 2013 (%)
Drilling processes in the oil & gas industry usually produce two primary types of wastes, drill cuttings and used drilling fluids. Most of these wastes associated with oil & gas drilling activities can cause significant hazards to the environment. Hence, to minimize the impact on the environment, these wastes need to be effectively treated and disposed. Globally, different countries have employed various regulatory measures to tackle this challenge. The methods used to store, mix-bury-cover, land-spread, and biodegrade drilling waste require extensive drilling waste management and significant land disturbance. The licensees using these methods are required to reclaim the affected sites.
The waste management hierarchy lays out a preferred methodology of waste management options. Source reduction is the first and most favored option. Recycling is the second preferred option in the waste management hierarchy. Treatment and disposal, at the bottom of the hierarchy, is the least preferred options in waste management. Globally, oil & gas operators follow a three-tier waste management hierarchy to control and manage drilling wastes in the most eco-friendly manner possible.
In recent years, high growth has been observed in drilling waste management due to increasing environmental concerns and regulatory norms imposed by the government. Key services include solids control, containment & handling, and treatment & disposal activities for safe discharge of drilling waste generated.
The Middle East drilling waste management market is projected to reach $341.1 million by 2019, registering a growth rate of 3.0% between 2014 and 2019.
In the Middle East drilling waste management market, a significant portion of the services is being consumed in the Oman due to large number of offshore wells, unconventional resources development activities, and exploration activities. Saudi Arabia market holds the second position and its growth is high due to stringent government regulations and also due to presence of key players of the oil & gas industry. These players invest substantially in the drilling industry due to the presence of the potential reserves.
Strict environmental regulations are forcing the operators to implement effective waste management practices and treatments methods. The ongoing and upcoming developments in offshore drilling and upcoming shale exploration and production activities are high opportunity areas for the drilling waste management service market.
The market has been studied for different countries, such as Saudi Arabia, Oman, Qatar, Abu Dhabi, and Kuwait. The market size for drilling waste management services is analyzed in detail for these countries. The study covers different strategies adopted by the market players, such as new product launches, contract agreements, equipment supply, mergers & acquisitions, geographic expansions, and others. Schlumberger (U.S.), National Oilwell Varco (U.S.), Halliburton (U.S.), and Baker Hughes (U.S.), are the leading players in this regional market.
Please visit https://www.micromarketmonitor.com/custom-research-services.html to specify your custom Research Requirement
| PRODUCT TITLE | PUBLISHED | |
|---|---|---|
|
|
North America Drilling Services Drilling Services-North America market is expected to grow at a CAGR of 10.5% from 2014 to 2019. |
Apr 2015 |
|
|
South & Central America Drilling Services South & Central American drilling Services market is expected to grow at a CAGR of 11.7% from 2014 to 2019. |
Apr 2015 |
|
|
Middle East Drilling Services Middle East drilling Services market is expected to grow at a CAGR of 8.9% from 2014 to 2019. |
Apr 2015 |
|
|
Africa Drilling Services African drilling Services market is expected to grow at a CAGR of 11.7% from 2014 to 2019. |
Apr 2015 |
|
|
Europe Drilling Services European drilling Services market is expected to grow at a CAGR of 9.5% from 2014 to 2019. |
Apr 2015 |
|
|
Asia-Pacific Drilling Services The purpose of this report is to cover the definition, description, and forecast of the Asia-Pacific drilling services market. It involves a deep dive analysis of the market segmentation, which is based on application, service, and country. The report also provides deep insights into the competitive landscape of the market through a strategic analysis of the key players of the market. |
May 2015 |


