

Middle East and Africa Defoaming Coating Additives Market
- Publish Date: Upcoming


Defoaming additives are used in paints & coatings in order to prevent the formation of foam during the application of these paints & coatings on any surface, thereby helping in the reduction of surface tension. The construction industry is the largest consumer of defoaming coating additives. With the easing of residential mortgages and the increase in disposable incomes of the population in the Middle East & Africa (MEA) region, the construction industry has grown dramatically in recent years. This is expected to drive the growth of the defoaming coating additives market significantly in the coming years.
The Middle East & Africa market accounted for a 4.05% share of the global defoaming coating additives market in 2013. The MEA market is expected to be the fastest-growing regional defoaming coating additives market, projected to grow at a CAGR of 9.2% from 2013 to 2018. Saudi Arabia and Qatar are the main contributors of the MEA market. In terms of application, the defoaming coating additives were majorly consumed by the construction segment, having accounted for a market share of 34.71% in 2013. The automotive paints segment in expected to be the fastest-growing application segment, projected to grow at a CAGR of 9.9% from 2013 to 2018.
The Middle East & North Africa (MENA) region has witnessed a dramatic growth in the construction industry in recent years, the growth rate surpassing that of the global construction industry. The industry is expected to grow the fastest in Qatar, as there have been huge investments for the development of rails, roads, water, and other infrastructure in the country, as part of the preparation for the 2022 FIFA World Cup. With this significant growth of the construction industry in the region, especially in Saudi Arabia, UAE, and Qatar, the demand for paints & coatings is set to increase considerably in the coming years. As a result, the market for defoaming coating additives is expected to grow in the MEA region. Some of the major companies contributing to this growth include Lubrizol Corporation (U.S.), The Dow Chemical Co. (U.S.), and Wacker Chemie AG (Germany), among others.
The MEA defoaming coating additives market report presents a detailed analysis of the segmentation of the concerned market. The MEA market has been segmented in terms of ingredients, applications, and the major countries in the region. Saudi Arabia, Qatar, and UAE, among others, are the main countries that have been considered for this extensive market analysis. Automotive paints, construction, bedding & furniture, and industrial applications, among others, are the major application verticals of defoaming coating additives. On the basis of ingredients, the MEA market has been segmented into metallic compounds, polyacrylamide, and polyurethane coatings. The market report also describes the competitive scenario in the market, along with the profiles of the top companies operational in the Middle East & Africa defoaming coating additives market.
1 Introduction
1.1 Objectives of the Study
1.2 Market Definition
1.3 Market Segmentation & Aspects Covered
1.4 Research Methodology
1.4.1 Assumptions (Market Size, Forecast)
2 Market Snapshot
3 Market Overview
3.1 Introduction
3.1.1 AVERAGE Selling PRICE
3.2 Drivers
3.2.1 Increasing Demand For Environment-Friendly Products
3.3 Restraints
3.3.1 Restraints Faced By The Paint And Coating Industries
3.3.2 Stringent Environmental Regulations
3.4 Support Data
3.4.1 Major Coating Additives Manufacturers
3.4.2 Application Of The Significant Raw Materials For Coating Additives
3.4.3 Desired Properties Of Additives For Specific Applications
3.4.4 UAE
3.4.5 Saudi Arabia
3.4.6 Oman
3.4.7 Qatar
4 Defoaming Coating Additives-Middle East and Africa, By Applications
4.1 Split By Geography
4.2 Construction-Middle East and Africa
4.2.1 Construction-Middle East and Africa, By Country
4.2.1.1 Construction-Saudi Arabia
4.2.1.2 Construction-Qatar
4.2.1.3 Construction-Middle East and Africa - UAE
4.2.1.4 Construction-Middle East and Africa - Other Countries
4.3 Middle East and Africa-Other Applications
4.3.1 Middle East and Africa-Other Applications, By Country
4.3.1.1 Middle East and Africa - UAE-Other Applications
4.3.1.2 Qatar-Other Applications
4.3.1.3 Saudi Arabia-Other Applications
4.3.1.4 Industrial Applications-Middle East and Africa
4.3.2 Industrial Applications-Middle East and Africa, By Country
4.3.2.1 Industrial Applications-Saudi Arabia
4.3.2.2 Industrial Applications-Qatar
4.3.2.3 Industrial Applications-Middle East and Africa - UAE
4.3.2.4 Industrial Applications-Middle East and Africa - Other Countries
4.4 Bedding & Furniture-Middle East and Africa
4.4.1 Bedding & Furniture-Middle East and Africa, By Country
4.4.1.1 Bedding & Furniture-Saudi Arabia
4.4.1.2 Bedding & Furniture-Qatar
4.4.1.3 Bedding & Furniture-Middle East and Africa - UAE
4.4.1.4 Bedding & Furniture-Middle East and Africa - Other Countries
4.5 Automotive Paints-Middle East and Africa
4.5.1 Automotive Paints-Middle East and Africa, By Country
4.5.1.1 Automotive Paints-Saudi Arabia
4.5.1.2 Automotive Paints-Qatar
4.5.1.3 Automotive Paints-Middle East and Africa - UAE
4.5.1.4 Automotive Paints-Middle East and Africa - Other Countries
5 Defoaming Coating Additives-Middle East and Africa, By Country
5.1 Saudi Arabia
5.1.1 Saudi Arabia, By Applications
5.1.1.1 Construction-Saudi Arabia
5.1.1.2 Saudi Arabia-Other Applications
5.1.1.3 Industrial Applications-Saudi Arabia
5.1.1.4 Bedding & Furniture-Saudi Arabia
5.1.1.5 Automotive Paints-Saudi Arabia
5.2 Qatar
5.2.1 Qatar, By Applications
5.2.1.1 Construction-Qatar
5.2.1.2 Qatar-Other Applications
5.2.1.3 Industrial Applications-Qatar
5.2.1.4 Bedding & Furniture-Qatar
5.2.1.5 Automotive Paints-Qatar
5.3 Middle East and Africa - UAE
5.3.1 Middle East and Africa - UAE, By Applications
5.3.1.1 Construction-Middle East and Africa - UAE
5.3.1.2 Middle East and Africa - UAE-Other Applications
5.3.1.3 Industrial Applications-Middle East and Africa - UAE
5.3.1.4 Bedding & Furniture-Middle East and Africa - UAE
5.3.1.5 Automotive Paints-Middle East and Africa - UAE
5.4 Middle East and Africa - Other Countries
5.4.1 Middle East and Africa - Other Countries, By Applications
5.4.1.1 Construction-Middle East and Africa - Other Countries
5.4.1.2 Industrial Applications-Middle East and Africa - Other Countries
5.4.1.3 Bedding & Furniture-Middle East and Africa - Other Countries
5.4.1.4 Automotive Paints-Middle East and Africa - Other Countries
6 Defoaming Coating Additives-Middle East and Africa, By Competetive landscape
6.1 Market Share Analysis ($ million)
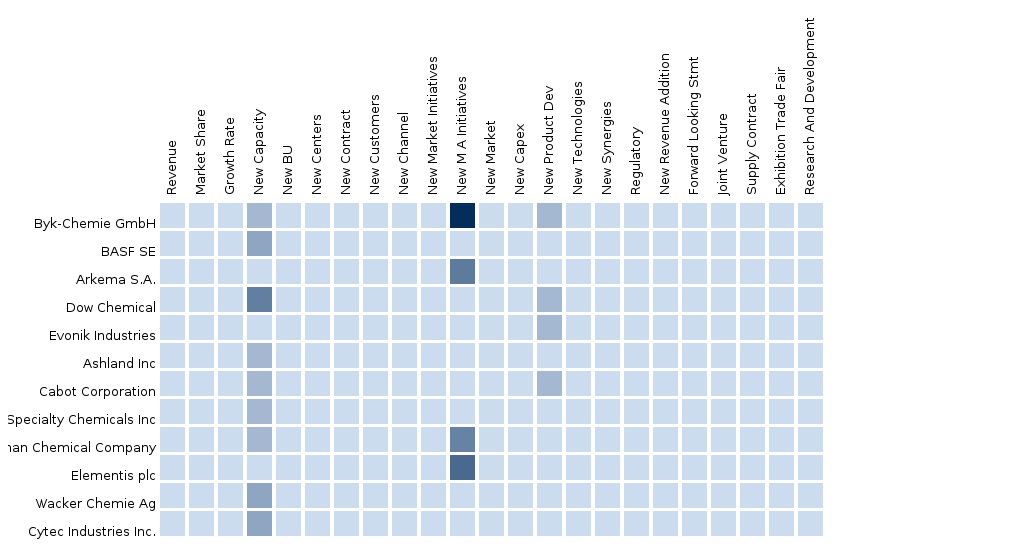
6.2 Developments
7 Defoaming Coating Additives Middle East and Africa, By Companies
7.1 Byk-Chemie Gmbh
7.1.1 Introduction
7.1.2 Product Portfolio
7.2 BASF SE
7.2.1 introduction
7.2.2 Product portfolio
7.2.3 Financials
7.3 DOW Chemical company
7.3.1 introduction
7.3.2 Product portfolio
7.3.3 Financials
7.4 Arkema
7.4.1 Introduction
7.4.2 Product Portfolio
7.4.3 Financials
7.5 Akzonobel N.V.
7.5.1 Introduction
7.5.2 Product Portfolio
7.5.3 Financials
7.6 Evonik
7.6.1 Introduction
7.6.2 Product Portfolio
7.6.3 Financials
7.7 Ashland Inc.
7.7.1 Introduction
7.7.2 Product portfolio
7.7.3 Financials
7.8 Daikin
7.8.1 introduction
7.8.2 Product portfolio
7.8.3 financials
7.9 Rhodia SA
7.9.1 Introduction
7.9.2 Product Portfolio
7.9.3 Financials
7.1 Momentive Specialty Chemicals
7.10.1 Introduction
7.10.2 Product Portfolio
7.10.3 Financials
8 Technology Updates
8.1 Development of multifunctional and environment-friendly additives
List of Tables
TABLE 1 Defoaming Coating Additives-Middle East and Africa market values, by Applications, 2012 – 2018 ($Thousand)
TABLE 2 Defoaming Coating Additives-Middle East and Africa market volume, by Applications, 2012 – 2018 (tons)
TABLE 3 Defoaming Coating Additives-Middle East and Africa market values, by Country, 2012 – 2018 ($Thousand)
TABLE 4 Defoaming Coating Additives-Middle East and Africa market volume, by Country, 2012 – 2018 (tons)
TABLE 5 Defoaming Coating Additives-Middle East and Africa market values, by Companies, 2012 – 2018 ($Thousand)
TABLE 6 Key manufacturers of coating additives
TABLE 7 Significant Raw materials & their APPLICATION
TABLE 8 Properties Controlled by Coating additives for major applications
TABLE 9 UAE Vehicle Sales 2009-2013
TABLE 10 UAE paints & coatings consumption ($million) 2009-2013
TABLE 11 UAE paints & coatings consumption, By type ($million) 2009-2016
TABLE 12 UAE paints & coatings consumption (KT) 2009-2013
TABLE 13 UAE paints & coatings consumption, By type (KT) 2009-2016
TABLE 14 Saudi Arabia vehicle Sales 2009-2013
TABLE 15 Saudi Arabia paints & coatings consumption ($million) 2009-2013
TABLE 16 Saudi Arabia paints & coatings consumption, By type ($million) 2009-2016
TABLE 17 Saudi Arabia paints & coatings consumption (KT) 2009-2013
TABLE 18 Saudi Arabia paints & coatings consumption, By type (KT) 2009-2016
TABLE 19 Oman vehicle Sales 2009-2013
TABLE 20 OMAN paints & coatings consumption ($million) 2009-2013
TABLE 21 OMAN paints & coatings consumption, By type ($million) 2009-2016
TABLE 22 OMAN paints & coatings consumption (KT) 2009-2013
TABLE 23 OMAN paints & coatings consumption, By type (KT) 2009-2016
TABLE 24 Qatar vehicle Sales 2009-2013
TABLE 25 Qatar paints & coatings consumption ($million) 2009-2013
TABLE 26 Qatar paints & coatings consumption, by type ($million) 2009-2016
TABLE 27 Qatar paints & coatings consumption (KT) 2009-2013
TABLE 28 Qatar paints & coatings consumption, by type (KT) 2009-2016
TABLE 29 Construction-Middle East and Africa by Country 2012 – 2018 ($Thousand)
TABLE 30 Construction-Middle East and Africa by Country 2012 – 2018 (tons)
TABLE 31 Middle East and Africa-Other Applications by Country 2012 – 2018 ($Thousand)
TABLE 32 Middle East and Africa-Other Applications by Country 2012 – 2018 (tons)
TABLE 33 Industrial Applications-Middle East and Africa by Country 2012 – 2018 ($Thousand)
TABLE 34 Industrial Applications-Middle East and Africa by Country 2012 – 2018 (tons)
TABLE 35 Bedding & Furniture-Middle East and Africa by Country 2012 – 2018 ($Thousand)
TABLE 36 Bedding & Furniture-Middle East and Africa by Country 2012 – 2018 (tons)
TABLE 37 Automotive Paints-Middle East and Africa by Country 2012 – 2018 ($Thousand)
TABLE 38 Automotive Paints-Middle East and Africa by Country 2012 – 2018 (tons)
TABLE 39 Saudi Arabia by Applications 2012 – 2018 ($Thousand)
TABLE 40 Saudi Arabia by Applications 2012 – 2018 (tons)
TABLE 41 Qatar by Applications 2012 – 2018 ($Thousand)
TABLE 42 Qatar by Applications 2012 – 2018 (tons)
TABLE 43 Middle East and Africa - UAE by Applications 2012 – 2018 ($Thousand)
TABLE 44 Middle East and Africa - UAE by Applications 2012 – 2018 (tons)
TABLE 45 Middle East and Africa - Other Countries by Applications 2012 – 2018 ($Thousand)
TABLE 46 Middle East and Africa - Other Countries by Applications 2012 – 2018 (tons)
TABLE 47 Merger and Acquisitions
TABLE 48 NEw Product Launch
TABLE 49 Expansion
TABLE 50 basf se: Annual Revenue, By Business Segments, 2011–2013 ($Million)
TABLE 51 basf: annual revenue By geographic Segments, 2011–2013 ($Million),
TABLE 52 Dow Chemical company: Annual Revenue, By Business Segments, 2011–2013 ($Million)
TABLE 53 Dow Chemical company: annual revenue By geographic Segments, 2011–2013 ($Million),
TABLE 54 Arkema: Annual Revenue, By Business Segments, 2011–2013 ($Million)
TABLE 55 Arkema: annual revenue By geographic Segments, 2011–2013 ($Million),
TABLE 56 AkzoNobel: Annual Revenue, By Business Segments, 2011–2012 ($Million)
TABLE 57 AkzoNobel: annual revenue By geographic region, 2011–2012 ($Million),
TABLE 58 Evonik: Annual Revenue, By Business Segments, 2010–2011 ($Million)
TABLE 59 Evonik: annual revenue By geographic Segments, 2010–2011 ($Million),
TABLE 60 Ashland: Annual Revenue, By Business Segments, 2011–2013 ($Million)
TABLE 61 Ashland: annual revenue By geographic region, 2011–2013 ($Million),
TABLE 62 Daikin: Annual Revenue, By Business Segments, 2011–2013 ($Million)
TABLE 63 Daikin: annual revenue By geographic Segments, 2011–2013 ($Million),
TABLE 64 Rhodia sa: Annual Revenue, By Business Segments, 2009–2011 ($Million)
TABLE 65 rhodia sa: annual revenue By geographic Segments, 2009–2013 ($Million),
TABLE 66 Momentive Specialty Chemicals: Annual Revenue, By Business Segments, 2011–2013 ($Million)
List of figures
FIGURE 1 Top Growing Defoaming Coating Additives-Middle East and Africa Markets By Revenue 2013 – 2018 ($million)
FIGURE 2 average selling price ($/ton)
FIGURE 3 Top Growing Defoaming Coating Additives-Construction-Middle East and Africa Markets By Revenue 2013 – 2018 ($million)
FIGURE 4 Top Growing Defoaming Coating Additives-Bedding & Furniture-Middle East and Africa Markets By Revenue 2013 – 2018 ($milLion)
FIGURE 5 Top Growing Defoaming Coating Additives-Automotive Paints-Middle East and Africa Markets By Revenue 2013 – 2018 ($million)
Please fill in the form below to receive a free copy of the Summary of this Report
Please visit https://www.micromarketmonitor.com/custom-research-services.html to specify your custom Research Requirement
| PRODUCT TITLE | PUBLISHED | |
|---|---|---|
|
|
South America Coating Additives The South American Coating Additives market is segmented based on Ingredients, Applications, Companies, and Functions. The Ingredients segment of this market includes Metallic Compounds, Polyacrylamide, Ingredients (Others), and Polyurethane Coating. The Applications segment includes Industrial Applications, Bedding & Furniture, Construction and Automotive Paints. The Companies segment includes Arkema S.A., Ashland Inc, BASF SE , Cytec Industries Inc., Dow Chemical, Eastman Chemical Company, Evonik Industries, Momentive Specialty Chemicals Inc, Clariant Chemicals, Omnova Solutions Inc., Byk-Chemie GmbH, Cabot Corporation, Elementis plc, Rhodia S.A., Lubrizol Corporation, Wacker Chemie Ag, Sun Chemical, AkzoNobel N.V., Daikin Industries, Ltd., and Asahi Kasei Chemicals Corporation. The Functions segment includes Wetting Agent, Dispersants, and Anti-Foaming Agents. |
Upcoming |
|
|
Europe Coating Additives Coating Additives-Europe can be segmented by Ingredients, Applications, Companies and Functions. Ingredients of this market are Metallic Compounds, |
Upcoming |
|
|
North America Coating Additives Coating Additives-North America can be segmented by Ingredients, Applications, Companies and Functions. Ingredients of this market are Metallic Compounds, |
Upcoming |
|
|
Asia-Pacific Coating Additives Coating Additives-Asia-Pacific can be segmented by Ingredients, Applications, Companies and Functions. Ingredients of this market are Metallic Compounds, |
Upcoming |


