

Latin America Drilling and Completion Fluids Market by Type (Water Based, Synthetic Based, Oil Based & others), By Application (Onshore & Offshore), By Countries - Regional Trend & Forecast to 2019
- Publish Date: Mar 2015


Drilling and completion fluids become a pivotal part of drilling and exploration activities. They are used to prevent the friction, provide lubrication, cool the well bore, and transport rock cuttings to the surface. Increase in drilling and exploration activities for shale and other resources has led to the widespread adoption of drilling fluids, which forms one of the major reasons for the growth of drilling fluid and completion fluid market in Latin America. Latin American countries such as Venezuela and Brazil, which are part of the Golden Triangle, are seeing tremendous growth in offshore drilling activities.
The Latin American drilling and completion fluids market was valued at $1,015 million in 2014, and is projected to reach $1,398.7 million by 2019, at a CAGR of 6.6% from 2014 to 2019. The Latin American drilling fluid and completion fluid market has been segmented into three fluid base types, namely water-based, oil-based, and synthetic-based among others. The water-based fluids system segment is expected to grow at a CAGR of 6.9% during the forecast period, as the usage of water-based fluids is cost effective and eco-friendly.
The application segment of drilling fluid and completion fluid market is divided into onshore and offshore. Among them, the onshore application segment is expected to drive the fluids market of Latin America during the forecast period.
Mexico, Brazil, Venezuela, and Argentina are countries considered for the analysis of drilling fluid and completion fluid market in Latin America. The Brazil drilling fluid and completion fluid market is expected to register the highest CAGR of 8.9%, followed by Mexico.
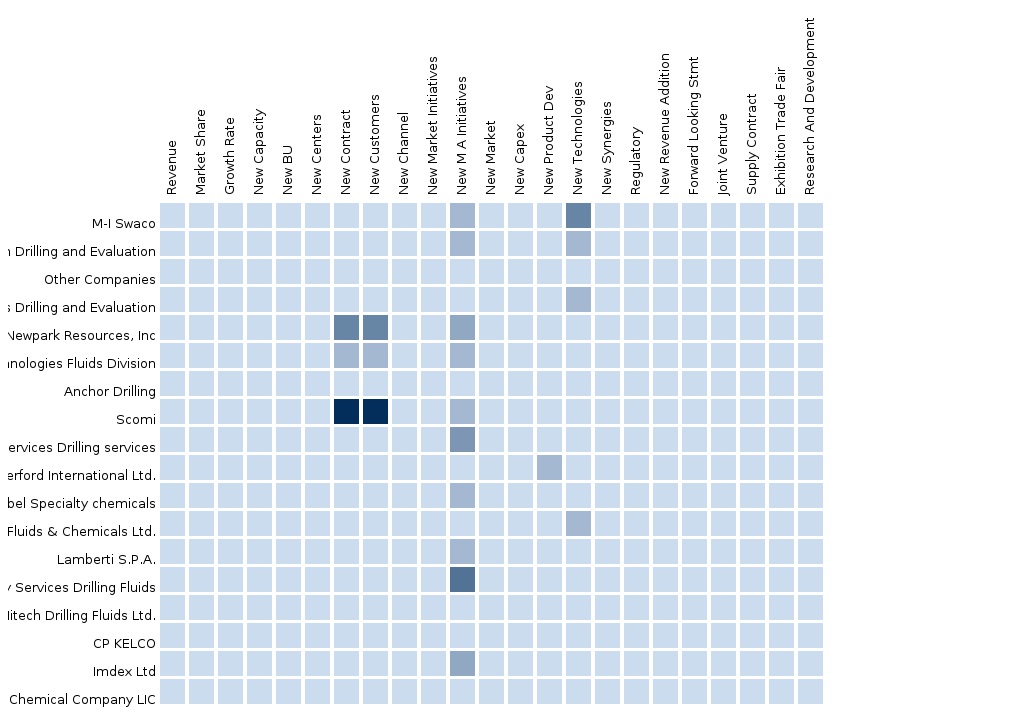
Several strategies have been adopted by market players of the drilling fluid and completion fluid market in Latin America. M-I Swaco, a wholly owned subsidiary of Schlumberger, accounted for the highest market share, followed by Halliburton (U.S.) and Baker Hughes (U.S.). New product launches, and contracts and agreements are considered as key growth strategies adopted by market players.
Scope of the report:
This research report categorizes the Latin American drilling fluid and completion fluid market into the following segment and sub-segments:
Drilling Fluid and Completion Fluid market in Latin America, By Type
- Water-based fluids system
- Oil-based fluids system
- Synthetic-based fluids system
- Other base fluids
Drilling Fluid and Completion Fluid market in Latin America, By Application
- Onshore
- Offshore
Drilling Fluid and Completion Fluid market in Latin America, By Country
- Mexico
- Brazil
- Venezuela
- Argentina
Table of Contents
1 Introduction (Page No. - 10)
1.1 Objectives of the Study
1.2 Market Segmentation & Coverage
1.3 Stakeholders
2 Research Methodology (Page No. - 12)
2.1 Integrated Ecosystem of the Latin America Drilling and Completion Fluids Market
2.2 Arriving at the Latin America Drilling and Completion Fluids Market
2.2.1 Top-Down Approach
2.2.2 Bottom-Up Approach
2.3 Demand Side Approach
2.3.1 Macro Indicator-Based Approach
2.4 Assumptions
3 Executive Summary (Page No. - 19)
4 Market Overview (Page No. - 21)
4.1 Introduction
4.2 Latin America Drilling and Completion Fluids Market: Comparison With Parent Market
4.3 Market Drivers and Inhibitors
4.4 Key Market Dynamics
4.5 Demand Side Analysis
5 Latin America Drilling and Completion Fluids Market, By Application (Page No. - 28)
5.1 Introduction
5.2 Latin America Onshore Drilling and Completion Fluids Market, By Country
5.3 Latin America Offshore Drilling and Completion Fluids Market, By Country
5.4 Sneak View: Latin America Drilling and Completion Fluids Market, By Application (2014 & 2019)
6 Latin America Drilling and Completion Fluids Market, By Type (Page No. - 33)
6.1 Introduction
6.2 Latin America Water-Based System Market, By Country
6.3 Latin America Oil-Based System Market, By Country
6.4 Latin America Synthetic-Based System Market, By Country
6.5 Sneak View: Drilling and Completion Fluids Market, By Type (2013)
7 Latin America Drilling and Completion Fluids Market, By Country (Page No. - 39)
7.1 Introduction
7.2 Mexico Drilling and Completion Fluids Market
7.2.1 Mexico Drilling and Completion Fluids Market, By Application
7.2.2 Mexico Drilling and Completion Fluids Market, By Type
7.3 Brazil Drilling and Completion Fluids Market
7.3.1 Brazil Drilling and Completion Fluids Market, By Application
7.3.2 Brazil Drilling and Completion Fluids Market, By Type
7.4 Venezuela Drilling and Completion Fluids Market
7.4.1 Venezuela Drilling and Completion Fluids Market, By Application
7.4.2 Venezuela Drilling and Completion Fluids Market, By Type
7.5 Argentina Drilling and Completion Fluids Market
7.5.1 Argentina Drilling and Completion Fluids Market, By Application
7.5.2 Argentina Drilling and Completion Fluids Market, By Type
8 Latin America Drilling and Completion Fluids Market: Competitive Landscape (Page No. - 55)
8.1 Latin America Drilling and Completion Fluids Market: Company Share Analysis
8.2 Company Presence In the Drilling and Completion Fluids Market, By Type
8.3 Mergers & Acquisitions
8.4 Expansions
8.5 New Product/Service Developments
8.6 Contracts/Agreements
8.7 Others
9 Drilling and Completion Fluids Market, By Company (Page No. - 61)
9.1 M-I Swaco
9.2 Halliburton
9.3 Baker Hughes
9.4 Newpark Resources Inc.
9.5 Tetra Technologies Inc.
9.6 Weatherford International Ltd.
9.7 National Oilwell Varco Ltd.
10 Appendix (Page No. - 84)
10.1 RT Snapshots
10.2 Related Reports
List of Tables (53 Tables)
Table 1 Global Drilling and Completion Fluid Peer Market Size, 2013 (USD MN)
Table 2 Latin America Drilling and Completion Fluids Market, By Application, 2013 (USD MN)
Table 3 Latin America Drilling and Completion Fluids Market: Macro Indicators, By Country, Number of Wells (2009 - 2013)
Table 4 Latin America Drilling and Completion Fluids Market: Comparison With Parent Market, 2013 – 2019 (USD MN)
Table 5 Latin America Drilling and Completion Fluids Market: Drivers and Inhibitors
Table 6 Latin America Drilling and Completion Fluids Market, By Application, 2013 - 2019 (USD MN)
Table 7 Latin America Drilling and Completion Fluids Market, By Type and Country, 2013 (USD MN)
Table 8 Latin America Drilling and Completion Fluids Market, By Type, 2013 - 2019 (USD MN)
Table 9 Latin America Drilling and Completion Fluids Market, By Country, 2013 - 2019 (USD MN)
Table 10 Latin America Drilling and Completion Fluids Market, By Application, 2013 - 2019 (USD MN)
Table 11 Latin America Drilling and Completion Fluids Market, By Application, 2013 - 2019 (USD MN)
Table 12 Latin America Onshore Drilling and Completion Fluids Market, By Country, 2013 - 2019 (USD MN)
Table 13 Latin America Offshore Drilling and Completion Fluids Market, By Country, 2013 – 2019 (USD MN)
Table 14 Latin America Drilling and Completion Fluids Market, By Type, 2013 - 2019 (USD MN)
Table 15 Latin America Water-Based System Market Size, By Country, 2013–2019 (USD MN)
Table 16 Latin America Oil-Based System Market Size, By Country, 2013 - 2019 (USD MN)
Table 17 Latin America Synthetic-Based System Market Size, By Country, 2013 - 2019 (USD MN)
Table 18 Latin America Drilling and Completion Fluids Market, By Country, 2013 - 2019 (USD MN)
Table 19 Mexico Drilling and Completion Fluids Market, By Application, 2013-2019 (USD MN)
Table 20 Mexico Drilling and Completion Fluids Market, By Type, 2013 - 2019 (USD MN)
Table 21 Brazil Drilling and Completion Fluids Market, By Application, 2013 - 2019 (USD MN)
Table 22 Brazil Drilling and Completion Fluids Market, By Type, 2013 - 2019 (USD MN)
Table 23 Venezuela Drilling and Completion Fluids Market, By Application, 2013 - 2019 (USD MN)
Table 24 Venezuela Drilling and Completion Fluids Market, By Type, 2013 – 2019 (USD MN)
Table 25 Argentina Drilling and Completion Fluids Market, By Application, 2013 - 2019 (USD MN)
Table 26 Argentina Drilling and Completion Fluids Market, By Type, 2013 - 2019 (USD MN)
Table 27 Latin America Drilling and Completion Fluids Market: Company Share Analysis, 2013
Table 28 Latin America Drilling and Completion Fluids Market: Mergers & Acquisitions
Table 29 Latin America Drilling and Completion Fluids Market: Expansions
Table 30 Latin America Drilling and Completion Fluids Market: New Product/Service Developments
Table 31 Latin America Drilling and Completion Fluids Market: Contracts/Agreements
Table 32 Latin America Drilling and Completion Fluids Market: Divestments/Joint Ventures
Table 33 Schlumberger: Key Financials, 2009 - 2013 (USD MN)
Table 34 Net Sales, By Business Segment, 2010-2013 (USD MN)
Table 35 Net Sales, By Geographical Region, 2009-2013 (USD MN)
Table 36 Halliburton: Key Financials, 2009 - 2013 (USD MN)
Table 37 Net Sales, By Business Segment, 2009-2013 (USD MN)
Table 38 Net Sales, By Geographical Segment, 2009-2013 (USD MN)
Table 39 Baker Hughes: Key Financials, 2009 - 2013 (USD MN)
Table 40 Net Sales, By Business Segment, 2009-2013 (USD MN)
Table 41 Net Sales, By Geographical Segment, 2009-2013 (USD MN)
Table 42 Newpark Resources Inc.: Key Financials, 2009 - 2013 (USD MN)
Table 43 Net Sales, By Business Segment, 2009-2013 (USD MN)
Table 44 Net Sales, By Geographical Segment, 2009-2013 (USD MN)
Table 45 Tetra Technologies Inc.: Key Financials, 2009 - 2013 (USD MN)
Table 46 Net Sales, By Business Segment, 2009-2013 (USD MN)
Table 47 Net Sales, By Geographical Segment, 2009-2013 (USD MN)
Table 48 Weatherford: Key Financials, 2009 - 2013 (USD MN)
Table 49 Net Sales, By Business Segment, 2009-2013 (USD MN)
Table 50 Net Sales, By Geographical Segment, 2009-2013 (USD MN)
Table 51 National Oilwell Varco: Key Financials, 2009 - 2013 (USD MN)
Table 52 Net Sales, By Business Segment, 2009-2013 (USD MN)
Table 53 Net Sales, By Geographical Segment, 2009-2013 (USD MN)
List of Figures (49 Figures)
Figure 1 Latin America Drilling and Completion Fluids Market: Segmentation and Coverage
Figure 2 Latin America Drilling and Completion Fluids Market: Integrated Ecosystem
Figure 3 Research Methodology
Figure 4 Top-Down Approach
Figure 5 Bottom-Up Approach
Figure 6 Demand Side Approach
Figure 7 Macro Indicator-Based Approach: Number of Wells (2013)
Figure 8 Latin America Drilling and Completion Fluids Market Snapshot
Figure 9 Latin America Drilling and Completion Fluids Market: Growth Aspects
Figure 10 Latin America Drilling and Completion Fluids Market: Comparison With Parent Market (USD MN)
Figure 11 Latin America Drilling and Completion Fluids Market, By Application, 2013-2019 (USD MN)
Figure 12 Latin America Drilling and Completion Fluids Market, By Application, 2014 & 2019 (USD MN)
Figure 13 Latin America Onshore Drilling and Completion Fluids Market, By Country, 2013 - 2019 (USD MN)
Figure 14 Latin America Offshore Drilling and Completion Fluids Market, By Country, 2013 - 2019 (USD MN)
Figure 15 Sneak View: Latin America Drilling and Completion Fluids Market
Figure 16 Latin America Drilling and Completion Fluids Market, By Type, 2014 - 2019 (USD MN)
Figure 17 Latin America Water-Based System Market Size, By Country, 2013–2019 (USD MN)
Figure 18 Latin America Oil-Based System Market Size, By Country, 2013 - 2019 (USD MN)
Figure 19 Latin America Synthetic-Based System Market Size, By Country, 2013 - 2019 (USD MN)
Figure 20 Latin America Drilling and Completion Fluids Market: Growth Analysis, By Country, 2014 & 2019 (USD MN)
Figure 21 Mexico Drilling and Completion Fluids Market Overview, 2014 & 2019
Figure 22 Mexico Drilling and Completion Fluids Market, By Application, 2013-2019 (USD MN)
Figure 23 Mexico Drilling and Completion Fluids Market: Application Snapshot
Figure 24 Mexico Drilling and Completion Fluids Market, By Type, 2013 - 2019 (USD MN)
Figure 25 Mexico Drilling and Completion Fluids Market (Value), By Type, 2014 & 2019 (%)
Figure 26 Brazil Drilling and Completion Fluids Market Overview, 2014 & 2019
Figure 27 Brazil Drilling and Completion Fluids Market, By Application, 2013-2019 (USD MN)
Figure 28 Brazil Drilling and Completion Fluids Market: Application Snapshot
Figure 29 Brazil Drilling and Completion Fluids Market, By Type, 2013 - 2019 (USD MN)
Figure 30 Brazil Drilling and Completion Fluids Market, By Type, 2014 & 2019 (%)
Figure 31 Venezuela Drilling and Completion Fluids Market Overview, 2014 & 2019
Figure 32 Venezuela Drilling and Completion Fluids Market, By Application, 2013 - 2019 (USD MN)
Figure 33 Venezuela Drilling and Completion Fluids Market: Application Snapshot
Figure 34 Venezuela Drilling and Completion Fluids Market, By Type, 2013 - 2019 (USD MN)
Figure 35 Venezuela Drilling and Completion Fluids Market, By Type, 2014-2019 (%)
Figure 36 Argentina Drilling and Completion Fluids Market Overview, 2014 & 2019
Figure 37 Argentina Drilling and Completion Fluids Market, By Application, 2013 - 2019 (USD MN)
Figure 38 Argentina Drilling and Completion Fluids Market: Application Snapshot
Figure 39 Argentina Drilling and Completion Fluids Market, By Type, 2013 - 2019 (USD MN)
Figure 40 Argentina Drilling and Completion Fluids Market, By Type, 2014-2019 (%)
Figure 41 Latin America Drilling and Completion Fluids Market: Company Share Analysis, 2013
Figure 42 Drilling and Completion Fluids: Company Product Coverage, By Type, 2013
Figure 43 Schlumberger Revenue Mix, 2013
Figure 44 Halliburton Revenue Mix, 2013
Figure 45 Baker Hughes Revenue Mix, 2013
Figure 46 Newpark Resources Inc. Revenue Mix, 2013
Figure 47 Tetra Technologies Inc. Revenue Mix, 2013
Figure 48 Weatherford Revenue Mix, 2013
Figure 49 National Oilwell Varco Revenue Mix, 2013
Growing energy demand and exploration of new oil & gas fields are the major driving factors influencing the drilling fluid and completion fluid market. Drilling operations require drilling fluids that contain chemicals for well drilling, completion, and cementing injected through the drill string. These fluids serve many purposes, such as removal of cuttings from wellbore, suspend and release cuttings, counterbalance the formation pressure, seal permeable formation, maintain wellbore stability, minimize formation damages, work as coolant and lubricating agent for drilling bit, transmit hydraulic energy to drilling bit, and control corrosion of an equipment.
The drilling fluid and completion fluid market in Latin America is expected to grow at a CAGR of 6.6% from 2014 to 2019. The market is divided on the basis of type, application, and geography.
The types of drilling fluids are categorized on the basis of base fluid type. They are water-based fluids, oil-based fluids, and synthetic based fluid. The water-based type fluid market is expected to grow at a CAGR of 6.9% during forecast period. The application areas of the drilling fluid and completion fluid market is divided into onshore and offshore fields, with onshore fields occupying 80.3% market share in 2013.
Latin American countries such as Venezuela and Brazil are a part of the Golden Triangle, where the offshore drilling activities are progressing at a rapid pace. The large amount of proved reserves in these countries has attracted huge investments. Drilling activities in Latin America are rapidly growing with numerous multinational companies investing in this region.
The market players in the drilling fluid and completion fluid market in Latin America are Halliburton (U.S.), Weatherford (U.S.), Scomi Group (U.S.), Newpark Resources (U.S.), Tetra technologies (U.S.), National Oilwell Varco Inc. (U.S.), and M-I Swaco (U.S.). Some of the key strategies adopted by companies are new product launch, mergers & acquisitions, agreements and contracts, and research and developmental activities.
Please visit https://www.micromarketmonitor.com/custom-research-services.html to specify your custom Research Requirement


