

Europe Departmental Picture Archiving And Communication System (PACS) Market by Product (Radiology PACS, Cardiology PACS, Others), by Deployment), by End User (Hospitals, Laboratories, Physicians), by Component - Analysis and Forecast to 2019
- Publish Date: May 2015


Different departments of a healthcare organization exhibit significant differences in their need for image acquisition, storage, sharing, and managing of image workflows. The radiology department has a typically structured workflow, as radiologists review images sequentially. Cardiologists usually view images from various procedures simultaneously, making the imaging workflow of a cardiology department less structured. Radiology PACS is the largest segment of the overall departmental PACS deployment. However, cardiology PACS is also increasing in popularity lately.
Europe represents the second largest market for Departmental PACS and in future it is expected to grow at a CAGR of 5.2% from 2014 to 2019. Germany commands the largest share of 25.1% of the European Departmental PACS, followed by France.
Factors such as the growing trend of public healthcare systems and high price contracts, hospital consolidation, rising number of cardiology disorders, and technological advancements in cardiac monitoring facilities mainly drive the growth of the European Departmental PACS Market.
However, factors such as creation of data silos, interoperability and hardware compatibility issues, expensive technology, and a compulsory need of professional assistance further limit the growth of this market.
The report provides a DeepDive analysis of major market segments which include applications, deployment, component, types, end-users, and geography.
The application segment comprises computed tomography, ultrasound, MRI, C-arms, digital radiography, nuclear imaging, and computed radiography. Deployments are divided on the basis of web-based, on-premise, and cloud based. Similarly, based on components, the market is classified into services, software, and hardware. The departmental PACS market is divided into two types-radiology and cardiology PACS.
The report provides an in-depth analysis of the market landscape and market trends-related information on the European Departmental PACS Market, by end-users.
Geographically, the market is divided into the U.K., France, Germany, Italy, Spain, and Rest of Europe (RoE).
The report also provides extensive market share analysis, by total revenue, of the key market players. These numbers are calculated on the basis of key facts, annual financial information from SEC filings, annual reports, and interviews with industry experts and key opinion leaders such as CEOs, directors, and marketing executives. A detailed market share analysis of the major players in the European Departmental PACS market has been covered in this report.
The key market players of the European Departmental PACS market include Agfa-Gevaert Group. (Belgium), Koninklijke Philips N.V. (Netherlands), Carestream Health (U.S.), FUJIFILM Holdings Corporation (Japan), McKesson Corporation (U.S.), General Electric Company (U.S.), and Siemens AG (Germany).
Table of Contents
1 Introduction (Page No. - 11)
1.1 Objectives of the Study
1.2 Market Segmentation & Coverage
1.3 Stakeholders
2 Research Methodology (Page No. - 13)
2.1 Integrated Ecosystem of Departmental PACS Market
2.2 Arriving at the Departmental PACS Market Size
2.2.1 Top-Down Approach
2.2.2 Bottom-Up Approach
2.2.3 Macro Indicator-Based Approach
2.3 Assumptions
3 Executive Summary (Page No. - 20)
4 Market Overview (Page No. - 22)
4.1 Introduction
4.2 Departmental PACS Market: Comparison With Parent Market
4.3 Market Drivers and Inhibitors
4.4 Key Market Dynamics
5 European Departmental PACS Market, By Product (Page No. - 28)
5.1 Introduction
5.2 Europe: Radiology PACS Market, By Country
5.3 Europe: Cardiology PACS Market, By Country
6 European Departmental PACS Market, in Component (Page No. - 32)
6.1 Introduction
6.2 Europe: Departmental PACS Market in Services, By Country
6.3 Europe: Departmental PACS Market in Software, By Country
6.4 Europe: Departmental PACS Market in Hardware, By Country
6.5 Sneak View: European Departmental PACS Market in Component,2014 (USD MN)
7 European Departmental PACS Market, in Deployment (Page No. - 38)
7.1 Introduction
7.2 Europe: Departmental PACS Market in Web-Based, By Country
7.3 Europe: Departmental PACS Market in On-Premise, By Country
7.4 Europe: Departmental PACS Market in Cloud-Based, By Country
7.5 Sneak View: European Departmental PACS Market in Deployment,2014 (USD MN)
8 European Departmental PACS Market, in End-User (Page No. - 44)
8.1 Introduction
8.2 Europe: Departmental PACS in Hospitals, By Country
8.3 Europe: Departmental PACS in Labs, By Country
8.4 Europe: Departmental PACS in Physicians, By Country
8.5 Sneak View: European Departmental PACS Market in End-User, 2014 (USD MN)
9 European Departmental PACS Market, By Geography (Page No. - 50)
9.1 Introduction
9.2 Germany: Departmental PACS Market
9.2.1 Germany: Departmental PACS Market, By Product
9.2.2 Germany: Departmental PACS Market, in Component
9.2.3 Germany: Departmental PACS Market, in Deployment
9.2.4 Germany: Departmental PACS Market, in End-User
9.3 France: Departmental PACS Market
9.3.1 France: Departmental PACS Market, By Product
9.3.2 France: Departmental PACS Market, in Component
9.3.3 France: Departmental PACS Market, in Deployment
9.3.4 France: Departmental PACS Market, in End-User
9.4 U.K.: Departmental PACS Market
9.4.1 U.K.: Departmental PACS Market, By Product
9.4.2 U.K.: Departmental PACS Market, in Component
9.4.3 U.K.: Departmental PACS Market, in Deployment
9.4.4 U.K.: Departmental PACS Market, in End-User
9.5 Italy: Departmental PACS Market
9.5.1 Italy: Departmental PACS Market, By Product
9.5.2 Italy: Departmental PACS Market, in Component
9.5.3 Italy: Departmental PACS Market, in Deployment
9.5.4 Italy: Departmental PACS Market, in End-User
9.6 Spain: Departmental PACS Market
9.6.1 Spain: Departmental PACS Market, By Product
9.6.2 Spain: Departmental PACS Market, in Component
9.6.3 Spain: Departmental PACS Market, in Deployment
9.6.4 Spain: Departmental PACS Market, in End-User
10 Departmental PACS Market: Competitive Landscape (Page No. - 77)
10.1 Departmental PACS Market: Company Share Analysis
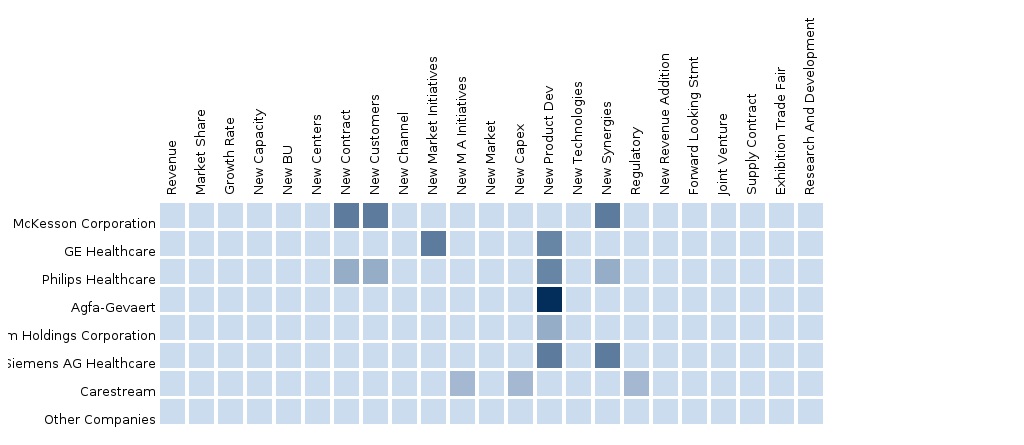
10.2 Company Presence in Departmental PACS Market, By Product
10.3 Mergers & Acquisitions
10.4 New Product Launch
10.5 Partnerships
11 Departmental PACS Market, By Company (Page No. - 81)
(Overview, Financials, Products & Services, Strategy, and Developments)*
11.1 AGFA Healthcare
11.2 Allscripts Healthcare Solutions, Inc.
11.3 Fujifilm Medical Systems (A Subsidiary of Fujifilm Holdings Corporation)
11.4 GE Healthcare
11.5 Mckesson Corporation
11.6 Philips Healthcare
11.7 Siemens Healthcare (Subsidiary of Siemens AG)
*Details on Overview, Financials, Product & Services, Strategy, and Developments Might Not Be Captured in Case of Unlisted Company
12 Appendix (Page No. - 100)
12.1 Customization Options
12.1.1 Product Analysis
12.1.2 Surgeons/Physicians Perception Analysis
12.1.3 Brand/Product Perception Matrix
12.2 Related Reports
12.3 Introducing RT: Real-Time Market Intelligence
12.3.1 RT Snapshots
List of Tables (56 Tables)
Table 1 Global PACS Peer Market Size, 2014 (USD MN)
Table 2 European Departmental PACS Market: Macro Indicators, By Country,2014 (USD BN)
Table 3 European Departmental PACS Market: Comparison With Parent Market, 2013-2019 (USD MN)
Table 4 European Departmental PACS Market: Drivers and Inhibitors
Table 5 Europe: Departmental PACS Market Size, By Product, 2013-2019 (USD MN)
Table 6 Europe: Departmental PACS Market Size, By Country, 2013-2019 (USD MN)
Table 7 Europe: Departmental PACS Market Size, in Component, 2013-2019 (USD MN)
Table 8 Europe: Departmental PACS Market Size, in Deployment, 2013-2019 (USD MN)
Table 9 Europe: Departmental PACS Market Size, in End-User, 2013-2019 (USD MN)
Table 10 Europe: Departmental PACS Market Size, By Product, 2013-2019 (USD MN)
Table 11 Europe: Radiology PACS Market Size, By Country, 2013-2019 (USD MN)
Table 12 Europe: Cardiology PACS Market Size, By Country, 2013-2019 (USD MN)
Table 13 Europe: Departmental PACS Market Size, in Component, 2013-2019 (USD MN)
Table 14 Europe: Departmental PACS Market in Services, By Country,2013-2019 (USD MN)
Table 15 Europe: Departmental PACS Market in Software, By Country,2013-2019 (USD MN)
Table 16 Europe: Departmental PACS Market in Hardware, By Country,2013-2019 (USD MN)
Table 17 Europe: Departmental PACS Market Size, in Deployment, 2013-2019 (USD MN)
Table 18 Europe: Departmental PACS Market in Web-Based, By Country,2013-2019 (USD MN)
Table 19 Europe: Departmental PACS Market in On-Premise, By Country,2013-2019 (USD MN)
Table 20 Europe: Departmental PACS Market in Cloud-Based, By Country,2013-2019 (USD MN)
Table 21 Europe: Departmental PACS Market in End-User, 2013-2019 (USD MN)
Table 22 Europe: Departmental PACS Market in Hospitals, By Country,2013-2019 (USD MN)
Table 23 Europe: Departmental PACS Market in Labs, By Country, 2013-2019 (USD MN)
Table 24 Europe: Departmental PACS Market in Physicians, By Country,2013-2019 (USD MN)
Table 25 Europe: Departmental PACS Market Size, By Country, 2013-2019 (USD MN)
Table 26 Germany: Departmental PACS Market Size, By Product, 2013-2019 (USD MN)
Table 27 Germany: Departmental PACS Market, in Component, 2013-2019 (USD MN)
Table 28 Germany: Departmental PACS Market, in Deployment, 2013-2019 (USD MN)
Table 29 Germany: Departmental PACS Market, in End-User, 2013-2019 (USD MN)
Table 30 France: Departmental PACS Market, By Product, 2013-2019 (USD MN)
Table 31 France: Departmental PACS Market, in Component, 2013-2019 (USD MN)
Table 32 France: Departmental PACS Market, in Deployment, 2013-2019 (USD MN)
Table 33 France: Departmental PACS Market, in End-User, 2013-2019 (USD MN)
Table 34 U.K.: Departmental PACS Market, By Product, 2013-2019 (USD MN)
Table 35 U.K.: Departmental PACS Market, in Component, 2013-2019 (USD MN)
Table 36 U.K.: Departmental PACS Market, in Deployment, 2013-2019 (USD MN)
Table 37 U.K.: Departmental PACS Market Size, in End-User, 2013-2019 (USD MN)
Table 38 Italy: Departmental PACS Market, By Product, 2013-2019 (USD MN)
Table 39 Italy: Departmental PACS Market, in Component, 2013-2019 (USD MN)
Table 40 Italy: Departmental PACS Market, in Deployment, 2013-2019 (USD MN)
Table 41 Italy: Departmental PACS Market Size, in End- User, 2013-2019 (USD MN)
Table 42 Spain: Departmental PACS Market, By Product, 2013-2019 (USD MN)
Table 43 Spain: Departmental PACS Market, in Component, 2013-2019 (USD MN)
Table 44 Spain: Departmental PACS Market, in Deployment, 2013-2019 (USD MN)
Table 45 Spain: Departmental PACS Market Size, in End-User, 2013-2019 (USD MN)
Table 46 Departmental PACS Market: Company Share Analysis, 2014 (%)
Table 47 European Departmental PACS Market: Mergers & Acquisitions
Table 48 European Departmental PACS Market: New Product Launch
Table 49 European Departmental PACS Market: Partnerships
Table 50 AGFA Healthcare: Key Financials, 2009-2013 (USD MN)
Table 51 Allscripts Healthcare Solutions, Inc.: Key Financials, 2011-2013 (USD MN)
Table 52 Fujifilm Medical Systems: Key Financials, 2010-2014 (USD MN)
Table 53 GE Healthcare: Key Financials, 2010-2014 (USD MN)
Table 54 Mckesson Corporation: Key Financials, 2010-2014 (USD MN)
Table 55 Philips Healthcare: Key Financials, 2010-2014 (USD MN)
Table 56 Siemens Healthcare: Key Financials, 2010-2014 (USD MN)
List of Figures (62 Figures)
Figure 1 European Departmental PACS Market: Segmentation & Coverage
Figure 2 Departmental PACS Market: Integrated Ecosystem
Figure 3 Research Methodology
Figure 4 Top-Down Approach
Figure 5 Bottom-Up Approach
Figure 6 Macro Indicator-Based Approach
Figure 7 Europe: Departmental PACS Market Snapshot-2014
Figure 8 European Departmental PACS Market: Comparison With Parent Market
Figure 9 Geographic Analysis: European Departmental PACS Market, By Product, 2014 (USD MN)
Figure 10 Europe: Departmental PACS Market, By Product, 2014 vs 2019 (USD MN)
Figure 11 Europe: Radiology PACS Market, By Country, 2013-2019 (USD MN)
Figure 12 Europe: Cardiology PACS Market, By Country, 2013-2019 (USD MN)
Figure 13 Europe: Departmental PACS Market, in Component, 2013-2019 (USD MN)
Figure 14 Europe: Departmental PACS Market in Services, By Country,2013-2019 (USD MN)
Figure 15 Europe: Departmental PACS Market in Software, By Country,2013-2019 (USD MN)
Figure 16 Europe: Departmental PACS Market in Hardware, By Country,2013-2019 (USD MN)
Figure 17 Sneak View: European Departmental PACS Market in Component,2014 (USD MN)
Figure 18 Europe: Departmental PACS Market, in Deployment, 2014 vs 2019 (USD MN)
Figure 19 Europe: Departmental PACS Market in Web-Based, By Country,2013-2019 (USD MN)
Figure 20 Europe: Departmental PACS Market in On-Premise, By Country,2013-2019 (USD MN)
Figure 21 Europe: Departmental PACS Market in Cloud-Based, By Country,2013-2019 (USD MN)
Figure 22 Sneak View: European Departmental PACS Market in Deployment,2014 (USD MN)
Figure 23 Europe: Departmental PACS in End-User, 2014 vs 2019 (USD MN)
Figure 24 Europe: Departmental PACS in Hospitals, By Country. 2013-2019 (USD MN)
Figure 25 Europe: Departmental PACS in Labs, By Country, 2013-2019 (USD MN)
Figure 26 Europe: Departmental PACS in Physicians, By Country, 2013-2019 (USD MN)
Figure 27 Sneak View: European Departmental PACS Market in End-User,2014 (USD MN)
Figure 28 Europe: Departmental PACS Market Growth Analysis, By Country,2014-2019 (USD MN)
Figure 29 Germany: Departmental PACS Market Overview, 2014 vs 2019 (%)
Figure 30 Germany: Departmental PACS Market, By Product, 2013-2019 (USD MN)
Figure 31 Germany: Departmental PACS Market, in Component, 2013-2019 (USD MN)
Figure 32 Germany: Departmental PACS Market, in Deployment, 2013-2019 (USD MN)
Figure 33 Germany: Departmental PACS Market, in End-User, 2013-2019 (USD MN)
Figure 34 France: Departmental PACS Market Overview, 2014 vs 2019 (%)
Figure 35 France: Departmental PACS Market, By Product, 2013-2019 (USD MN)
Figure 36 France: Departmental PACS Market, in Component, 2013-2019 (USD MN)
Figure 37 France: Departmental PACS Market, in Deployment, 2013-2019 (USD MN)
Figure 38 France: Departmental PACS Market, in End-User, 2013-2019 (USD MN)
Figure 39 U.K.: Departmental PACS Market Overview, 2014 vs 2019 (%)
Figure 40 U.K.: Departmental PACS Market, By Product, 2013-2019 (USD MN)
Figure 41 U.K.: Departmental PACS Market, in Component, 2013-2019 (USD MN)
Figure 42 U.K.: Departmental PACS Market, in Deployment, 2013-2019 (USD MN)
Figure 43 U.K.: Departmental PACS Market, in End-User, 2013-2019 (USD MN)
Figure 44 Italy: Departmental PACS Market Overview, 2014 vs 2019 (%)
Figure 45 Italy: Departmental PACS Market, By Product, 2013-2019 (USD MN)
Figure 46 Italy: Departmental PACS Market, in Component, 2013-2019 (USD MN)
Figure 47 Italy: Departmental PACS Market, in Deployment, 2013-2019 (USD MN)
Figure 48 Italy: Departmental PACS Market, in End-User, 2013-2019 (USD MN)
Figure 49 Spain: Departmental PACS Market Overview, 2014 vs 2019 (%)
Figure 50 Spain: Departmental PACS Market, By Product, 2013-2019 (USD MN)
Figure 51 Spain: Departmental PACS Market, in Component, 2013-2019 (USD MN)
Figure 52 Spain: Departmental PACS Market, in Deployment, 2013-2019 (USD MN)
Figure 53 Spain: Departmental PACS Market, in End-User, 2013-2019 (USD MN)
Figure 54 Departmental PACS Market: Company Share Analysis, 2014 (%)
Figure 55 Departmental PACS Market: Company Product Coverage, By Product, 2014
Figure 56 AGFA Healthcare: Business Revenue Mix, 2013 (%)
Figure 57 Allscripts Healthcare: Business Revenue Mix, 2013 (%)
Figure 58 Fujifilm Medical Systems: Business Revenue Mix, 2014 (%)
Figure 59 GE Healthcare: Business Revenue Mix, 2014 (%)
Figure 60 Mckesson Corporation: Business Revenue Mix, 2014 (%)
Figure 61 Philips Healthcare: Business Revenue Mix, 2014 (%)
Figure 62 Siemens Healthcare: Business Revenue Mix, 2013 (%)
Departmental PACS (Picture Archiving and Communication System) is an image processing, storing, and retrieval system. Hospitals need to maintain a faster processing and retrieval system to be more efficient. Also departmental PACS help in providing a huge storage space for clinical images. Europe is the second largest market for departmental PACS. It has a market share of 27.5% in the global departmental PACS market.
In this report, the European departmental PACS market has been segmented on the basis of type, component, delivery mode, end user, and by geography. The type segment includes radiology PACS, cardiology PACS, and other PACS, where radiology PACS contributed the largest market value. The component segment is divided into services and software, where the services segment has the largest market value. The deployment market is segmented into web-based, on-premise, and cloud-based, where web-based has the largest market value. The departmental PACS market has been segmented and analyzed in terms of the different end-users, such as hospitals, physicians, and labs, among others.
Further, the market has been segmented on the basis of geography into countries such as Germany, France, the U.K., Italy, Spain, and the rest of Europe. Germany is the biggest market in this region for departmental PACS products and services. It accounted a share for 23.3% of the European departmental PACS market in 2014. It was followed by France and the U.K.
The departmental PACS market in Europe was valued at $649.6 million in 2014 and is expected to reach $989.9 million by 2019 at a CAGR of 8.8% from 2014 to 2019. Globally, Europe is a well-established market for departmental PACS. Factors such as investments made by PACS companies, mergers and acquisitions in the European PACS market, and growth in the healthcare IT industry in Europe is driving the departmental PACS market in the region.
The major players profiled in the global departmental PACS market report includes Carestream (U.S.A.), Philips Healthcare (Netherlands), Agfa Healthcare (Belgium), Fujifilm Healthcare (U.S.A.), GE healthcare (U.K.), Siemens Healthcare(U.S.A.), and McKesson Corporation(U.S.A.).
The report gives comprehensive and detailed insights about the segments in particular countries in the geographic analysis chapter. It presents in-depth competitive landscape covering major developments in the region for last four years (2012 to 2015), and also the region specific company share analysis for the year 2014 (or 2013 in older reports).
Please visit https://www.micromarketmonitor.com/custom-research-services.html to specify your custom Research Requirement
| PRODUCT TITLE | PUBLISHED | |
|---|---|---|
|
|
North American Picture Archiving and Communication System (PACS) The North American Picture Archiving and Communication System (PACS) Market was pegged at $1492 million in 2012 and expected to be $1961 million by 2018, growing at a CAGR of 4.66%.Picture Archiving and Communication System (PACS) Market can be segmented by Geographies, Applications,Deployments,Endusers, Companies and MacroIndicators. Deep dive analysis of the top players of this market have been considered in this report. |
Upcoming |
|
|
Asian Picture Archiving and Communication System (PACS) The Asian Picture Archiving and Communication System (PACS) Market was pegged at $456 million in 2012 and expected to be $675 million by 2018, growing at a CAGR of 6.74%.Picture Archiving and Communication System (PACS) Market can be segmented by Geographies, Applications, Deployments, Endusers, Companies and MacroIndicators. Deep dive analysis of the top players of this market have been considered in this report. |
Upcoming |


