

Europe 2-Ethylhexanol Market
- Publish Date: Upcoming


Europe 2-ethylhexanol Market
The 2-ethylhexanol market is witnessing high growth because of the increase in the number of applications. The Europe 2-ethylhexanol market report estimates the size of the 2-ethylhexanol market in terms of volume and value. The Europe 2-ethylhexanol market report provides a comprehensive review of the key market drivers, challenges, and issues.
The Europe 2-ethylhexanol market was valued at $1,337.93 million in 2012, and is projected to reach $1,666.27 million by 2018, growing at a CAGR of 4.5% from 2013. Europe 2-ethylhexanol market growth was driven by domestic sales, but these days, the country’s growth is shared dependent on both the domestic and the export market.
The European chemical industry is a significant part of the country’s economy. Traditionally, the chemical industry in Europe is a world leader in chemical production. In 2007, 12 out of 30 leading chemical companies in the world were headquartered at Europe. It provides employment to more than 1.2 million workers cumulatively involved in product manufacturing, research support and providing supplies to many regions in the country. The European chemical industry is mainly based on four categories of chemicals - Base chemicals, Specialty chemicals, Pharmaceuticals and Consumer chemicals.
Despite the economic downturn in the country, the Europe 2-ethylhexanol market is still in a strong position, as it had sales of $770.7 billion in 2010, which is one-fourth of the global sales in terms on value. More than half of the chemical sales in Europe are of petrochemicals and polymers, experiencing a continuous rise of share in sales among all the chemicals. Germany is the largest chemical producer in Europe, followed by France, Italy, and The Netherlands. These four countries together account for 64.0% of the Europe chemical sales. In the past, most of Europe’s chemical industry growth was driven by domestic sales, but these days, the country’s growth is shared dependent on both the domestic and the export market. Europe is also a leading exporter cum importer, accounting for 41.0% of the global trade.
The German chemical industry plays an important role in the nation's economy. The chemical industry in the country is the top industry in Europe and comes as the fourth highest industry globally, being passed only by China, U.S. and Japan. Germany’s central location in Europe provides it with a further advantage, giving it an access to customer base of 500 million within the region.
The Europe 2-ethylhexanol market report covers the 2-ethylhexanol market in Europe and its key countries. The various applications such as Plasticizers, 2-EH Acrylate, 2-EH Nitrate and other applications are also studied in the report.
The key countries covered in Europe 2-ethylhexanol market are Germany, France, UK, Poland and Italy. The various applications studied include Plasticizers, 2-EH Acrylate, 2-EH Nitrate and other applications. Further, as a part of qualitative analysis, the Europe 2-ethylhexanol market research report provides comprehensive review of the important drivers, restraints, opportunities, and burning issues in the 2-ethylhexanol market.
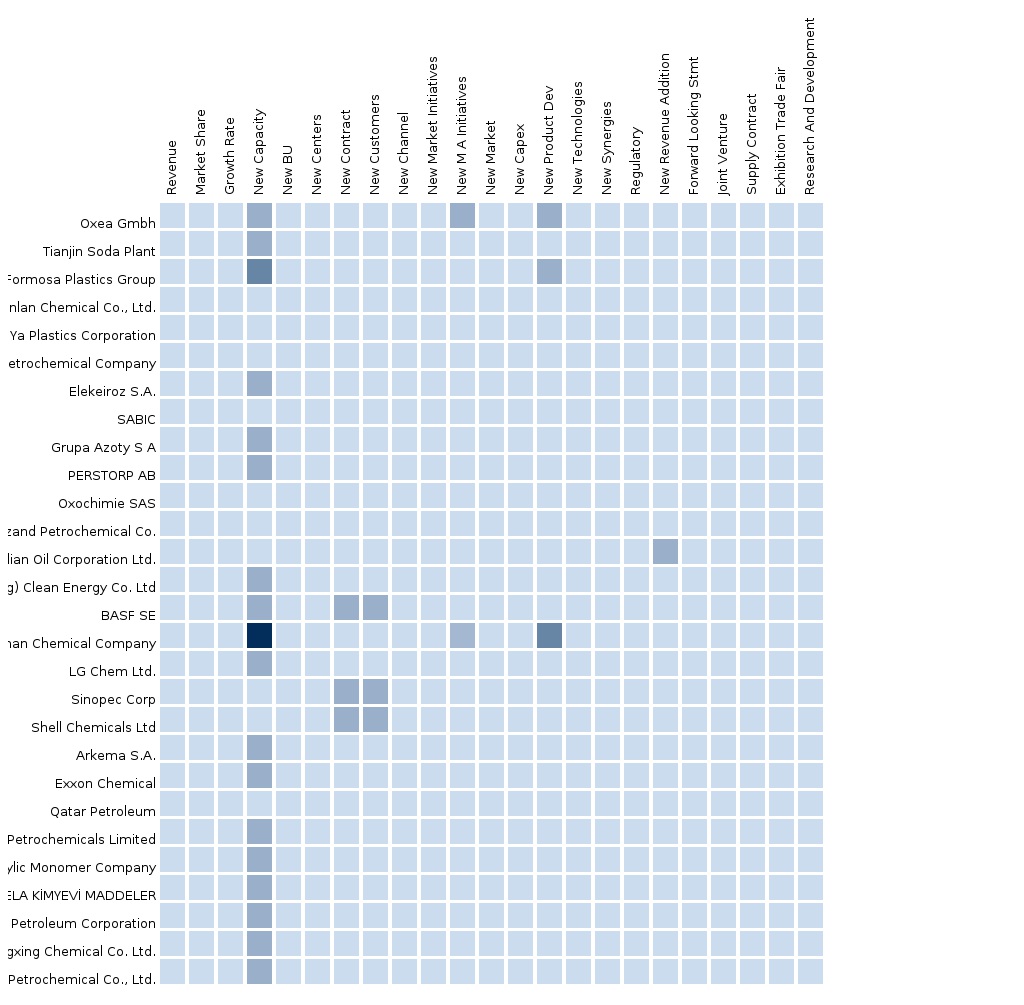
The Europe 2-ethylhexanol market report also provides an extensive competitive landscape of the companies operating in this market. It also includes the company profiles and competitive strategies adopted by various market players- BASF SE, CNPC, Eastman Chemical Company (U.S.), OXEA GMBH (U.S.), CPCC, Grupa Azoty, Sabic, Elekeiroz SA, LG Chem Ltd, SINOPEC (China), OXEA GmbH (Germany), LG Chem Ltd (South Korea), and Eastman Chemical Company (U.S.) and Formosa Plastics Group (Taiwan)
Customization Options:
With Market data, you can also customize MMM assessments that meet your Company’s specific needs. Customize to get comprehensive industry standards and deep dive analysis of the following parameters:
Market share analysis
- Consumption pattern (in-depth trend analysis), by application (country-wise)
- Competitive landscape with a detailed comparison of portfolio of each company mapped at the regional- and country-level
- Market size in terms of volume (application-wise and country-wise)
- Production Data at country level with much comprehended approach of understanding
- Comprehensive coverage of plant capacity estimates that will analyze the future prospects of the market
- Plant Capacities for major countries(by companies)
- Analysis of Load factor to understand actual production at country level
Value chain analysis
- Raw materials used in making 2-ethylhexanol
- The technologies used in the making
- Applications in various segments
- Analysis of Forward chain integration as well as backward chain integration to understand the approach of business prevailing in the market
Impact analysis
- The list of drivers for the market
- The various restraints that can hinder the market growth
- The various new opportunities for the emerging players
- The threats prevailing in the market
Trade analysis
- Trade data, by country
- Import-export data, by each country with other key countries of the world
Scale analysis
- Comparison with respect to the global 2-EH market
- New technology trends
- New product developments
1 Introduction
1.1 Objectives of the study
1.2 Report Description
1.3 MARKETS COVERED
1.3.1 2-EH Market by Applications
1.3.2 2-EH Market by Country
1.4 STAKEHOLDERS
1.5 RESEARCH METHODOLOGY
1.6 Assumptions
2 Market Snapshot
3 Market Overview
3.1 Introduction
3.1.1 Average Selling Price
3.1.2 Regional Market Summary
3.2 Market Dynamics
3.2.1 Drivers
3.2.1.1 Growth in 2-EH Acrylate Industry
3.2.2 Restraints
3.2.2.1 Negative Trends of DOP in Europe
3.2.3 Opportunities
3.2.3.1 Strict Norms Pushing the Demand for High Performance Fuels
3.3 Supporting Data
3.3.1 Trade Data
3.3.1.1 Germany
3.3.1.2 France
3.3.1.3 U.K.
3.3.1.4 ITALY
3.3.1.5 POLAND
4 2-ETHYLHEXANOL-EUROPE, BY APPLICATIONS
4.1 SPLIT BY GEOGRAPHY
4.1.1 EUROPE-2-ETHYLHEXYL ACRYLATE
4.1.1.1 France-2-Ethylhexyl Acrylate
4.1.1.2 Germany-2-Ethylhexyl Acrylate
4.1.2 PLASTICIZERS-EUROPE
4.1.2.1 Plasticizers-Germany
4.1.2.2 Plasticizers-United Kingdom
4.1.2.3 Plasticizers-Italy
4.1.2.4 Plasticizers-Europe - Poland
4.1.3 2-Ethylhexyl Nitrate-Europe
4.1.3.1 2-Ethylhexyl Nitrate-Germany
4.1.3.2 2-Ethylhexyl Nitrate-France
4.1.3.3 2-Ethylhexyl Nitrate-United Kingdom
4.1.3.4 2-Ethylhexyl Nitrate-Europe - Poland
4.1.4 Europe-Other Applications
4.1.4.1 United Kingdom-Other Applications
4.1.4.2 France-Other Applications
4.1.4.3 Germany-Other Applications
4.1.4.4 Italy-Other Applications
4.1.4.5 Europe - Poland-Other Applications
5 2-ETHYLHEXANOL-EUROPE, BY COUNTRY
5.1 UNITED KINGDOM
5.1.1 United Kingdom, By Applications
5.1.1.1 2-Ethylhexyl Nitrate-United Kingdom
5.1.1.2 United Kingdom-Other Applications
5.1.1.3 Plasticizers-United Kingdom
5.2 FRANCE
5.2.1 France, By Applications
5.2.1.1 France-2-Ethylhexyl Acrylate
5.2.1.2 2-Ethylhexyl Nitrate-France
5.2.1.3 France-Other Applications
5.3 Germany
5.3.1 Germany, By Applications
5.3.1.1 Germany-2-Ethylhexyl Acrylate
5.3.1.2 2-Ethylhexyl Nitrate-Germany
5.3.1.3 Plasticizers-Germany
5.3.1.4 Germany-Other Applications
5.4 Italy
5.4.1 Italy, By Applications
5.4.1.1 Plasticizers-Italy
5.4.1.2 Italy-Other Applications
5.5 Poland
5.5.1 Europe - Poland, By Applications
5.5.1.1 Plasticizers-Europe - Poland
5.5.1.2 Europe - Poland-Other Applications
5.5.1.3 2-Ethylhexyl Nitrate-Europe - Poland
6 COMPETITIVE LANDSCAPE
6.1 Europe-By Companies
6.2 2-Ethylhexanol-Europe-Market Developments
7 Company Profiles
7.1 OXEA GMBH
7.1.1 Overview
7.1.2 Product portfolio
7.1.3 Financials
7.2 GRUPO AZOTY SA
7.2.1 Overview
7.2.2 Product portfolio
7.2.3 Financials
7.3 PERSTORP AB
7.3.1 Overview
7.3.2 Product portfolio
7.3.3 Financials
7.4 OXOCHIMIE
7.4.1 Overview
7.4.2 Product portfolio
7.4.3 Financials
7.5 BASF SE
7.5.1 Overview
7.5.2 Product portfolio
7.5.3 Financials
8 Technical Insights
List of Tables
TABLE 1 Global 2-Ethylhexanol Market, 2012 – 2018 (KT)
TABLE 2 Global 2-Ethylhexanol Market, 2012 – 2018 ($Million)
TABLE 3 2-Ethylhexanol-Asia-Pacific Average Selling Price, 2012 – 2018 ($/Ton)
TABLE 4 2-Ethylhexanol- Europe market values, by Applications, 2012- 2018 ($million)
TABLE 5 2- Ethylhexanol- Europe market volume, by Applications, 2012 – 2018 (KT)
TABLE 6 2-Ethylhexanol-Europe market values, by Country, 2012 – 2018 ($million)
TABLE 7 2-Ethylhexanol- Europe market volume, by Country, 2012 – 2018 (KT)
TABLE 8 Global Carbon Dioxide Emissions, 2011-2012
TABLE 9 Germany Major Export Allies, 2012
TABLE 10 Germany Major Import Allies, 2012
TABLE 11 Germany 2-Ethylhexanol Export, 2009-2012
TABLE 12 Germany 2-Ethylhexanol Import, 2009-2012
TABLE 13 Germany 2-Ethylhexanol Trade Balance, 2009-2012
TABLE 14 France Major Export Allies, 2012
TABLE 15 France Major Import Allies, 2012
TABLE 16 France 2-Ethylhexanol Export, 2009-2012
TABLE 17 France 2-Ethylhexanol Import, 2009-2012
TABLE 18 France 2-Ethylhexanol Trade Balance, 2009-2012
TABLE 19 U.K. Major Export Allies, 2012
TABLE 20 U.K. Major Import Allies, 2012
TABLE 21 U.K. 2-Ethylhexanol Export, 2009-2012
TABLE 22 U.K. 2-Ethylhexanol Import, 2009-2012
TABLE 23 U.K. 2-Ethylhexanol Trade Balance, 2009-2012
TABLE 24 ITALY Major Export Allies, 2012
TABLE 25 ITALY Major Import Allies, 2012
TABLE 26 ITALY 2-Ethylhexanol Export, 2009-2012
TABLE 27 ITALY 2-Ethylhexanol Import, 2009-2012
TABLE 28 ITALY 2-Ethylhexanol Trade Balance, 2009-2012
TABLE 29 POLAND Major Export Allies, 2012
TABLE 30 POLAND Major Import Allies, 2012
TABLE 31 POLAND 2-Ethylhexanol Export, 2009-2012
TABLE 32 POLAND 2-Ethylhexanol Import, 2009-2012
TABLE 33 POLAND 2-Ethylhexanol Trade Balance, 2009-2012
TABLE 34 2- Ethylhexanol market values- Europe- 2- Ethylhexyl Acrylate, by Country, 2012-2018 ($Million)
TABLE 35 2- Ethylhexanol market voulme- Europe-2- Ethylhexyl Acrylate, by Country, 2012-2018 (KT)
TABLE 36 2-Ethylhexanol market values- Plasticizers- Europe, by Country, 2012-2018 ($thousands)
TABLE 37 2- Ethylhexanol market volume- Plasticizers- Europe by Country, 2012-2018 (tons)
TABLE 38 2-Ethylhexanol market value- 2- Ethylhexyl Nitrate-Europe, by Country, 2012-2018 ($thousands)
TABLE 39 2- Ethylhexanol market volume- 2- Ethylhexyl Nitrate- Europe by Country, 2012-2018 (tons)
TABLE 40 2- Ethylhexanol market values- Europe- Other Applications, by Country, 2012-2018 ($million)
TABLE 41 2- Ethylhexanol market volume- Europe- Other Applications, by Country, 2012-2018 (tons)
TABLE 42 2- Ethylhexanol market values- United Kingdom, by Applications, 2012-2018 ($thousands)
TABLE 43 2- Ethylhexanol market volume- United Kingdom, by Applications, 2012-2018 (tons)
TABLE 44 2- Ethylhexanol market values- France, by Applications, 2012-2018 ($million)
TABLE 45 2- Ethylhexanol market volume- France, by Applications, 2012-2018 (KT)
TABLE 46 2- Ethylhexanol Market values- Germany, by Applications, 2012-2018 ($million)
TABLE 47 2- Ethylhexanol market volume- Germany, by Applications, 2012-2018 (KT)
TABLE 48 2-Ethylhexanol market values- Italy, by Applications, 2012-2018 ($million)
TABLE 49 2- Ethylhexanol market volume- Italy, by Applications, 2012-2018 (tons)
TABLE 50 2- Ethylhexanol market values- Europe- Poland, by Applications, 2012-2018 ($thousands)
TABLE 51 2- Ethylhexanol market volume- Europe- Poland, by Applications, 2012-2018 (tons)
TABLE 52 2-Ethylhexanol-Europe market values, by Companies, 2012 – 2018 ($million)
TABLE 53 Grupo azoty sa: Annual Revenue, By Business Segments, 2009–2013 ($Million)
TABLE 54 Grupo azoty sa: annual revenue By geographic region, 2009–2013 ($Million)
TABLE 55 perstorp ab: Annual Revenue, By Business Segments, 2009–2013 ($Million)
TABLE 56 BASF SE: annual revenue By BUSINESS SEGMENT, 2009–2013 ($Million),
TABLE 57 BASF SE: annual revenue By geography, 2009–2013 ($Million),
List of Figures
FIGURE 1 Top Growing 2-Ethylhexanol-Europe Markets By Revenue 2012- 2018
FIGURE 2 Top Growing 2-Ethylhexanol-Europe-2-Ethylhexyl Acrylate Markets By Revenue 2012- 2018 FIGURE 3 Top Growing 2-Ethylhexanol-Plasticizers-Europe Markets By Revenue 2012- 2018 37
FIGURE 4 2-Ethylhexanol-Europe Market Share 2013
FIGURE 5 Top Growing 2-Ethylhexanol-2-Ethylhexyl Nitrate-Europe Markets By Revenue 2012- 2018
Please fill in the form below to receive a free copy of the Summary of this Report
Please visit https://www.micromarketmonitor.com/custom-research-services.html to specify your custom Research Requirement


