

Africa Drilling and Completion Fluids Market by Type (Water Based, Synthetic Based, Oil Based & others), By Application (Onshore & Offshore), By Countries - Regional Trend & Forecast to 2019
- Publish Date: Mar 2015


The drilling and completion fluid market in Africa was valued at $797.2 million in 2014 and is expected to reach USD 1025.5 million by 2019, growing at a CAGR of 5.2% from 2014 to 2019. The key factors driving this market are increasing drilling activities, increasing production of oil and gas, technological advancements, extensive exploration for shale gas and coal bed methane, and development of advanced drilling fluid chemicals. Stringent government regulations and increasing environmental concerns are some of the key challenges faced by the market players.
This market is segmented on the basis of application, type, and country. On the basis of application, the area is segmented into onshore and offshore. Onshore application segment has the larger market share. However, offshore application segment is expected to grow at a higher rate owing to the increasing drilling activities in deep-water and ultra-deep-water regions. On the basis of type, the market is segmented into water-based fluid systems, oil-based fluid systems, synthetic-based fluid systems, and other fluid systems. Water-based fluid system dominate the market as it is used in all drilling activities, whereas, oil-based and synthetic-based fluid system are used for the drilling activities mostly in harsh conditions.
The country wise segmentation includes Egypt, Algeria, Angola, Libya, and Nigeria. The emerging markets are Libya and Nigeria, which are growing at a CAGR of 7.0% and 6.5% respectively.
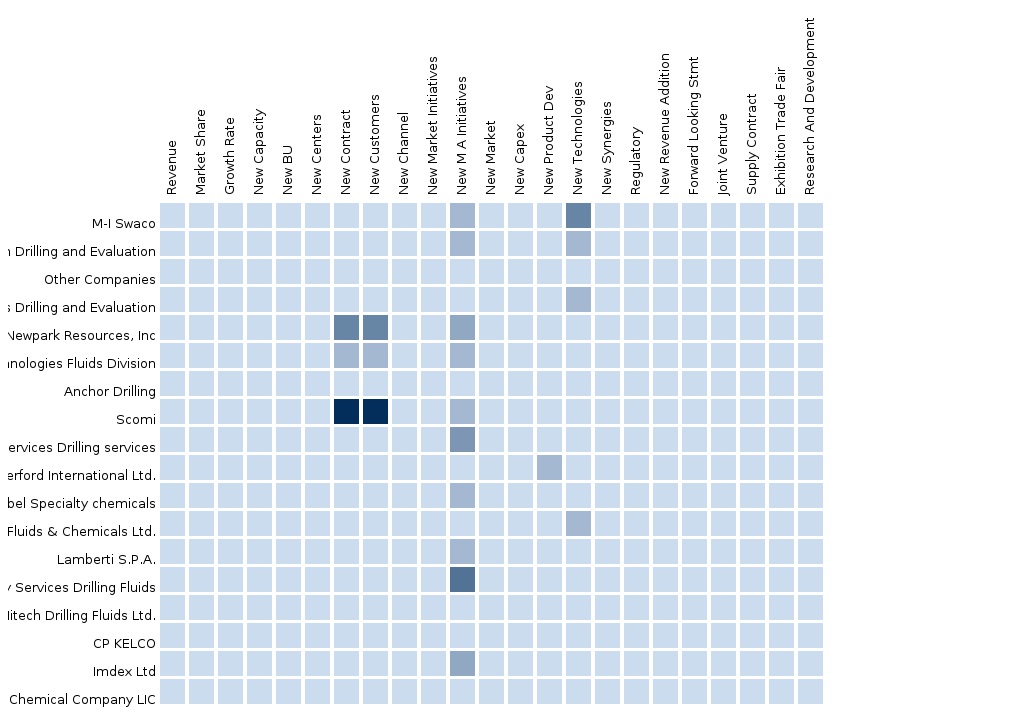
In 2013, M-I SWACO, a wholly owned subsidiary of Schlumberger, held the leading position in the drilling and completion fluid market. In recent years, the company has adopted the strategies of new technology launch, new contracts, expansion, and new product launch to ensure its dominant position in drilling and completion fluid market. Other key players of this regional market are Halliburton (U.S.), Baker Hughes (U.S.), New Park Resources Inc. (U.S.), Tetra Technologies Inc. (U.S.), Scomi Group BHD (Malaysia), and Weatherford International Ltd. (Switzerland).
Scope of the Report
The drilling and completion fluid market is segmented on the basis of its application, type, and country.
Drilling and Completion Fluid Market, By Application
- Onshore
- Offshore
Drilling and Completion Fluid Market, By Type
- Water-based Fluid System
- Oil-based Fluid System
- Synthetic-based Fluid System
- Other Fluid System
Drilling and Completion Fluid Market, By Country
- Egypt
- Algeria
- Angola
- Libya
- Nigeria
Table of Contents
1 Introduction (Page No. - 9)
1.1 Objectives of the Study
1.2 Market Segmentation and Coverage
1.3 Stakeholders
2 Research Methodology (Page No. - 11)
2.1 Integrated Ecosystem of Africa Drilling and Completion Fluids Market
2.2 Arriving at the Africa Drilling and Completion Fluids Market
2.2.1 Top-Down Approach
2.2.2 Bottom-Up Approach
2.2.3 Demand Side Approach
2.2.4 Macro Indicator-Based Approach
2.3 Assumptions
3 Executive Summary (Page No. - 18)
4 Market Overview (Page No. - 20)
4.1 Introduction
4.2 Africa Drilling and Completion Fluids Market: Comparison With Parent Market (USD MN)
4.3 Market Drivers and Inhibitors
4.4 Key Market Dynamics
4.5 Demand Side Analysis
5 Africa Drilling and Completion Fluids Market, By Application (Page No. - 26)
5.1 Introduction
5.2 Africa Drilling and Completion Fluids Market, By Application
5.3 Africa Onshore Drilling and Completion Fluids Market, By Country
5.4 Africa Offshore Drilling and Completion Fluids Market, By Country
5.5 Sneak View: Africa Drilling and Completion Fluids Market, By Application
6 Africa Drilling and Completion Fluids Market, By Type (Page No. - 32)
6.1 Introduction
6.2 Africa Drilling and Completion Fluids Market, By Country
6.3 Africa Oil-Based System Market, By Country
6.4 Africa Synthetic-Based System Market, By Country
6.5 Sneak View: Africa Drilling and Completion Fluids Market, By Type (2013)
7 Africa Drilling and Completion Fluids Market, By Country (Page No. - 37)
7.1 Introduction
7.2 Egypt Drilling and Completion Fluids Market
7.2.1 Egypt Drilling and Completion Fluids Market, By Application
7.2.2 Egypt Drilling and Completion Fluids Market, By Type
7.3 Algeria Drilling and Completion Fluids Market
7.3.1 Algeria Drilling and Completion Fluids Market, By Application
7.3.2 Algeria Drilling and Completion Fluids Market, By Type
7.4 Angola Drilling and Completion Fluids Market
7.4.1 Angola Drilling and Completion Fluids Market, By Application
7.4.2 Angola Drilling and Completion Fluids Market, By Type
7.5 Libya Drilling and Completion Fluids Market
7.5.1 Libya Drilling and Completion Fluids Market, By Application
7.5.2 Libya Drilling and Completion Fluids Market, By Type
7.6 Nigeria Drilling and Completion Fluids Market
7.6.1 Nigeria Drilling and Completion Fluids Market, By Application
7.6.2 Nigeria Drilling and Completion Fluids Market, By Type
8 Africa Drilling and Completion Fluids Market: Competitive Landscape (Page No. - 56)
8.1 Africa Drilling and Completion Fluids Market: Company Share Analysis
8.2 Competitive Landscape
8.3 Contracts & Agreements
8.4 New Technology Developments
8.5 New Product Developments
8.6 Other Developments
9 Africa Drilling and Completion Fluids Market, By Company (Page No. - 61)
(Overview, Products & Services, Strategies & Insights, Developments and MMM View)*
9.1 M-I Swaco
9.2 Halliburton
9.3 Baker Hughes Inc.
9.4 Newpark Resources Inc.
9.5 Tetra Technologies Inc.
9.6 Weatherford International
9.7 SCOMI Group BHD
*Details on Overview, Products & Services, Strategies & Insights, Developments and Mnm View Might Not be Captured in Case of Unlisted Companies.
10 Introducing RT: Real Time Market Intelligence (Page No. - 85)
10.1 RT Snapshots
List of Tables (52 Tables)
Table 1 Global Drilling and Completion Fluid Peer Market Size, 2013 (USD MN)
Table 2 Africa Drilling and Completion Fluids Market,By Application, 2013 (USD MN)
Table 3 Africa Drilling and Completion Fluids Market, By Country,2013 (Number of Well Count)
Table 4 Africa Drilling and Completion Fluids Market, Comparison With Parent Market, 2014 – 2019 (USD MN)
Table 5 Africa Drilling and Completion Fluids Market: Drivers and Inhibitors
Table 6 Africa Drilling and Completion Fluids Market, By Type, 2013 – 2019 (USD MN)
Table 7 Africa Drilling and Completion Fluids Market, By Application,2013 - 2019 (USD MN)
Table 8 Africa Drilling and Completion Fluids Market, By Application,2013 - 2019 (USD MN)
Table 9 Africa Onshore Drilling and Completion Fluids Market, By Country,2013 - 2019 (USD MN)
Table 10 Africa Offshore Drilling and Completion Fluids Market, By Country,2013 - 2019 (USD MN)
Table 11 Sneak View: Africa Drilling and Completion Fluids Market, By Application, 2014 & 2019 (USD MN)
Table 12 Africa Drilling and Completion Fluids Market, By Type, 2013-2019 (USD MN)
Table 13 Africa Water –Based System Market, By Country, 2013–2019 (USD MN)
Table 14 Africa Oil-Based System Market, By Country, 2013 - 2019 (USD MN)
Table 15 Africa Synthetic-Based System Market, By Country, 2013 - 2019 (USD MN)
Table 16 Africa Drilling and Completion Fluids Market, By Country,2013 - 2019 (USD MN)
Table 17 Egypt Drilling and Completion Fluids Market, By Application,2013-2019 (USD MN)
Table 18 Egypt Drilling and Completion Fluids Market, By Type, 2013 - 2019 (USD MN)
Table 19 Algeria Drilling and Completion Fluids Market, By Application,2013 - 2019 (USD MN)
Table 20 Algeria Drilling and Completion Fluids Market, By Type,2013 - 2019 (USD MN)
Table 21 Angola Drilling and Completion Fluids Market, By Application,2013 - 2019 (USD MN)
Table 22 Angola Drilling and Completion Fluids Market, By Type,2013 - 2019 (USD MN)
Table 23 Libya Drilling and Completion Fluids Market, By Application,2013 - 2019 (USD MN)
Table 24 Libya Drilling and Completion Fluids Market, By Type, 2013 - 2019 (USD MN)
Table 25 Nigeria Drilling and Completion Fluids Market, By Application,2013 - 2019 (USD MN)
Table 26 Nigeria Drilling and Completion Fluids Market, By Type,2013 – 2019 (USD MN)
Table 27 Africa Drilling and Completion Fluids Market: Company Share Analysis, 2013 (%)
Table 28 Africa Drilling and Completion Fluids Market: Contracts & Agreements
Table 29 Africa Drilling and Completion Fluids Market: New Technology Developments
Table 30 Africa Drilling and Completion Fluids Market: New Product Developments
Table 31 Africa Drilling and Completion Fluids Market: Other Developments
Table 32 Key Financials, 2009 - 2013 (USD MN)
Table 33 Net Sales, By Business Segment, 2009-2013 (USD MN)
Table 34 Net Sales, By Geographical Segment, 2009-2013 (USD MN)
Table 35 Key Financials, 2009 - 2013 (USD MN)
Table 36 Net Sales, By Business Segment, 2009-2013 (USD MN)
Table 37 Net Sales, By Geographical Segment, 2009-2013 (USD MN)
Table 38 Key Financials, 2009 - 2013 (USD MN)N
Table 39 Net Sales, By Business Segment, 2009-2013 (Usd Million)
Table 40 Net Sales, By Geographical Segment, 2009-2013 (USD MN)
Table 41 Key Financials, 2009 - 2013 (USD MN)
Table 42 Net Sales, By Business Segment, 2009-2013 (USD MN)
Table 43 Net Sales, By Geographical Segment, 2009-2013 (USD MN)
Table 44 Key Financials, 2009 - 2013 (USD MN)
Table 45 Net Sales, By Business Segment, 2009-2013 (USD MN)
Table 46 Net Sales, By Geographical Segment, 2009-2013 (USD MN)
Table 47 Key Financials, 2009 - 2013 (USD MN)
Table 48 Net Sales, By Business Segment, 2009-2013 (USD MN)
Table 49 Net Sales, By Geographical Segment, 2009-2013 (USD MN)
Table 50 Key Financials, 2010 - 2014 (USD MN)
Table 51 Net Sales, By Business Segment, 2010-2014 (USD MN)
Table 52 Net Sales, By Geographical Segment, 2010-2014 (USD MN)
List of Figures (52 Figures)
Figure 1 Africa Drilling and Completion Fluids Market: Segmentation & Coverage
Figure 2 Africa Drilling and Completion Fluids Market: Integrated Ecosystem
Figure 3 Research Methodology
Figure 4 Top-Down Approach
Figure 5 Bottom-Up Approach
Figure 6 Demand Side Approach
Figure 7 Macro Indicator-Based Approach (2013)
Figure 8 Africa Drilling and Completion Fluids Market Snapshot
Figure 9 Africa Drilling and Completion Fluids Market: Growth Aspects
Figure 10 Africa Drilling and Completion Fluids Market, By Type and Country,2013 (USD MN)
Figure 11 Africa Drilling and Completion Fluids Market, By Application,2014 - 2019 (USD MN)
Figure 12 Africa Drilling and Completion Fluids Market, By Application,(2014-2019)
Figure 13 Africa Onshore Drilling and Completion Fluids Market, By Country,2013-2019 (USD MN)
Figure 14 Africa Offshore Drilling and Completion Fluids Market, By Country,2013 - 2019 (USD MN)
Figure 15 Sneak View: Africa Drilling and Completion Fluids Market, By Application, 2014 & 2019 (USD MN)
Figure 16 Africa Drilling and Completion Fluids Market, By Type,2014 & 2019 (USD MN)
Figure 17 Africa Water-Based System Market, By Country, 2013–2019 (USD MN)
Figure 18 Africa Oil-Based System Market, By Country, 2013 - 2019 (USD MN)
Figure 19 Africa Synthetic-Based System Market, By Country, 2013 - 2019 (USD MN)
Figure 20 Africa Drilling and Completion Fluids Market: Growth Analysis,By Country, 2014 & 2019 (USD MN)
Figure 21 Egypt Drilling and Completion Fluids Market Overview, 2014 & 2019
Figure 22 Egypt Drilling and Completion Fluids Market, By Application,2013-2019 (USD MN)
Figure 23 Egypt Drilling and Completion Fluids Market: Application Snapshot
Figure 24 Egypt Drilling and Completion Fluids Market, By Type, 2013 - 2019 (USD MN)
Figure 25 Egypt Drilling and Completion Fluids Market Share (Value), By Type,2014 & 2019 (%)
Figure 26 Algeria Drilling and Completion Fluids Market Overview, 2014 & 2019
Figure 27 Algeria Drilling and Completion Fluids Market, By Application,2013-2019 (USD MN)
Figure 28 Algeria Drilling and Completion Fluids Market: Application Snapshot
Figure 29 Algeria Drilling and Completion Fluids Market, By Type,2013 - 2019 (USD MN)
Figure 30 Algeria Drilling and Completion Fluids Market Share (Value), By Type,2014-2019 (%)
Figure 31 Angola Drilling and Completion Fluids Market Overview, 2014 & 2019
Figure 32 Angola Drilling and Completion Fluids Market, By Application,2013 - 2019 (USD MN)
Figure 33 Angola Drilling and Completion Fluids Market: Application Snapshot
Figure 34 Angola Drilling and Completion Fluids Market, By Type,2013 - 2019 (USD MN)
Figure 35 Angola Drilling and Completion Fluids Market, By Type, 2014-2019 (%)
Figure 36 Libya Drilling and Completion Fluids Market Overview, 2014 & 2019
Figure 37 Libya Drilling and Completion Fluids Market, By Application,2013 - 2019 (USD MN)
Figure 38 Libya Drilling and Completion Fluids Market: Application Snapshot
Figure 39 Libya Drilling and Completion Fluids Market, By Type, 2013 - 2019 (USD MN)
Figure 40 Libya Drilling and Completion Fluids Market, By Type, 2014-2019 (%)
Figure 41 Nigeria Drilling and Completion Fluids Market Overview, 2014 & 2019
Figure 42 Nigeria Drilling and Completion Fluids Market, By Application,2013 - 2019 (USD MN)
Figure 43 Nigeria Drilling and Completion Fluids Market: Application Snapshot
Figure 44 Nigeria Drilling and Completion Fluids Market, By Type,2013 - 2019 (USD MN)
Figure 45 Nigeria Drilling and Completion Fluids Market, By Type, 2014-2019 (%)
Figure 46 Africa Drilling and Completion Fluids Market: Company Share Analysis, 2013 (%)
Figure 47 M-I Swaco Revenue Mix, 2013 (%)
Figure 48 Halliburton Revenue Mix, 2013 (%)
Figure 49 Baker Hughes Revenue Mix, 2013 (%)
Figure 50 New Park Resources Inc. Revenue Mix, 2013 (%)
Figure 51 Tetra Technologies Inc. Revenue Mix, 2013 (%)
Figure 52 Weatherford Revenue Mix, 2013 (%)
The drilling and completion fluid market in Africa is segmented on the basis of application, type, and country. Onshore and offshore are two different application segments. Onshore application has the larger market share of around 63% in 2014, followed by offshore. However, offshore application has high growth potential and is expected to increase its market share rapidly. Offshore application segment is expected to grow at a CAGR of 5.4% from 2014 to 2019. The overall drilling and completion fluid market is estimated to grow at a CAGR of 5.2% from 2014 to 2019.
On the basis of country, the drilling and completion fluid market is classified into Egypt, Angola, Algeria, Libya, and Nigeria. In 2014, Egypt dominated the drilling and completion fluid market with the highest market share. However, Libya is expected to grow at the highest CAGR from 2014 to 2019 owing to increasing exploration and drilling activities in both onshore as well as offshore areas.
The various types of fluids include water-based fluids system, oil-based fluids system, synthetic-based fluids system, and other drilling fluids (aerated, foam, gaseous, and air-based). It has been estimated that in coming years, Africa would witness extensive usage of water-based fluid system owing to its cost effectiveness and minimal environmental impacts. Synthetic-based fluid system segment is expected to grow at a CAGR of 5.4% from 2014 to 2019, followed by oil-based fluid system.
The various factors driving the growth of drilling and completion fluid market are extensive drilling activities, increase in production of oil and gas, technological advancements, increase in exploration for shale gas and coal bed methane, and development of advanced drilling fluid chemicals. However, stringent government regulations and increasing environmental concerns are some of the key challenges faced by drilling and completion fluid market players.
Key players operating in the African drilling and completion fluid market are M-I SWACO (U.S.), Halliburton, Baker Hughes (U.S.), New Park Resources Inc. (U.S.), Tetra Technologies Inc. (U.S.), Scomi Group BHD (Malaysia), and Weatherford International Ltd. (Switzerland). The key growth strategies followed by the market players are new contracts, new technology and product launches, agreements, joint ventures, collaborations, expansions, and acquisitions.
Please visit https://www.micromarketmonitor.com/custom-research-services.html to specify your custom Research Requirement


