

Global Water Soluble Fertilizers in Field crops Market
- Publish Date: Upcoming


Water soluble fertilizers can reduce normal fertilizer usage by 20%. Due to its high solubility, applying it on the field crops leaves no traces at the time of harvesting. Its nature of dissolving, makes it reach to the root zone rapidly and benefiting the crops in quality of crops.
The water soluble fertilizers in field crops market were valued at $ 2.5 billion in 2013, to grow at a CAGR of 5.0% annually. Its estimated to reach at $ 3.2 billion by 2018. It accounts for 21.7% of the global water soluble fertilizers market share. The global water soluble fertilizers in field crops market covers countries such as North America,Europe (major market), and Asia-Pacific that accounted market share of 24.6%, 40.4%, and 20.1% respectively in the year 2013.
What makes our report unique?
- You can request a 10% customization in the research that matches your requirement. For example, you could request a deep dive research in any specific region, technology, or application.
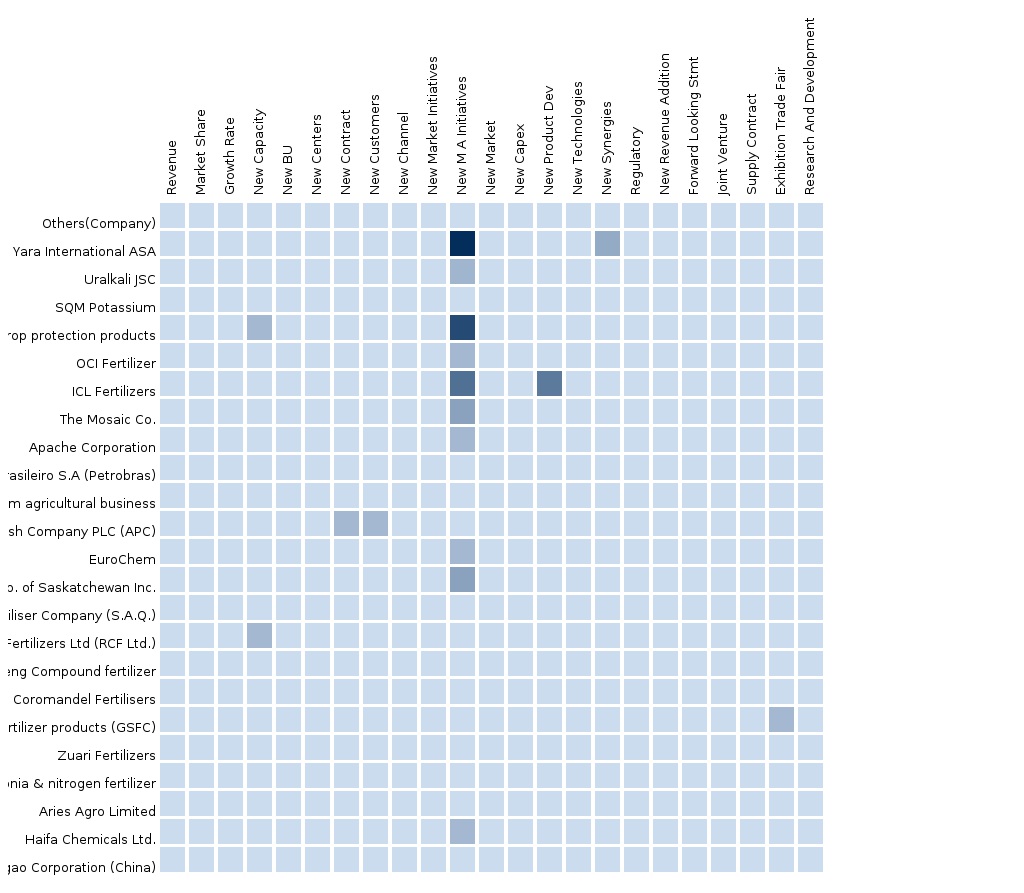
- This report provides a competitive landscape of the top players. Under the strategic benchmarking section, we will provide you with their key developments along with the impacts that include new product developments, M&A, a strategic focus on any specific application, technology, and geography. Under the Financials section, we will provide you with details that span Capex (Investments), revenues, EBITDA, etc. Under the operational insights section, we will provide you with the new capacities added, new centers, and new key employments. Under the sales and marketing section, we will provide you with insights on new contracts (available on the public domain), new distribution channels added, new marketing initiatives, etc.
Key questions answered
- What are the market estimates and forecasts based on which the markets are doing well, and which are not?
- What is the competitive landscape; who are the main players in each segment; what are their strategic directives, operational strengths, key selling products, and product pipelines? Who is doing what?
Audience for this report
- Global WSF companies
- WSF manufactures
- WSF traders, distributors, and suppliers
- Governmental and research organizations
- Associations and industry bodies.
Customization Options
Along with the market data, you can also customize MMM assessments that meet your company's specific needs. Customize to get comprehensive industry standard and deep-dive analysis of the following parameters:
Climate Support
- To study the geographical/climatic conditions supporting a particular WSF (nitrogenous, phosphatic, potassic, and micronutrients) for increasing the land productivity of field crops (wheat, barley, corn, and others).
- Areas with sun exposure and less humidity are suitable for wheat production.
Major Regions
- To study the consumption pattern of field crops (wheat, barley, corn, and others) in a particular region which will help to determine the market potential.
WSF Usage Data
- Type of WSF (nitrogenous, phosphatic, potassic, and micronutrients) suitable for particular field crops (corn, wheat, barley, and others)
Product Mapping
- Analysis of product offerings of the competitor company and its detailed comparison mapped at country level.
- Product matrix for the comparative analysis of the products available in the same segment for the same target of the market.
Trade Analysis
- WSF imported and exported annually in each country tracked till sub-segment level (nitrogenous, phosphatic, potassic, and micronutrients)
Historical Data and Trends
- Country-specific target markets in terms of agricultural, irrigated, organic, and arable land
- Country-specific area under each crop and crop type
- Country-specific crop production in terms of value and volume
| Table of Contents |
| 1. INTRODUCTION |
| 1.1. OBJECTIVES |
| 1.2. REPORT DESCRIPTION |
| 1.3. MARKETS COVERED |
| 1.4. RESEARCH METHODOLOGY |
| 2. EXECUTIVE SUMMARY |
| 3. MARKET OVERVIEW |
| 3.1. INTRODUCTION |
| 3.2. MARKET DYNAMICS |
| 3.2.1. DRIVERS |
| 3.2.2. RESTRAINTS |
| 4. WATER SOLUBLE FERTILIZERS MARKET, BY GEOGRAPHY, 2010-2019 |
| 4.1. NORTH AMERICA |
| 4.2. EUROPE |
| 4.3. ASIA-PACIFIC |
| 4.4. ROW |
| 5. WATER SOLUBLE FERTILIZERS MARKET, BY REGION, 2010-2019 |
| 5.1. NORTH AMERICA |
| 5.1.1 U.S |
| 5.1.2 CANADA |
| 5.1.3 MEXICO |
| 5.2. EUROPE |
| 5.2.1. RUSSIA |
| 5.2.2 SPAIN |
| 5.2.3 UKRAINE |
| 5.2.4GERMANY |
| 5.2.5ITALY |
| 5.2.6UNITED KINGDOM |
| 5.2.7OTHERS |
| 5.3 APAC |
| 5.2.1. INDIA |
| 5.2.2 CHINA |
| 5.2.3 ISRAEL |
| 5.2.4 AUSTRALIA |
| 5.2.5 MALAYSIA |
| 5.2.6 OTHERS |
| 5.4 ROW |
| 5.4.1 BRAZIL |
| 5.4.2 SOUTH AFRICA |
| 5.4.3 OTHERS |
| 6. WATER SOLUBLE FERTILIZERS IN FIELD CROPS MARKET, BY GEOGRAPHY, 2010-2019 |
| 6.1. NORTH AMERICA |
| 6.2. EUROPE |
| 6.3. ASIA-PACIFIC |
| 6.4. ROW |
| 7. WATER SOLUBLE FERTILIZERS IN FIELD CROPS MARKET, BY REGION, 2010-2019 |
| 7.1. NORTH AMERICA |
| 7.1.1 U.S |
| 7.1.2 CANADA |
| 7.1.3 MEXICO |
| 7.2. EUROPE |
| 7.2.1. RUSSIA |
| 7.2.2 SPAIN |
| 7.2.3 UKRAINE |
| 7.2.4GERMANY |
| 7.2.5ITALY |
| 7.2.6UNITED KINGDOM |
| 7.2.7OTHERS |
| 7.3 APAC |
| 7.2.1. INDIA |
| 7.2.2 CHINA |
| 7.2.3 ISRAEL |
| 7.2.4 AUSTRALIA |
| 7.2.5 MALAYSIA |
| 7.2.6 OTHERS |
| 7.4 ROW |
| 7.4.1 BRAZIL |
| 7.4.2 SOUTH AFRICA |
| 7.4.3 OTHERS |
| 8. WATER SOLUBLE FERTILIZERS IN FIELD CROPS MARKET: DEVELOPMENTS |
| 8.1. OVERVIEW |
| 8.2. CONTRACTS & AGREEMENTS |
| 8.3. EXPANSIONS |
| 8.4. MERGERS & ACQUISITIONS |
| 8.5. NEW PRODUCT LAUNCHES |
| 8.6. OTHER DEVELOPMENTS |
| 9. COMPANY PROFILES |
| 9.1. AGRIUM |
| 9.2. ISRAEL CHEMICAL |
| 9.3. IOWA FERTILIZER |
| 9.4. QATAR FERTILIZER |
| 9.5. YARA INTERNATIONAL |
| 9.6. SINOCHEM FERTILIZER CO. LTD. |
| List of Tables | |
| TABLE 1: | WATER SOLUBLE FERTILIZERS MARKET, BY GEOGRAPHY, 2010-2019 (USD MILLION) |
| TABLE 2: | WATER SOLUBLE FERTILIZERS MARKET, BY GEOGRAPHY, 2010-2019 (THOUSAND METRIC TONS) |
| TABLE 3: | WATER SOLUBLE FERTILIZERS MARKET, NORTH AMERICA, 2010-2019 (USD MILLION) |
| TABLE 4: | WATER SOLUBLE FERTILIZERS MARKET, NORTH AMERICA, 2010-2019 (THOUSAND METRIC TONS) |
| TABLE 5: | WATER SOLUBLE FERTILIZERS MARKET, APAC, 2010-2019 (USD MILLION & THOUSAND METRIC TONS) |
| TABLE 6: | WATER SOLUBLE FERTILIZERS MARKET, EUROPE, 2010-2019 (USD MILLION & THOUSAND METRIC TONS) |
| TABLE 7: | WATER SOLUBLE FERTILIZERS MARKET, ROW, 2010-2019 (USD MILLION & THOUSAND METRIC TONS) |
| TABLE 8: | WATER SOLUBLE FERTILIZERS IN FIELD CROPS MARKET, BY GEOGRAPHY, 2010-2019 |
| TABLE 9: | WATER SOLUBLE FERTILIZERS IN FIELD CROPS MARKET, BY REGION, 2010-2019 |
| TABLE 10: | EXPANSIONS, 2012-2014 |
| TABLE 11: | MERGERS & ACQUISITIONS, 2012-2014 |
| TABLE 12: | NEW PRODUCT LAUNCH, 2012-2014 |
| TABLE 13: | OTHER DEVELOPMENTS, 2012-2014 |
| TABLE 14: | AGRIUM: FINANCIALS |
| TABLE 15: | AGRIUM: PRODUCTS & EQUIPMENT/SERVICES |
| TABLE 16: | ISRAEL CHEMICAL: FINANCIALS |
| TABLE 17: | ISRAEL CHEMICAL: PRODUCTS & EQUIPMENT/SERVICES |
| TABLE 18: | IOWA FERTILIZER: FINANCIALS |
| TABLE 19: | IOWA FERTILIZER: PRODUCTS & EQUIPMENT/SERVICES |
| TABLE 20: | QATAR FERTILIZER: FINANCIALS |
| TABLE 21: | QATAR FERTILIZER: PRODUCTS & EQUIPMENT/SERVICES |
| TABLE 22: | YARA INTERNATIONAL: FINANCIALS |
| TABLE 23: | YARA INTERNATIONAL: PRODUCTS & EQUIPMENT/SERVICES |
| TABLE 24: | SINOCHEM FERTILIZER CO. LTD.: FINANCIALS |
| TABLE 25: | SINOCHEM FERTILIZER CO. LTD.: PRODUCTS & EQUIPMENT/SERVICES |
| List of Figures | ||||
| Figure 1 Research Methodology | ||||
| Figure 2 Data Triangulation Methodology | ||||
| Figure 3 Value Chain Analysis of Transformer Market | ||||
| Figure 4 Porter’s Five Forces Analysis | ||||
| Figure 5 Market Share Analysis: By Company, 2013 | ||||
| Figure 6 Market Share Analysis: By Company, 2014 | ||||
| Figure 7 Contract Agreements Analysis, 2012-2014 | ||||
| Figure 8 Expansions Analysis, 2012-2014 | ||||
| Figure 9 Mergers & Acquisitions Analysis, 2012-2014 | ||||
| Figure 10 New Products Launch Analysis, 2012-2014 | ||||
| Figure 11 Product Vs Application Matrix | ||||
Please fill in the form below to receive a free copy of the Summary of this Report
Please visit https://www.micromarketmonitor.com/custom-research-services.html to specify your custom Research Requirement


