

North America Food & Beverages Texturants Market by Application (Frozen Desserts, Bakery & Confectionery, Sauces, Dressings & Condiments, Beverages, Meat & Poultry Products, Snacks & Savory), by Function (Thickening Texturants, Gelling Texturants, Emulsifying Texturants, Stabilizing Texturants), by Geography (U.S., Canada, Mexico) - Analysis and Forecast to 2019
- Publish Date: May 2015


The North American food & beverages texturants market is estimated to witness a CAGR of 5.3%, during the forecast period, 2014 to 2019. The texturizing agents are specifically used to provide smoothness, creaminess, clarity, thickness, pulpiness to enhance both flavor as well as appearance of the food products. These texturizing agents play a key role in the commercial production of food products by way of value addition.
On the basis of function, the North American food & beverages texturants market is segmented into thickening agents, gelling agents, emulsifying agents, and stabilizing agents. These texturants are used to amplify the properties of the finished food products. The cost to produce synthetic colors is comparatively lower than that of natural colors and as such synthetic colors are sold at competitive prices to influence the consumers’ preference to purchase.
The North American food & beverages texturants market is dominated by the U.S., followed by Mexico. The demand for texturizing agents has been flexible in the U.S owing to its usage in the premium and processed food products. The increase in the consumption of the texturizing agents in functional foods, frozen products, premium bakery, and confectionery products is fueling the growth of the North American food & beverages texturizing market.
The North American food & beverages texturants market is a competitive market. The firms such as, Cargill, Inc. (U.S.), E. I. du Pont de Nemours and Company (U.S.), Ashland Inc. (U.S.), and others are continuously expanding their market share in the North American food & beverages texturants market. To gain a significant portion of the market share, these companies are adapting numerous market strategies including innovative product developments, partnerships, mergers & acquisitions, and expansions of the existing facilities. Apart from these companies, a large number of smaller firms are also present in the North American food & beverages texturants market.
Scope of the Report
This research report categorizes the North American food & beverages texturants market into the following segments and sub-segments:
North America food & beverages texturants market, by Type
- Thickening agents
- Gelling agents
- Emulsifying agents
- Stabilizing agents
- Other agents
North America food & beverages texturants market, by Application
- Dairy and frozen desserts
- Bakery & confectionary
- Sauces, dressings & condiments
- Beverages
- Meat & poultry products
- Snacks & savory
- Others
North America food & beverages texturants market, by Geography
- U.S.
- Canada
- Mexico
Table of Contents
1 Introduction (Page No. - 11)
1.1 Objectives of the Study
1.2 Market Segmentation & Coverage
1.3 Stakeholders
1.4 Assumptions
2 Research Methodology (Page No. - 15)
2.1 Integrated Ecosystem Food & Beverages Texturants Market
2.2 Arriving at the Food & Beverages Texturants Market Size
2.2.1 Top-Down Approach
2.2.2 Bottom-Up Approach
2.2.3 Macroindicator Based Approach
3 Executive Summary (Page No. - 21)
4 Market Overview (Page No. - 23)
4.1 Introduction
4.2 Food & Beverages Texturants Market: Comparison With Parent Market
4.3 Key Market Dynamics
4.4 Demand Side Analysis
4.5 Market Drivers and Inhibitors
5 North America Food & Beverages Texturants Market, By Application (Page No. - 33)
5.1 Demand Side Analysis
5.2 North America Food & Beverages Texturants Market in Frozen Desserts, By Geography
5.3 North America Food & Beverages Texturants Market in Bakery & Confectionery, By Geography
5.4 North America Food & Beverages Texturants Market in Sauces, Dressings & Condiments, By Geography
5.5 North America Food & Beverages Texturants Market in Beverages, By Geography
5.6 North America Food & Beverages Texturants Market in Meat & Poultry Products, By Geography
5.7 North America Food & Beverages Texturants Market in Snacks & Savory, By Geography
5.8 Sneak View : North America Food & Beverages Texturants Market, By Type
6 North America Food & Beverages Texturants Market, By Function (Page No. - 49)
6.1 Introduction
6.2 North America Food & Beverages Texturants Market, By Function : Comparison With Parent Market
6.3 North America Thickening Texurants Market, By Geography
6.4 North America Gelling Texturants Market, By Geography
6.5 North America Emulsifying Texturants Market, By Geography
6.6 North America Stabilizing Texturants Market, By Geography
7 North America Food & Beverages Texturants Market, By Geography (Page No. - 59)
7.1 Introduction
7.2 U.S. Food & Beverages Texturants Market
7.2.1 U.S. Food & Beverages Texturants Market, By Application
7.2.2 U.S. Food & Beverages Texturants Market, By Function
7.3 Canada Food & Beverages Texturants Market
7.3.1 Canada Food & Beverages Texturants Market, By Application
7.3.2 Canada Food & Beverages Texturants Market, By Function
7.4 Mexico Food & Beverages Texturants Market
7.4.1 Mexico Food & Beverages Texturants Market, By Application
7.4.2 Mexico Food & Beverages Texturants Market, By Function
8 North America Food & Beverages Texturants Market: Competitive Landscape (Page No. - 77)
8.1 North America Food & Beverages Texturants Market: Company Share Analysis
8.2 Company Presence in North America Food & Beverages Texturants Market, By Function
8.3 Mergers & Acquisitions
8.4 Investments and Expansions
9 North America Food & Beverages Texturants Market, By Company (Page No. - 81)
(Overview, Financials, Products & Services, Strategy, and Developments)*
9.1 E.I. Du Pont De Nemours and Company
9.2 Cp Kelco
9.3 Cargill, Incorporated.
9.4 Ashland Incorporated
9.5 Rousselot
*Details on Overview, Financials, Product & Services, Strategy, and Developments Might Not be Captured in Case of Unlisted Company
10 Appendix (Page No. - 93)
10.1 Customization Options
10.1.1 Regulation Structure
10.1.2 Trend Data
10.1.3 Competitive Intelligence
10.1.4 Perception Matrix
10.2 Related Reports
10.3 Introducing RT: Real Time Market Intelligence
10.4 RT Snapshots
List of Tables (59 Tables)
Table 1 Food & Beverages Texturants Peer Market Size, 2014 (USD MN)
Table 2 North America Food & Beverages Texturants Market: Macro Indicators, By Geography, 2014 (Thousands)
Table 3 North America Food & Beverages Texturants Market: Comparison With Parent Market, 2013 – 2019 (USD MN)
Table 4 North America Food & Beverages Texturants Market: Comparison With Parent Market, 2013 – 2019 (KT)
Table 5 North America Food & Beverages Texturants Market, By Application, 2013 - 2019 (USD MN)
Table 6 North America Food & Beverages Texturants Market, By Application, 2013 - 2019 (KT)
Table 7 North America Food & Beverages Texturants Market, By Function, 2013 - 2019 (USD MN)
Table 8 North America Food & Beverages Texturants Market, By Function, 2013 - 2019 (KT)
Table 9 North America Food & Beverages Texturants Market, By Geography, 2013 - 2019 (USD MN)
Table 10 North America Food & Beverages Texturants Market, By Geography, 2013 - 2019 (KT)
Table 11 North America Food & Beverages Texturants Market : Comparison With Application Markets, 2013 - 2019 (USD MN)
Table 12 North America Food & Beverages Texturants Market: Drivers and Inhibitors
Table 13 North America Food & Beverages Texturants: Market, By Application, 2013 - 2019 (USD MN)
Table 14 North America Food & Beverages Texturants Market, By Application, 2013 - 2019 (KT)
Table 15 North America Food & Beverages Texturants Market in Frozen Desserts, By Geography, 2013 - 2019 (USD MN)
Table 16 North America Food & Beverages Texturants in Frozen Desserts, By Geography, 2013 - 2019 (KT)
Table 17 North America Food & Beverages Texturants Market in Bakery & Confectionery,By Geography, 2013 - 2019 (USD MN)
Table 18 North America Food & Beverages Texturants Market in Bakery & Confectionery, By Geography, 2013 - 2019 (KT)
Table 19 North America Food & Beverages Texturants Market in Sauces, Dressings & Condiments ,By Geography, 2013 - 2019 (USD MN)
Table 20 North America Food & Beverages Texturants Market in Sauces,Dressings & Condiments, By Geography, 2013 - 2019 (KT)
Table 21 North America Food & Beverages Texturants Market in Beverages, By Geography, 2013 - 2019 (USD MN)
Table 22 North America Food & Beverages Texturants Market in Beverages, By Geography, 2013 - 2019 (KT)
Table 23 North America Food & Beverages Texturants Market in Meat & Poultry Products, By Geography, 2013 - 2019 (USD MN)
Table 24 North America Food & Beverages Texturants Market in Meat & Poultry Products, By Geography, 2013 - 2019 (KT)
Table 25 North America Food & Beverages Texturants Market in Snacks & Savory, By Geography, 2013 - 2019 (USD MN)
Table 26 North America Food & Beverages Texturants Market in Snacks & Savory, By Geography, 2013 - 2019 (KT)
Table 27 North America Food & Beverages Texturants Market, By Function, 2013 - 2019 (USD MN)
Table 28 North America Food & Beverages Texturants Market, By Function, 2013 - 2019 (KT)
Table 29 North America Food & Beverages Texturants Market: Function Comparison With Parent Market, 2013–2019 (USD MN)
Table 30 North America Thickening Texturants Market, By Geography, 2013–2019 (USD MN)
Table 31 North America Thickening Texturants Market, By Geography, 2013–2019 (KT)
Table 32 North America Gelling Texturants Market, By Geography, 2013- 2019 (USD MN)
Table 33 North America Gelling Texturants Market, By Geography, 2013 - 2019 (KT)
Table 34 North America Emulsifying Texturants Market, By Geography, 2013 - 2019 (USD MN)
Table 35 North America Emulsifying Texturants Market, By Geography, 2013 - 2019 (KT)
Table 36 North America Stabilizing Texturants Market, By Geography, 2013 - 2019 (USD MN)
Table 37 North America Stabilizing Texturants Market, By Geography, 2013 - 2019 (KT)
Table 38 North America Food & Beverages Texturants Market, By Geography, 2013 - 2019 (USD MN)
Table 39 North America Food & Beverages Texturants Market, By Geography, 2013 - 2019 (KT)
Table 40 U.S. Food & Beverages Texturants Market, By Application, 2013-2019 (USD MN)
Table 41 U.S. Food & Beverages Texturants Market, By Application, 2013-2019 (KT)
Table 42 U.S. Food & Beverages Texturants Market, By Function, 2013 - 2019 (USD MN)
Table 43 U.S Food & Beverages Texturants Market, By Function, 2013 - 2019 (KT)
Table 44 Canada Food & Beverages Texturants Market, By Application, 2013 - 2019 (USD MN)
Table 45 Canada Food & Beverages Texturants Market, By Application, 2013 - 2019 (KT)
Table 46 Canada Food & Beverages Texturants Market, By Function, 2013 - 2019 (USD MN)
Table 47 Canada Food & Beverages Texturants Market, By Function, 2013 - 2019 (KT)
Table 48 Mexico Food & Beverages Texturants Market, By Application, 2013 - 2019 (USD MN)
Table 49 Mexico Food & Beverages Texturants Market, By Application, 2013-2019 (KT)
Table 50 Mexico Food & Beverages Texturants: Market, By Function, 2013 - 2019 (USD MN)
Table 51 Mexico Food & Beverages Texturants: Market, By Function, 2013 - 2019 (KT)
Table 52 North America Food & Beverages Texturants Market: Company Share Analysis, 2014 (%)
Table 53 North America Food & Beverages Texturants Market: Mergers & Acquisitions
Table 54 North America Food & Beverages Texturants Market: Expansions
Table 55 E.I. Du Pont De Nemours and Company: Key Financials, 2009 - 2013 (USD MN)
Table 56 Cargill, Inc.: Key Operations Data, 2010 - 2014 (USD MN)
Table 57 Ashland Incorporated : Key Financials, 2010 - 2014 (USD MN)
Table 58 Ashland Incorporated: Key Financials, By Geography 2010 - 2014 (USD MN)
Table 59 Rousselot : Key Financials, 2009 - 2013 (USD MN)
List of Figures (45 Figures)
Figure 1 North America Food & Beverages Texturants Market: Segmentation & Coverage
Figure 2 Food & Beverages Texturants Market: Integrated Ecosystem
Figure 3 Top-Down Approach
Figure 4 Bottom-Up Approach
Figure 5 Macro-Indicator Based Approach
Figure 6 North America Food & Beverages Texturants Market Snapshot
Figure 7 Food & Beverages Texturants Market: Growth Aspects
Figure 8 North America Food & Beverages Texturants Market, By Application, 2014 vs 2019
Figure 9 North America Food & Beverages Texturants Functions, By Geography, 2014 (USD MN)
Figure 10 North America Food & Beverages Texturants Market: Growth Analysis, By Function, 2013–2019 (%)
Figure 11 Introduction Food & Beverages Texturants Market: Application Market Scenario
Figure 12 North America Food & Beverages Texturants Market, By Application, 2014 - 2019 (USD MN)
Figure 13 North America Food & Beverages Texturants Market, By Application, 2014 - 2019 (KT)
Figure 14 North America Food & Beverages Texturants Market in Frozen Desserts, By Geography, 2013 - 2019 (USD MN)
Figure 15 North America Food & Beverages Texturants Market in Bakery & Confectonery, By Geography, 2013 - 2019 (USD MN)
Figure 16 North America Food & Beverages Texturants Market in Sauces, Dressings & Condiments, By Geography, 2013 - 2019 (USD MN)
Figure 17 North America Food & Beverages Texturants Market in Beverages, By Geography, 2013 - 2019 (USD MN)
Figure 18 North America Food & Beverages Texturants Market in Meat & Poultry Products, By Geography, 2013 - 2019 (USD MN)
Figure 19 North America Food & Beverages Texturants Market in Snacks & Savory, By Geography, 2013 - 2019 (USD MN)
Figure 20 North America Food & Beverages Texturants Market, By Function, 2014 - 2019 (USD MN)
Figure 21 North America Food & Beverages Texturants Market, By Function, 2014 & 2019 (KT)
Figure 22 North America Food & Beverages Texturants Market, By Function Comparison With Parent Market, 2013–2019 (USD MN)
Figure 23 North America Thickening Texturants Market, By Geography, 2013–2019 (USD MN)
Figure 24 North America Gelling Texturants Market, By Geography, 2013-2019 (USD MN)
Figure 25 North America Emulsifying Texturants Market, By Geography, 2013 - 2019 (USD MN)
Figure 26 North America Stabilizing Texturants Market, By Geography, 2013 - 2019 (USD MN)
Figure 27 North America Food & Beverages Texturants Market: Growth Analysis, By Geography, 2014-2019 (USD MN)
Figure 28 North America Food & Beverages Texturants Market: Growth Analysis, By Geography, 2014-2019 (KT)
Figure 29 U.S. Food & Beverages Texturants Market Overview, 2014 & 2019 (%)
Figure 30 U.S. Food & Beverages Texturants Market, By Application, 2013-2019 (USD MN)
Figure 31 U.S. Food & Beverages Texturants Market: Application Snapshot
Figure 32 U.S. Food & Beverages Texturants Market, By Function, 2013 - 2019 (USD MN)
Figure 33 U.S. Food & Beverages Texturants Market Share, By Function, 2014-2019 (%)
Figure 34 Canada Food & Beverages Texturants Market Overview, 2014 & 2019 (%)
Figure 35 Canada Food & Beverages Texturants Market, By Application, 2013-2019 (USD MN)
Figure 36 Canada Food & Beverages Texturants Market: Application Snapshot
Figure 37 Canada Food & Beverages Texturants Market, By Function, 2013 - 2019 (USD MN)
Figure 38 Canada Food & Beverages Texturants Market Share, By Function, 2014-2019 (%)
Figure 39 Mexico Food & Beverages Texturants Market Overview, 2014 & 2019 (%)
Figure 40 Mexico Food & Beverages Texturants Market, By Application, 2013 - 2019 (USD MN)
Figure 41 Mexico Food & Beverages Texturants Market: Application Snapshot
Figure 42 Mexico Food & Beverages Texturants Market, By Function, 2013 - 2019 (USD MN)
Figure 43 Mexico Food & Beverages Texturants Market: Function Snapshot
Figure 44 North America Food & Beverages Texturants Market: Company Share Analysis, 2014 (%)
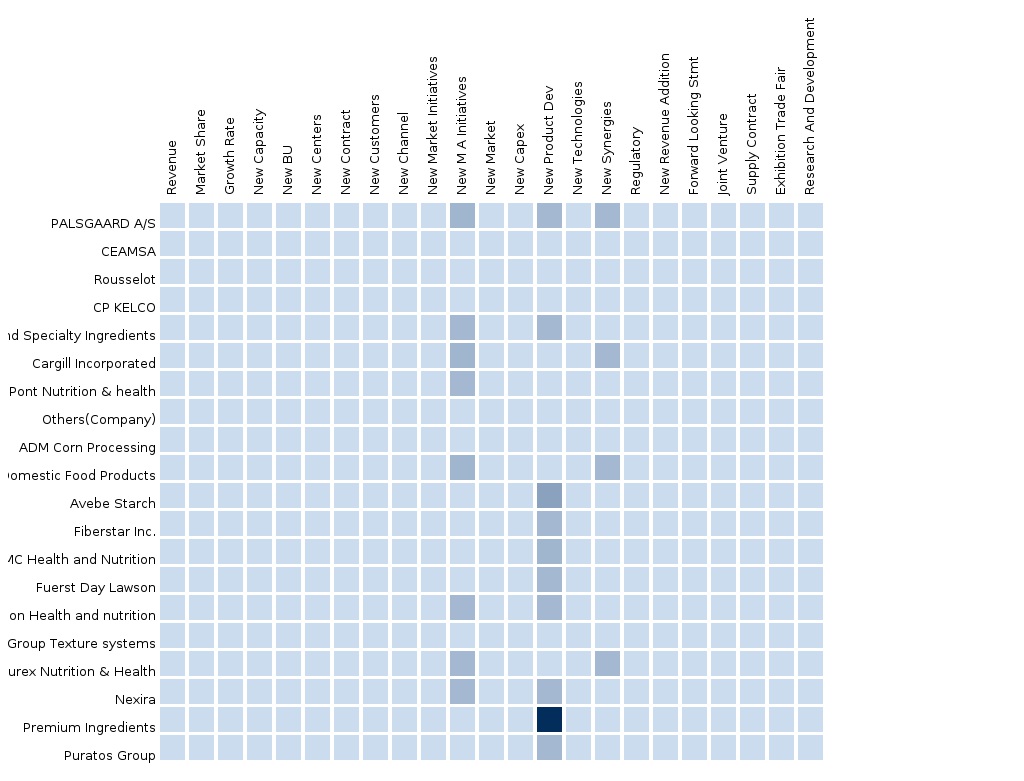
Figure 45 Food & Beverages Texturants: Company Product Coverage, By Function, 2014
The texturizing agents are specifically used to augment the flavor and appearance of the food products by enhancing their smoothness, creaminess, clarity, thickness, pulpiness. The texturizing agents play a key role in the commercial production of the food products by way of value addition. Texturizing agents mainly comprise hydrocolloids, emulsifiers, specialty starches, and a few other ingredients, such as dietary fibers, enzymes, fat replacers among others. The texturants acts as thickening agents, gelling agents, emulsifying agents, stabilizing agents ,clarifying agents, and binding agents.
The purpose of this study is to analyze the North American food & beverages texturants market. This report includes revenue forecasts, market trends, and opportunities in the North American food & beverages texturants market, for the forecast period, 2014 to 2019. The analysis has been conducted for the various segments of the North American food & beverages texturants market derived on the basis of application and type.
The North American food and beverages texturants market was valued at $2,928.3 million in 2014 and is projected to reach $3,783.4 million by 2019, at a CAGR of 5.3% during the forecast period.
Please visit https://www.micromarketmonitor.com/custom-research-services.html to specify your custom Research Requirement


