

Europe Nutraceuticals Market by Applications (Functional Food, Functional Beverages, Dietary Supplements, Animal Feed, Personal Care); by Types (Prebiotics, Probiotics, Omega-3 & Structured Lipids and Others); by Country - Analysis and Forecast (2014-2019)
- Publish Date: Apr 2015


The Europe nutraceuticals market is projected to grow at a CAGR of 7.2% from 2014 to 2019. Nutraceuticals provide health and medicinal benefits such as the prevention and treatment of diseases in addition to basic nutritional value found in foodstuffs.
Nutraceuticals are included in functional foods, functional beverages, and dietary supplements which make their consumption easy. There is growing demand for nutraceuticals for personal care products because consumers prefer natural ingredients. The rise in demand for animal products such as dairy and meat is a key factor for introducing nutraceuticals in animal feed.
In 2014, the Europe nutraceuticals market was dominated by Germany, followed by France and Italy. The high awareness and wide acceptance of nutraceutical products is helping the nutraceuticals market. Europe is a multi-cultural continent and the consumption of fermented milk has traditionally been high in most of its countries.
The Europe nutraceuticals market is competitive, with firms such as Cargill Incorporated (U.S.), Archer Daniels Midland Company (U.S.), BASF SE (Germany), DuPont (U.S.), and Royal DSM (The Netherlands) among others, which are expanding their market share in concerned markets. To gain market share, these companies are adapting market strategies such as innovative product development, partnerships, mergers & acquisitions, and expansion of existing facilities.
Scope of the Report
This research report categorizes the Europe nutraceuticals market into the following segments and sub-segments:
Europe Nutraceuticals Market, by Application
- Functional Food
- Functional Beverages
- Dietary Supplements
- Animal Feed
- Personal Care
Europe Nutraceuticals Market, by Geography
- France
- Italy
- Germany
- U.K.
- Switzerland
- Russia
- Others
Table of Contents
1 Introduction (Page No. - 12)
1.1 Objectives of the Study
1.2 Market Segmentation & Coverage
1.3 Stakeholders
2 Research Methodology (Page No. - 15)
2.1 Integrated Ecosystem of Nutraceuticals Market
2.2 Arriving at the Nutraceuticals Market Size
2.2.1 Top-Down Approach
2.2.2 Bottom-Up Approach
2.2.3 Macro Indicator-Based Approach
2.3 Assumptions
3 Executive Summary (Page No. - 22)
4 Europe Nutraceuticals Market Overview (Page No. - 24)
4.1 Introduction
4.2 Europe Nutraceuticals Market: Comparison With Parent Market
4.3 Market Drivers and Inhibitors
4.4 Key Market Dynamics
4.5 Demand-Side Analysis
5 Europe Nutraceuticals Market, By Application (Page No. - 33)
5.1 Introduction
5.2 Europe Nutraceuticals in Functional Food, By Geography
5.3 Europe Nutraceuticals in Functional Beverages, By Geography
5.4 Europe Nutraceuticals in Dietary Supplements, By Geography
5.5 Europe Nutraceuticals in Animal Feed, By Geography
5.6 Europe Nutraceuticals in Personal Care, By Geography
6 Europe Nutraceuticals Market, By Type (Page No. - 46)
6.1 Introduction
6.2 Europe Nutraceuticals Market, Type Comparison With Food & Beverage Ingredients Market
6.3 European Prebiotics Market, By Geography
6.4 European Probiotics Market, By Geography
6.5 European Omega-3 & Structured Lipids, By Geography
6.6 European Amino Acids, Peptides & Proteins Market, By Geography
6.7 European Minerals Market, By Geography
6.8 European Vitamins Market, By Geography
6.9 European Phytochemicals & Plant Extracts Market, By Geography
6.10 European Fibers & Specialty Carbohydrates Market, By Geography
6.11 European Carotenoids & Antioxidants Market, By Geography
6.12 Sneak View: Europe Nutraceuticals Market, By Type
7 Europe Nutraceuticals Market, By Geography (Page No. - 70)
7.1 Introduction
7.2 Germany Nutraceuticals Market
7.2.1 Germany Nutraceuticals Market, By Application
7.2.2 Germany Nutraceuticals Market, By Type
7.3 France Nutraceuticals Market
7.3.1 France Nutraceuticals Market, By Application
7.3.2 France Nutraceuticals Market, By Type
7.4 Italy Nutraceuticals Market
7.4.1 Italy Nutraceuticals Market, By Application
7.4.2 Italy Nutraceuticals Market, By Type
7.5 U.K. Nutraceuticals Market
7.5.1 U.K. Nutraceuticals Market, By Application
7.5.2 U.K. Nutraceuticals Market, By Type
7.6 Switzerland Nutraceuticals Market
7.6.1 Switzerland Nutraceuticals Market, By Application
7.6.2 Switzerland Nutraceuticals Market, By Type
7.7 Russia Nutraceuticals Market
7.7.1 Russia Nutraceuticals Market, By Application
7.7.2 Russia Nutraceuticals Market, By Type
8 Europe Nutraceuticals Market: Competitive Landscape (Page No. - 101)
8.1 Europe Nutraceuticals Market: Company Share Analysis
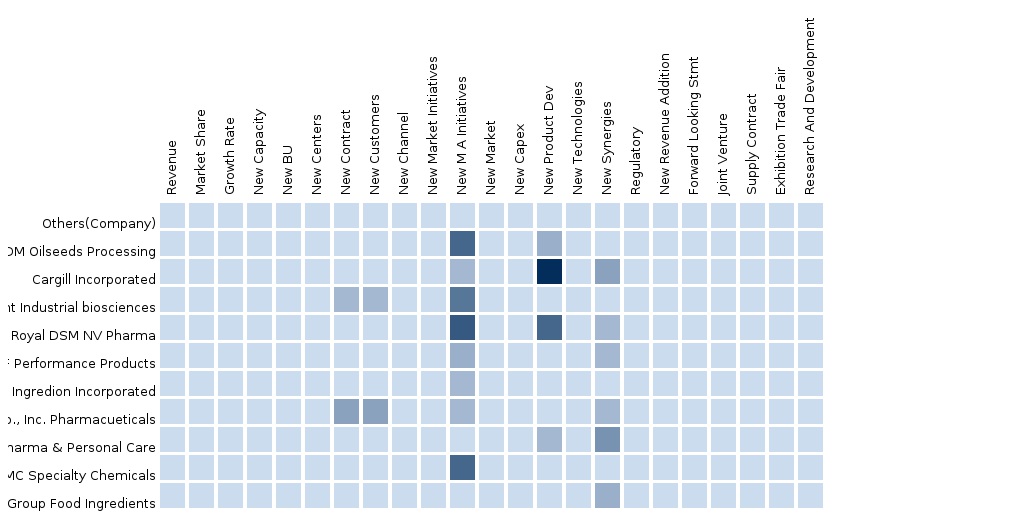
8.2 Company Presence in Nutraceuticals Market, By Type
8.3 Mergers & Acquisitions
8.4 Expansions
8.5 Agreements/Contracts
8.6 Joint Ventures
8.7 New Product Launches
9 Europe Nutraceuticals Market, By Company (Page No. - 106)
(Overview, Financials, Products & Services, Strategy, and Developments)*
9.1 BASF SE
9.2 E. I. Du Pont De Nemours and Company
9.3 Archer Daniels Midland Company
9.4 Cargill Incorporated
9.5 Royal DSM N.V.
*Details on Overview, Financials, Product & Services, Strategy, and Developments Might Not be Captured in Case of Unlisted Company
10 Appendix (Page No. - 123)
10.1 Customization Options
10.1.1 Technical Analysis
10.1.2 Low-Cost Sourcing Locations
10.1.3 Regulatory Framework
10.1.4 Impact Analysis
10.1.5 Trade Analysis
10.1.6 Historical Data and Trends
10.2 Related Reports
10.3 Introducing RT: Real Time Market Intelligence
10.3.1 RT Snapshots
List of Tables (82 Tables)
Table 1 Global Nutraceuticals Market Size, 2014 (USD MN)
Table 2 Europe Nutraceuticals Market: Macro Indicators, By Geography (Thousands), 2014
Table 3 Europe Nutraceuticals Market: Comparison With Parent Market, 2013 – 20190 (USD MN)
Table 4 Europe Nutraceuticals Market: Comparison With Parent Market,2013 – 2019 (Tons)
Table 5 Europe Nutraceuticals Market: Drivers and Inhibitors
Table 6 Europe Nutraceuticals Market, By Application, 2013 - 2019 (USD MN)
Table 7 Europe Nutraceuticals Market, By Application,2013 - 2019 (Tons)
Table 8 Europe Nutraceuticals Market, By Type, 2013 - 2019 (USD MN)
Table 9 Europe Nutraceuticals Market, By Type, 2013 - 2019 (Tons)
Table 10 Europe Nutraceuticals Market, By Geography,2013 - 2019 (USD MN)
Table 11 Europe Nutraceuticals Market, By Geography,2013 - 2019 (Tons)
Table 12 European Nutraceuticals Market: Comparison With Application Markets, 2013 - 2019 (USD MN)
Table 13 European Nutraceuticals Market, By Application, 2013 - 2019 (USD MN)
Table 14 European Nutraceuticals Market, By Application, 2013 - 2019 (Tons)
Table 15 European Nutraceuticals Market in Functional Food, By Geography, 2013 - 2019 (USD MN)
Table 16 European Nutraceuticals Market in Functional Food, By Geography,2013 - 2019 (Tons)
Table 17 European Nutraceuticals Market in Functional Beverages, By Geography, 2013 - 2019 (USD MN)
Table 18 European Nutraceuticals Market in Functional Beverages, By Geography, 2013 - 2019 (Tons)
Table 19 European Nutraceuticals Market in Dietary Supplements, By Geography, 2013 - 2019 (USD MN)
Table 20 European Nutraceuticals Market in Dietary Supplements, By Geography, 2013 - 2019 (Tons)
Table 21 European Nutraceuticals Market in Animal Feed, By Geography,2013 - 2019 (USD MN)
Table 22 European Nutraceuticals Market in Animal Feed, By Geography,2013 - 2019 (Tons)
Table 23 European Nutraceuticals Market in Personal Care, By Geography, 2013 - 2019 (USD MN)
Table 24 European Nutraceuticals Market in Personal Care, By Geography,2013 – 2019 (Tons)
Table 25 European Nutraceuticals Market, By Type, 2013 - 2019 (USD MN)
Table 26 European Nutraceuticals Market, By Type, 2013 - 2019 (Tons)
Table 27 European Nutraceuticals Market: Type Comparison With Parent Market, 2013–2019 (USD MN)
Table 28 European Prebiotics Market, By Country, 2013–2019 (USD MN)
Table 29 European Prebiotics Market, By Geography, 2013–2019 (Tons)
Table 30 European Probiotics Market, By Geography, 2013 - 2019 (USD MN)
Table 31 European Probiotics Market, By Geography, 2013 - 2019 (Tons)
Table 32 European Omega-3 & Structured Lipids Market, By Geography, 2013 - 2019 (USD MN)
Table 33 European Omega-3 & Structured Lipids Market, By Geography, 2013 - 2019 (Tons)
Table 34 European Amino Acids, Peptides & Proteins Market, By Geography,2013 - 2019 (USD MN)
Table 35 European Amino Acids, Peptides & Proteins Market, By Geography,2013 - 2019 (Tons)
Table 36 European Minerals Market, By Geography, 2013 - 2019 (USD MN)
Table 37 European Minerals Market, By Geography, 2013 - 2019 (Tons)
Table 38 European Vitamins Market, By Geography, 2013 - 2019 (USD MN)
Table 39 European Vitamins Market, By Geography, 2013 - 2019 (Tons)
Table 40 European Phytochemicals & Plant Extracts, By Geography, 2013 - 2019 (USD MN)
Table 41 European Phytochemicals & Plant Extracts Market, By Geography,2013 - 2019 (Tons)
Table 42 European Fibers & Specialty Carbohydrates Market, By Geography, 2013 - 2019 (USD MN)
Table 43 European Fibers & Specialty Carbohydrates Market, By Geography,2013 - 2019 (Tons)
Table 44 European Carotenoids & Antioxidants Market, By Geography,2013 - 2019 (USD MN)
Table 45 European Carotenoids & Antioxidants Market, By Geography, 2013 - 2019 (Tons)
Table 46 European Nutraceuticals Market, By Geography, 2013 - 2019 (USD MN)
Table 47 Nutraceuticals Market, By Geography, 2013 - 2019 (Tons)
Table 48 Germany Nutraceuticals Market, By Application, 2013 - 2019 (USD MN)
Table 49 Germany Nutraceuticals Market, By Application,2013 - 2019 (Tons)
Table 50 Germany Nutraceuticals Market, By Type, 2013 - 2019 (USD MN)
Table 51 Germany Nutraceuticals Market, By Type, 2013 - 2019 (Tons)
Table 52 France Nutraceuticals Market, By Application, 2013 - 2019 (USD MN)
Table 53 France Nutraceuticals Market, By Application, 2013 - 2019 (Tons)
Table 54 France Nutraceuticals Market, By Type, 2013 - 2019 (USD MN)
Table 55 France Nutraceuticals Market, By Type, 2013 - 2019 (Tons)
Table 56 Italy Nutraceuticals Market, By Application, 2013 - 2019 (USD MN)
Table 57 Italy Nutraceuticals Market, By Application, 2013-2019 (Tons)
Table 58 Italy Nutraceuticals: Market, By Type, 2013 - 2019 (USD MN)
Table 59 Italy Nutraceuticals: Market, By Type, 2013 - 2019 (Tons)
Table 60 U.K. Nutraceuticals Market, By Application, 2013 - 2019 (USD MN)
Table 61 U.K. Nutraceuticals Market, By Application, 2013-2019 (Tons)
Table 62 U.K. Nutraceuticals: Market, By Type, 2013 - 2019 (USD MN)
Table 63 U.K. Nutraceuticals: Market, By Type, 2013 - 2019 (Tons)
Table 64 Switzerland Nutraceuticals Market, By Application, 2013 - 2019 (USD MN)
Table 65 Switzerland Nutraceuticals Market, By Application, 2013-2019 (Tons)
Table 66 Switzerland Nutraceuticals: Market, By Type, 2013 - 2019 (USD MN)
Table 67 Switzerland Nutraceuticals: Market, By Type, 2013 - 2019 (Tons)
Table 68 Russia Nutraceuticals Market, By Application, 2013 - 2019 (USD MN)
Table 69 Russia Nutraceuticals Market, By Application, 2013-2019 (Tons)
Table 70 Russia Nutraceuticals: Market, By Type, 2013 - 2019 (USD MN)
Table 71 Russia Nutraceuticals: Market, By Type, 2013 - 2019 (Tons)
Table 72 Phosphatic Types Market: Company Share Analysis, 2014 (%)
Table 73 European Nutraceuticals Market: Mergers & Acquisitions
Table 74 European Nutraceuticals Market: Expansions
Table 75 European Nutraceuticals Market: Agreement
Table 76 European Nutraceuticals Market: Joint Ventures
Table 77 European Nutraceuticals Market: New Product Launches
Table 78 Basf: Key Financials, 2009 - 2013 (USD MN)
Table 79 Dupont De Nemours & Company: Key Financials, 2009 - 2013 (USD MN)
Table 80 Archer Daniels Midland Company Key Financials, 2009 - 2013 (USD MN)
Table 81 Cargill Incorporated: Key Financials, 2009 - 2013 (USD MN)
Table 82 Royal DSM N.V.: Key Operations Data, 2010 - 2013 (USD MN)
List of Figures (70 Figures)
Figure 1 Europe Nutraceuticals Market: Segmentation & Coverage
Figure 2 Nutraceuticals Market: Integrated Ecosystem
Figure 3 Research Methodology
Figure 4 Top-Down Approach
Figure 5 Bottom-Up Approach
Figure 6 Macro Indicator-Based Approach
Figure 7 Europe Nutraceuticals Market Snapshot
Figure 8 Nutraceuticals Market: Growth Aspects
Figure 9 European Nutraceuticals Market, By Application, 2014 vs 2019
Figure 10 European Nutraceuticals Types, By Geography, 2014 (USD MN)
Figure 11 European Nutraceuticals Market: Growth Analysis, By Type, 2014–2019 (%)
Figure 12 Nutraceuticals: Application Market Scenario
Figure 13 European Nutraceuticals Market, By Application, 2013 - 2019 (USD MN)
Figure 14 European Nutraceuticals Market, By Application, 2013 - 2019 (Tons)
Figure 15 Europe Nutraceuticals Market in Functional Food, By Geography, 2013 - 2019 (USD MN)
Figure 16 European Nutraceuticals Market in Functional Beverages, By Geography, 2013 - 2019 (USD MN)
Figure 17 European Nutraceuticals Market in Dietary Supplements, By Geography, 2013 - 2019 (USD MN)
Figure 18 European Nutraceuticals in Animal Feed, By Geography, 2013 - 2019 (USD MN)
Figure 19 European Nutraceuticals Market in Personal Care, By Geography,2013 - 2019 (USD MN)
Figure 20 European Nutraceuticals Market, By Type, 2013 - 2019 (USD MN)
Figure 21 European Nutraceuticals Market, By Type, 2014 & 2019 (Tons)
Figure 22 Europe Nutraceuticals Market: Type Comparison With Food & Beverage Ingredients Market, 2013–2019 (USD MN)
Figure 23 European Prebiotic Market, By Geography, 2013 - 2019 (USD MN)
Figure 24 European Probiotics Market, By Geography, 2013 - 2019 (USD MN)
Figure 25 European Omega-3 & Structured Lipids Market, By Geography, 2013 - 2019 (USD MN)
Figure 26 European Amino Acids, Peptides & Proteins Market, By Geography,2013 - 2019 (USD MN)
Figure 27 European Minerals Market, By Geography, 2013 - 2019 (USD MN)
Figure 28 European Vitamins Market, By Geography, 2013 - 2019 (USD MN)
Figure 29 European Phytochemicals & Plant Extracts Market, By Geography, 2013 - 2019 (USD MN)
Figure 30 European Fibers & Specialty Carbohydrates Market, By Geography,2013 - 2019 (USD MN)
Figure 31 European Carotenoids & Antioxidants Market, By Geography, 2013 - 2019 (USD MN)
Figure 32 European Nutraceuticals Market: Growth Analysis, By Geography,2013-2019 (USD MN)
Figure 33 European Nutraceuticals Market: Growth Analysis, By Geography,2013-2019 (Tons)
Figure 34 Germany Nutraceuticals Market Overview, 2014 & 2019 (%)
Figure 35 Germany Nutraceuticals Market, By Application, 2013-2019 (USD MN)
Figure 36 Germany Nutraceuticals Market: Application Snapshot
Figure 37 Germany Nutraceuticals Market, By Type, 2013 - 2019 (USD MN)
Figure 38 Germany Nutraceuticals Market Share, By Type, 2014-2019(%)
Figure 39 France Nutraceuticals Market Overview, 2014 & 2019 (%)
Figure 40 France Nutraceuticals Market, By Application, 2013-2019 (USD MN)
Figure 41 France Nutraceuticals Market: Application Snapshot
Figure 42 France Nutraceuticals Market, By Type, 2013 - 2019 (USD MN)
Figure 43 France Nutraceuticals Market Share, By Type, 2014-2019(%)
Figure 44 Italy Nutraceuticals Market Overview, 2014 & 2019 (%)
Figure 45 Italy Nutraceuticals Market, By Application, 2013 - 2019 (USD MN)
Figure 46 Italy Nutraceuticals Market: Application Snapshot
Figure 47 Italy Nutraceuticals Market, By Type, 2013 - 2019 (USD MN)
Figure 48 Italy Nutraceuticals Market Share, By Type, 2014-2019(%)
Figure 49 U.K. Nutraceuticals Market Overview, 2014 & 2019 (%)
Figure 50 U.K. Nutraceuticals Market, By Application, 2013 - 2019 (USD MN)
Figure 51 U.K. Nutraceuticals Market: Application Snapshot
Figure 52 U.K. Nutraceuticals Market, By Type, 2013 - 2019 (USD MN)
Figure 53 U.K. Nutraceuticals Market Share: Type Snapshot
Figure 54 Switzerland Nutraceuticals Market Overview, 2014 & 2019 (%)
Figure 55 Switzerland Nutraceuticals Market, By Application, 2013 - 2019 (USD MN)
Figure 56 Switzerland Nutraceuticals Market: Application Snapshot
Figure 57 Switzerland Nutraceuticals Market, By Type, 2013 - 2019 (USD MN)
Figure 58 Switzerland Nutraceuticals Market Share: Type Snapshot
Figure 59 Russia Nutraceuticals Market Overview, 2014 & 2019 (%)
Figure 60 Russia Nutraceuticals Market, By Application, 2013 - 2019 (USD MN)
Figure 61 Russia Nutraceuticals Market: Application Snapshot
Figure 62 Russia Nutraceuticals Market, By Type, 2013 - 2019 (USD MN)
Figure 63 Russia Nutraceuticals Market Share: Type Snapshot
Figure 64 Nutraceuticals Market: Company Share Analysis, 2014 (%)
Figure 65 Nutraceuticals: Company Product Coverage, By Type, 2014
Figure 66 BASF SE: Revenue Mix, 2013 (%)
Figure 67 E. I. Du Pont De Nemours and Company Revenue Mix, 2013 (%)
Figure 68 Archer Daniels Midland Company Revenue Mix, 2013 (%)
Figure 69 Cargill Incorporated, Revenue Mix, 2013 (%)
Figure 70 Royal DSM N.V.: Revenue Mix 2013 (%)
The Europe nutraceuticals market is projected to grow at CAGR of 7.2% from 2014 to 2019. In 2014, the European market is dominated by a large number of small players. The largest private company in the U.S., Cargill Incorporated, leads the European market with a share of 21.07%. Cargill offers reliably sourced inputs, vitamins, minerals, and additives. It also offers nutrition expertise and feeding solutions to help optimize animal production operations. It offers a variety of functional food ingredients required to manufacture health food and beverages.
The nutraceuticals market in Russia is projected to grow at the highest CAGR in the next five years. Traditionally, Russians consume fermented milk which has probiotics properties. The awareness about nutraceuticals aids the growth in the Russian market, which leads to increase in CAGR.
Germany is a major market and constitutes 23.02% of the market share. Hence, it is an important market for global nutraceuticals producers. The nutraceuticals industry is heavily dependent upon technology due to its complex nature. Hence, technological advancement for production of different variants of nutraceutical ingredients has been on the rise. The technological developments, along with scientific research conducted to cater to the needs of the consumers, are driving the market for these ingredients in Europe.
In this report, the Europe nutraceuticals market has been broadly discussed in terms of its applications such as functional food, functional beverages, dietary supplement, animal feed, and personal care. Detailed analysis of nutraceutical types such as prebiotic, probiotic, Omega-3, amino acids, peptides & proteins, phytochemicals, vitamins, minerals, fibers & specialty carbohydrates, carotenoids, and others has been conducted for major countries of Europe.
Please visit https://www.micromarketmonitor.com/custom-research-services.html to specify your custom Research Requirement


