

Asia Chromatography Solvents Market, By Type (Polar, Non-Polar), By Grade (LCMS. HPLC, UHPLC), By Application (Analytical, Preparative, Chromatography), By End User –Forecasts up to 2020
- Publish Date: Nov 2015


The objective of this report is to cover the definition, scope, description, and forecast of the Asian chromatography solvents market. It involves a deep dive analysis of the market segmentation, which is based on solvent type, grade, application, and end user. The report also offers insights into the competitive landscape of the market through a strategic analysis of the key market players. The chromatography solvents market, in terms of solvent type, has been segmented into polar solvents and non-polar solvents. The market is further segmented based on solvent grade into LCMS grade, HPLC grade, and UHPLC grade. By application, the market is segmented into analytical and preparative chromatography. The major end users of this market are pharmaceuticals & biotechnology industry; academic, research & government institutes; food & beverage industry; and cosmetics industry.
Asia has an emerging and relatively untapped market for chromatography solvents with Japan claiming the major market share in this region. The Asian chromatography market is projected to grow at a CAGR of 13.5% during the forecast period of 2015 to 2020. This rapid growth is attributed to the increasing healthcare expense in the region, increasing aging population leading to rising demand for medicines, and initiatives from several governments to promote industrialization.
Automation and advent of high precision techniques, such as HPLC and gas chromatography (GC) have resulted in a paradigm shift in chromatography methods with increasing demand for high purity solvents. In Asia, Japan holds of more than 30% of the market share, though being a mature market, it’s growing at a much slower pace than other countries in the region. China and India are growing at the fastest pace.
Pharmaceuticals & biotechnology industry is the major end user of chromatography solvents. Several major pharmaceutical MNCs have established their production units and R&D centers in Asia in recent times owing to industry-friendly policies adopted by several governments (SEZs, tax waivers) in the region as well as availability of cheap skilled and unskilled workforce in the region. For instance, Pfizer's China Research and Development Centre was established in 2005. AstraZeneca opened its Shanghai R&D center in 2007.
The report also provides a detailed competitive landscaping of companies operating in this market. Segment and country-specific company shares, news & deals, M&A, and segment-specific pipeline products, product approvals, and product recalls of the major companies have been detailed in the report. The main companies operating in this market are EMD Millipore (U.S.), Sigma-Aldrich Corporation (U.S.), Avantor Performance (U.S.), Tedia Company (Japan), Thermo-Fisher Scientific (U.S.), and VWR International (U.S.). The market has witnessed some major acquisitions by the key market players.
Scope of the Report:
This research report categorizes the Asia chromatography solvents market into the following segments:
Asia Chromatography Solvents Market, By Type
- Polar Solvents
- Non-Polar Solvents
Asia Chromatography Solvents Market, By Grade
- LCMS Grade Solvents
- HPLC Grade Solvents
- UHPLC Grade Solvents
Asia Chromatography Solvents Market, By Application
- Analytical Chromatography
- Preparative Chromatography
Asia Chromatography Solvents Market, By End User
- Pharmaceutical & Biotechnology Industry
- Academic, Research & Government Institute
- Food & Beverage Industry
- Cosmetics Industry
- Environmental
Asia Chromatography Solvents Market, By Geography
- Japan
- China
- India
- Republic of Korea
- Singapore
- Malaysia
- Indonesia
- Vietnam
1 Introduction (Page No. - 13)
1.1 Objectives Of the Study
1.2 Market Segmentation & Coverage
1.3 Stakeholders
2 Research Methodology (Page No. - 17)
2.1 Integrated Ecosystem Of the Chromatography Solvents Market
2.2 Arriving At the Chromatography Solvents Market Size
2.2.1 Top-Down Approach
2.2.2 Demand-Side Approach
2.2.3 Macro Indicator-Based Approach
2.3 Assumptions
3 Executive Summary (Page No. - 24)
4 Market Overview (Page No. - 27)
4.1 Introduction
4.2 Market Drivers and Inhibitors
5 Asia Chromatography Solvents Market, By Type (Page No. - 30)
5.1 Introduction
5.2 Polar Solvents Market
5.3 Non-Polar Solvents Market
6 Asia Chromatography Solvents Market, By Grade (Page No. - 36)
6.1 Introduction
6.2 Lcms Grade Solvents Market
6.3 Hplc Grade Solvents Market
6.4 Uhplc Grade Solvents Market
7 Asia Chromatography Solvents Market, By Application (Page No. - 44)
7.1 Introduction
7.2 Analytical Chromatography
7.3 Preparative Chromatography Market
8 Asia Chromatography Solvents Market, By End User (Page No. - 50)
8.1 Introduction
8.2 Pharmaceutical & Biotechnology Industry
8.3 Academic, Research & Government Institutes
8.4 Food & Beverage Industry
8.5 Cosmetics Industry
8.6 Environmental
9 Asia Chromatography Solvents Market, By Geography (Page No. - 61)
9.1 Introduction
9.2 Japan Chromatography Solvents Market
9.2.1 Japan Chromatography Solvents Market, By Type
9.2.2 Japan Chromatography Solvents Market, By Grade
9.2.3 Japan Chromatography Solvents Market, By Application
9.2.4 Japan Chromatography Solvents Market, By End User
9.3 China Chromatography Solvents Market
9.3.1 China Chromatography Solvents Market, By Type
9.3.2 China Chromatography Solvents Market, By Grade
9.3.3 China Chromatography Solvents Market, By Application
9.3.4 China Chromatography Solvents Market, By End User
9.4 India Chromatography Solvents Market
9.4.1 India Chromatography Solvents Market, By Type
9.4.2 India Chromatography Solvents Market, By Grade
9.4.3 India Chromatography Solvents Market, By Application
9.4.4 India Chromatography Solvents Market, By End User
9.5 Republic Of Korea Chromatography Solvents Market
9.5.1 Republic Of Korea Chromatography Solvents Market, By Type
9.5.2 Republic Of Korea Chromatography Solvents Market, By Grade
9.5.3 Republic Of Korea Chromatography Solvents Market, By Application
9.5.4 Republic Of Korea Chromatography Solvents Market, By End User
9.6 Singapore Chromatography Solvents Market
9.6.1 Singapore Chromatography Solvents Market, By Type
9.6.2 Singapore Chromatography Solvents Market, By Grade
9.6.3 Singapore Chromatography Solvents Market, By Application
9.6.4 Singapore Chromatography Solvents Market, By End User
9.7 Malaysia Chromatography Solvents Market
9.7.1 Malaysia Chromatography Solvents Market, By Type
9.7.2 Malaysia Chromatography Solvents Market, By Grade
9.7.3 Malaysia Chromatography Solvents Market, By Application
9.7.4 Malaysia Chromatography Solvents Market, By End User
9.8 Indonesia Chromatography Solvents Market
9.8.1 Indonesia Chromatography Solvents Market, By Type
9.8.2 Indonesia Chromatography Solvents Market, By Grade
9.8.3 Indonesia Chromatography Solvents Market, By Application
9.8.4 Indonesia Chromatography Solvents Market, By End User
9.9 Vietnam Chromatography Solvents Market
9.9.1 Vietnam Chromatography Solvents Market, By Type
9.9.2 Vietnam Chromatography Solvents Market, By Grade
9.9.3 Vietnam Chromatography Solvents Market, By Application
9.9.4 Vietnam Chromatography Solvents Market, By End User
10 Asia Chromatography Solvents Market: Competive Landscape (Page No. - 103)
10.1 Asia Chromatography Solvents Market : Company Share Analysis
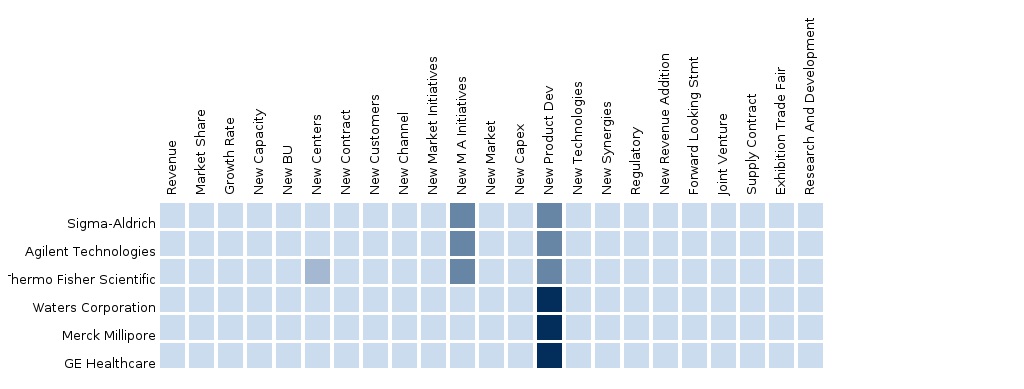
10.2 New Product Launch
10.3 Expansions
10.4 Acquisitions
10.5 Agreements
11 Asia Chromatography Solvents Market, By Company (Page No. - 108)
11.1 Emd Millipore/ Merck Millipore (A Division Of Merck Kgaa)
11.1.1 Overview
11.1.2 Product and Service Offerings
11.1.3 Key Financials
11.1.4 Related Developments
11.1.5 Mmm View
11.2 Sigma-Aldrich Corporation
11.2.1 Overview
11.2.2 Key Financials
11.2.3 Product and Service Offerings
11.2.4 Related Developments
11.2.5 Mmm View
11.3 Avantor Performance Materials
11.3.1 Overview
11.3.2 Key Financials
11.3.3 Product and Service Offerings
11.3.4 Related Developments
11.4 Tedia Company, Inc.
11.4.1 Overview
11.4.2 Key Financials
11.4.3 Product and Service Offerings
11.4.4 Related Developments
11.5 Regis Technologies Inc.,
11.5.1 Overview
11.5.2 Key Financials
11.5.3 Product and Service Offerings
11.5.4 Mmm View
11.6 Thermo Fisher Scientific
11.6.1 Overview
11.6.2 Key Financials
11.6.3 Product and Service Offerings
11.6.4 Related Developments
11.6.5 Mmm View
11.7 Vwr International
11.7.1 Overview
11.7.2 Key Financials
11.7.3 Product and Service Offerings
11.7.4 Related Developments
11.7.5 Mmm View
11.8 Qualikems Fine Chem Pvt. Ltd.
11.8.1 Overview
11.8.2 Key Financials
11.8.3 Product and Service Offerings
11.8.4 Mmm View
12 Appendix (Page No. - 128)
12.1 Customization Options
12.1.1 Product Analysis
12.1.2 Regulatory Framework
12.1.3 Competitive Intelligence
12.2 Related Reports
12.3 Introducing Rt: Real-Time Market Intelligence
12.3.1 Rt Snapshots
List Of Tables
Table 1 Asia Chromatography Solvents Market: Drivers and Inhibitors
Table 2 Asia Chromatography Solvents Market, By Type, 2013-2020 (USD Million)
Table 3 Asia Polar Solvents Market, By Geography, 2013–2020 (USD Million)
Table 4 Asia Non-Polar Solvents Market, By Geography, 2013–2020 (USD Million)
Table 5 Asia Chromatography Solvents Market, By Grade, 2013–2020 (USD Million)
Table 6 Asia Lcms Grade Solvents Market, By Geography, 2013–2020 (USD Million)
Table 7 Asia Hplc Grade Solvents Market, By Geography, 2013–2020 (USD Million)
Table 8 Asia Uhplc Grade Solvents Market, By Geography, 2013–2020 (USD Million)
Table 9 Asia Chromatography Solvents Market, By Application, 2013–2020 (USD Million)
Table 10 Asia Chromatography Solvents Market in Analytical Chromatography, By Geography, 2013–2020 (USD Million)
Table 11 Asia Chromatography Solvents Market in Preparative Chromatography, By Geography, 2013–2020 (USD Million)
Table 12 Asia Chromatography Solvents Market, By End User, 2013–2020 (USD Million)
Table 13 Asia Chromatography Solvents Market in Pharmaceutical & Biotechnology Industry, By Geography, 2013–2020 (USD Million)
Table 14 Asia Chromatography Solvents Market in Academic, Research & Government Institute, By Geography, 2013–2020 (USD Million)
Table 15 Asia Chromatography Solvents Market in Food & Beverage Industry, By Geography, 2013–2020 (USD Million)
Table 16 Asia Chromatography Solvents Market in Cosmetics Industry, By Geography, 2013–2020 (USD Million)
Table 17 Asia Chromatography Solvents Market in Environmental, By Geography, 2013–2020 (USD Million)
Table 18 Asia Chromatography Solvents Market, By Geography, 2013–2020 (USD Million)
Table 19 Japan Chromatography Solvents Market, By Type, 2013–2020 (USD Million)
Table 20 Japan Chromatography Solvents Market, By Grade, 2013–2020 (USD Million)
Table 21 Japan Chromatography Solvents Market, By Application, 2013–2020 (USD Million)
Table 22 Japan Chromatography Solvents Market, By End User, 2013–2020 (USD Million)
Table 23 China Chromatography Solvents Market, By Type, 2013–2020 (USD Million)
Table 24 China Chromatography Solvents Market, By Grade, 2013–2020 (USD Million)
Table 25 China Chromatography Solvents Market, By Application, 2013–2020 (USD Million)
Table 26 China Chromatography Solvents Market, By End User, 2013–2020 (USD Million)
Table 27 India Chromatography Solvents Market, By Type, 2013–2020 (USD Million)
Table 28 India Chromatography Solvents Market, By Grade, 2013–2020 (USD Million)
Table 29 India Chromatography Solvents Market, By Application, 2013–2020 (USD Million)
Table 30 India Chromatography Solvents Market, By End User, 2013–2020 (USD Million)
Table 31 Republic Of Korea Chromatography Solvents Market, By Type, 2013–2020 (USD Million)
Table 32 Republic Of Korea Chromatography Solvents Market, By Grade, 2013–2020 (USD Million)
Table 33 Republic Of Korea Chromatography Solvents Market, By Application, 2013–2020 (USD Million)
Table 34 Republic Of Korea Chromatography Solvents Market, By End User, 2013–2020 (USD Million)
Table 35 Singapore Chromatography Solvents Market, By Type, 2013–2020 (USD Million)
Table 36 Singapore Chromatography Solvents Market, By Grade, 2013–2020 (USD Million)
Table 37 Singapore Chromatography Solvents Market, By Application, 2013–2020 (USD Million)
Table 38 Singapore Chromatography Solvents Market, By End User, 2013–2020 (USD Million)
Table 39 Malaysia Chromatography Solvents Market, By Type, 2013–2020 (USD Million)
Table 40 Malaysia Chromatography Solvents Market, By Grade, 2013–2020 (USD Million)
Table 41 Malaysia Chromatography Solvents Market, By Application, 2013–2020 (USD Million)
Table 42 Malaysia Chromatography Solvents Market, By End User, 2013–2020 (USD Million)
Table 43 Indonesia Chromatography Solvents Market, By Type, 2013–2020 (USD Million)
Table 44 Indonesia Chromatography Solvents Market, By Grade, 2013–2020 (USD Million)
Table 45 Indonesia Chromatography Solvents Market, By Application, 2013–2020 (USD Million)
Table 46 Indonesia Chromatography Solvents Market, By End User, 2013–2020 (USD Million)
Table 47 Vietnam Chromatography Solvents Market, By Type, 2013–2020 (USD Million)
Table 48 Vietnam Chromatography Solvents Market, By Grade, 2013–2020 (USD Million)
Table 49 Vietnam Chromatography Solvents Market, By Application, 2013–2020 (USD Million)
Table 50 Vietnam Chromatography Solvents Market, By End User, 2013–2020 (USD Million)
Table 51 Thermo Fisher Scientific: Financials, 2012-2014 (USD Million)
Table 52 Vwr International: Key Financials, 2012-2014 (USD Million)
List Of Figures
Figure 1 Asia Chromatography Solvents Market Segmentation & Coverage
Figure 2 Chromatography Solvents Market: Integrated Ecosystem
Figure 3 Arriving At the Chromatography Solvents Market Size
Figure 4 Top-Down Approach
Figure 5 Population By Country : 2012 & 2018
Figure 6 Sector-Wise Percentage Distribution Of Gross Domestic Expenditure On R&D, By Country: 2014
Figure 7 Healthcare Expenditure: 2012 & 2018
Figure 8 Asia Chromatography Solvents Market Snapshot, 2014
Figure 9 Asia Chromatography Solvents Market, By Geography, 2014 (USD Mn)
Figure 10 Asia Chromatography Solvents Market, By Type, 2014 & 2020 (USD Million)
Figure 11 Asia Polar Solvents Market, By Geography, 2013-2020 (USD Million)
Figure 12 Asia Non-Polar Solvents Market, By Geography, 2013–2020 (USD Million)
Figure 13 Asia Chromatography Solvents Market, By Grade, 2014 & 2020 (USD Million)
Figure 14 Asia Lcms Grade Solvents Market, By Geography, 2013–2020 (USD Million)
Figure 15 Asia Hplc Grade Solvents Market, By Geography, 2013–2020 (USD Million)
Figure 16 Asia Uhplc Grade Solvents Market, By Geography, 2013–2020 (USD Million)
Figure 17 Asia Chromatography Solvents Market, By Application, 2014 & 2020 (USD Million)
Figure 18 Asia Chromatography Solvents Market in Analytical Chromatography, By Geography, 2013–2020 (USD Million)
Figure 19 Asia Chromatography Solvents Market in Preparative Chromatography, By Geography, 2013–2020 (USD Million)
Figure 20 Asia Chromatography Solvents Market, By End User, 2013-2020 (USD Million)
Figure 21 Asia Chromatography Solvents Market, By End User, 2013-2020 (USD Million)
Figure 22 Asia Chromatography Solvents Market in Pharmaceutical & Biotechnology Industry, By Geography, 2013–2020 (USD Million)
Figure 23 Asia Chromatography Solvents Market in Academic, Research & Government Institute, By Geography, 2013–2020 (USD Million)
Figure 24 Asia Chromatography Solvents Market in Food & Beverage Industry, By Geography, 2013–2020 (USD Million)
Figure 25 Asia Chromatography Solvents Market in Cosmetics Industry, By Geography, 2013–2020 (USD Million)
Figure 26 Asia Chromatography Solvents Market in Environmental, By Geography, 2013–2020 (USD Million)
Figure 27 Chromatography Solvents Market: Growth Analysis By Geography, 2014-2020 (USD Million)
Figure 28 Japan Chromatography Solvents Market Overview, 2014 & 2020 (%)
Figure 29 Japan Chromatography Solvents Market, By Type, 2013–2020 (USD Million)
Figure 30 Japan Chromatography Solvents Market, By Grade, 2013–2020 (USD Million)
Figure 31 Japan Chromatography Solvents Market, By Application, 2013–2020 (USD Million)
Figure 32 Japan Chromatography Solvents Market, By End User, 2013–2020 (USD Million)
Figure 33 China Chromatography Solvents Market Overview, 2014 & 2020 (%)
Figure 34 China Chromatography Solvents Market, By Type, 2013–2020 (USD Million)
Figure 35 China Chromatography Solvents Market, By Grade, 2013–2020 (USD Million)
Figure 36 China Chromatography Solvents Market, By Application, 2013–2020 (USD Million)
Figure 37 China Chromatography Solvents Market, By End User, 2013–2020 (USD Million)
Figure 38 India Chromatography Solvents Market Overview, 2014 & 2020 (%)
Figure 39 India Chromatography Solvents Market, By Type, 2013–2020 (USD Million)
Figure 40 India Chromatography Solvents Market, By Grade, 2013–2020 (USD Million)
Figure 41 India Chromatography Solvents Market, By Application, 2013–2020 (USD Million)
Figure 42 India Chromatography Solvents Market, By End User, 2013–2020 (USD Million)
Figure 43 Republic Of Korea Chromatography Solvents Market Overview, 2014 & 2020 (%)
Figure 44 Republic Of Korea Chromatography Solvents Market, By Type, 2013–2020 (USD Million)
Figure 45 Republic Of Korea Chromatography Solvents Market, By Grade, 2013–2020 (USD Million)
Figure 46 Republic Of Korea Chromatography Solvents Market, By Application, 2013–2020 (USD Million)
Figure 47 Republic Of Korea Chromatography Solvents Market, By End User, 2013–2020 (USD Million)
Figure 48 Singapore Chromatography Solvents Market Overview, 2014 & 2020 (%)
Figure 49 Singapore Chromatography Solvents Market, By Type, 2013–2020 (USD Million)
Figure 50 Singapore Chromatography Solvents Market, By Grade, 2013–2020 (USD Million)
Figure 51 Singapore Chromatography Solvents Market, By Application, 2013–2020 (USD Million)
Figure 52 Singapore Chromatography Solvents Market, By End User, 2013–2020 (USD Million)
Figure 53 Malaysia Chromatography Solvents Market Overview, 2014 & 2020 (%)
Figure 54 Malaysia Chromatography Solvents Market, By Type, 2013–2020 (USD Million)
Figure 55 Malaysia Chromatography Solvents Market, By Grade, 2013–2020 (USD Million)
Figure 56 Malaysia Chromatography Solvents Market, By Application, 2013–2020 (USD Million)
Figure 57 Malaysia Chromatography Solvents Market, By End User, 2013–2020 (USD Million)
Figure 58 Indonesia Chromatography Solvents Market Overview, 2014 & 2020 (%)
Figure 59 Indonesia Chromatography Solvents Market, By Type, 2013–2020 (USD Million)
Figure 60 Indonesia Chromatography Solvents Market, By Grade, 2013–2020 (USD Million)
Figure 61 Indonesia Chromatography Solvents Market, By Application, 2013–2020 (USD Million)
Figure 62 Indonesia Chromatography Solvents Market, By End User, 2013–2020 (USD Million)
Figure 63 Vietnam Chromatography Solvents Market Overview, 2014 & 2020 (%)
Figure 64 Vietnam Chromatography Solvents Market, By Type, 2013–2020 (USD Million)
Figure 65 Vietnam Chromatography Solvents Market, By Grade, 2013–2020 (USD Million)
Figure 66 Vietnam Chromatography Solvents Market, By Application, 2013–2020 (USD Million)
Figure 67 Vietnam Chromatography Solvents Market, By End User, 2013–2020 (USD Million)
Figure 68 Asia Chromatography Solvents Market, By Company, 2014
Figure 69 Sigma-Aldrich Corporation: Revenue Mix, 2014 (%)
Figure 70 Vwr International: Revenue Mix, 2014 (%)
Chromatography is a separation technique of a mixture, done through the distribution of components between two phases, namely, the stationary phase and the mobile phase. This technique has evolved over the years and has become a method of choice for analysis, identification, and purification of a wide variety of compounds. Automation and advent of high precision techniques, such as HPLC and gas chromatography (GC) has resulted in a paradigm shift in chromatography methods with increasing demand for high purity solvents. These techniques are frequently recommended as the standard procedure for analysis of drugs in official compendiums and pharmacopoeias.
A chromatographic solvent is a mixture in which the sample is mixed and passed through a stationary phase for separation. The polarity of chromatographic solvents plays a crucial role in the separation process. These solvents and reagents are required to have high quality and purity in order to achieve the desired degree of separation and purification of analytes.
The chromatography solvents market has been segmented by type into polar solvents and non-polar solvents. The polar solvents segment is the leading among both types.
The market is further segmented based on solvent grade into LCMS grade, HPLC grade, and UHPLC grade. Out of these segments, HPLC grade solvent is the leading one, followed by LCMS grade solvents segment.
The key applications of this market are analytical and preparative chromatography. The end users of the market are pharmaceutical & biotechnology industry; academic, research & government institutes; food & beverage industry; and cosmetics industry. The major countries considered for the market study include Japan, China, India, Republic of Korea, Singapore, Indonesia, Malaysia, and Vietnam.
Japan leads the Asian market for chromatography solvents with a share of more than 30% amongst all countries in this region. China and India are amongst the fastest-growing markets in this region. Japan’s growth rate is relatively low as compared to other countries as it is a mature market. The trend is expected to remain similar during the forecast period as well, resulting in similar market dominance by 2020.
Increasing incidences of lifestyle diseases, along with the aging population, has led to an increased demand of medication from pharmaceuticals & biotechnology sector. This has promoted the growth of chromatography solvents in these sectors. Various governments in the countries of Asia are also promoting industrialization, which has attracted major pharmaceutical companies to open thein manufacturing and research & development units in this region. This trend has also led to an augmented demand for chromatography solvents. On the other hand, increasing price of solvents and newer equipment with less solvent requirements may hinder the growth of Asian chromatography solvents market.
Please visit https://www.micromarketmonitor.com/custom-research-services.html to specify your custom Research Requirement
| PRODUCT TITLE | PUBLISHED | |
|---|---|---|
|
|
North American Chromatography Reagents Market North American chromatography reagents market is the largest in chromatography reagents market, which is expected to reach a value of $3003.1 million by 2018; growing at 9.3% annually during 2013 to 2018. The market is segmented into types, technologies, products, processes, applications, end-users and geography. Deep dive analysis of the key players of this domain, have been considered in this report. |
Upcoming |
|
|
European Chromatography Reagents Market European Chromatography Reagents Market is the second largest in chromatography reagents market, which is expected to reach a value of $2,101.8 million by 2018; growing at 9.0% annually during 2013- 2018. The market is segmented into types, technologies, products, processes, applications, end-users and geography. Deep dive analysis of the top players of this domain, have been considered in the report. |
Upcoming |
|
|
Asian Chromatography Reagents Market Chromatography Reagents Market in Asia is estimated at $860.8 million in 2013 and is expected to reach a value of $1663.3 million in 2018 at a CAGR of 14.1% from 2013-2018. Chromatography Reagents-Asia can be segmented by Products, Technologies, Applicatons, Endusers, Companies and MacroIndicators. Deep dive analysis of the key players of this domain, have been considered in this report. |
Upcoming |


