

Asia Dermatology Devices Market by Type (Dermatology Treatment Devices, Dermatology Diagnostic Devices), by End User (Hospitals, Clinics) - Forecast to 2019
- Publish Date: Feb 2015


This report covers definition, description, and forecast for the Asian dermatology devices market. It involves a detailed analysis of the market segmentation, which comprises types and end-users. The report also provides the strategic analysis of the key players in this market. Based on product types, the Asian dermatology devices market has been segmented into dermatology treatment devices and dermatology diagnostic devices, wherein the dermatology treatment devices segment dominates the market, having accounted for a 94.6% of the overall market share in 2014. On the basis of end-users, the dermatology devices market is categorized into hospitals and clinics.
Dermatology devices are used for diagnosis and treatment of conditions related to skin, hair, and nails. Dermatology treatment devices and dermatology diagnostic devices are the two types of dermatology devices available in the market. Dermatology treatment devices form a major segment of the dermatology devices market. This segment consists of devices such as electrosurgical equipment, liposuction devices, LED light therapy devices, and microdermabrasion, and various types of lasers such as carbon-dioxide lasers, argon lasers, diode laser, Nd:YAG (neodymium-doped yttrium aluminum garnet) laser, and intense pulse light (IPL). The dermatology diagnostic devices segment covers the analysis of dermatoscopes (traditional and digital dermatoscopes), along with microscopes and imaging techniques (such as ultrasound, computed tomography, magnetic resonance imaging, and optical coherence tomography).
In recent years, there has been a significant increase in the demand for various procedures and surgeries for the treatment of skin ailments. Various sophisticated diagnostic instruments, such as dermatoscopes, OCT scanners, and hand-held scanners allow an early detection of melanoma, thereby improving survival rates, and reducing the number of biopsies in future and the cost of healthcare. The advancement in technology has enabled the development of new, accurate, sensitive, and quantitative diagnostic instruments that have the potential to treat a number of skin disorders. Quantitative Thermographic Imaging (QTI), Confocal Microscopy, and Optical Coherence Tomography (OCT) have been revolutionizing the diagnostic procedures. White-light and polarized-light imaging, spatial and spectroscopic multispectral methods, and Terahertz (THZ) imaging methods have also been applied in certain cases to effectively treat patients.
The report also provides a detailed competitive landscaping of companies operating in this market. Segment and country-specific company shares, news & deals, M&As, and segment-specific pipeline products, product approvals, and product recalls of the major companies have been detailed in this report. Heine Optotechnik (Germany), Optomed Oy (Finland), FotoFinder Systems (Germany), Michelson Diagnostics (UK), Genesis Biosystems (U.S.), Ellipse A/S (Denmark), Alma Lasers (Israel), Palomar Technologies (U.S.), GE Healthcare (UK), Philips Healthcare (Netherlands), 3Gen LLC (U.S.), Welch Allyn (U.S.), Carl Zeiss Meditec, Inc. (U.S.), Hitachi (Japan), Leica Microsystems (Germany), Olympus (Japan), Toshiba Medical Systems (Japan), and Siemens Medical Systems (Germany) are some of the key players operational in this market.
Table of Contents
1 Introduction (Page No. - 16)
1.1 Objectives of the Study
1.2 Market Segmentation & Coverage
1.3 Stakeholders
2 Research Methodology (Page No. - 18)
2.1 Integrated Ecosystem of Dermatology Devices Market
2.2 Arriving at the Asian Dermatology Devices Market Size
2.2.1 Top-Down Approach
2.2.2 Macro Indicator-Based Approach
2.3 Assumptions
3 Executive Summary (Page No. - 24)
4 Market Overview (Page No. - 26)
4.1 Introduction
4.2 Asian Dermatology Devices Market: Comparison With Asian Medical Devices Market, 2013 – 2019 (USD MN)
4.3 Market Drivers And Inhibitors
4.4 Key Market Dynamics
5 Asian Dermatology Devices Market, By Type (Page No. - 38)
5.1 Introduction
5.1.1 Asian Dermatology Treatment Devices Market, By Geography
5.1.2 Asian Dermatology Diagnostic Devices Market, By Geography
5.2 Asian Dermatology Devices Market: Product Comparison Asian Dermatology Devices Market
6 Asian Dermatology Devices Market, By End-User (Page No. - 54)
6.1 Introduction
6.2 Asian Dermatology Devices Market in Clinics, By Geography
6.2.1 Asian Dermatology Devices Market in Hospitals, By Geography
6.3 Asian Dermatology Devices Market: End-User Comparison With Asian Dermatology Devices Market
7 Asian Dermatology Devices Market, By Geography (Page No. - 62)
7.1 Introduction
7.2 Chinese Dermatology Devices Market
7.2.1 Chinese Dermatology Devices Market, By Type
7.2.1.1 Chinese Dermatology Treatment Devices Market, By Product
7.2.1.1.1 Chinese Dermatology Treatment Devices Market in Lasers, By Type/Application
7.2.1.2 Chinese Dermatology Diagnostic Devices Market, By Product
7.2.1.2.1 Chinese Dermatology Diagnostic Devices Market in Imaging Techniques, By Type
7.2.1.2.2 Chinese Dermatology Diagnostic Devices Market in Dermatoscope, By Type
7.3 Japanese Dermatology Devices Market
7.3.1 Japanese Dermatology Devices Market, By Type
7.3.1.1 Japanese Dermatology Treatment Devices Market, By Product
7.3.1.1.1 Japanese Dermatology Treatment Devices Market in Lasers, By Type/Application
7.3.1.2 Japanese Dermatology Diagnostic Devices Market, By Product
7.3.1.2.1 Japanese Dermatology Diagnostic Devices Market in Imaging Techniques, By
Type
7.3.1.2.2 Japanese Dermatology Diagnostic Devices Market in Dermatoscope, By Type
7.4 Indian Dermatology Devices Market
7.4.1 Indian Dermatology Devices Market, By Type
7.4.1.1 Indian Dermatology Treatment Devices Market, By Product
7.4.1.1.1 Indian Dermatology Treatment Devices Market in Lasers, By Type/Application
7.4.1.2 Indian Dermatology Diagnostic Devices Market, By Product
7.4.1.2.1 Indian Dermatology Diagnostic Devices Market in Imaging Techniques, By Type
7.4.1.2.2 Indian Dermatology Diagnostic Devices Market in Dermatoscope, By Type
7.5 Korean Dermatology Devices Market
7.5.1 Korean Dermatology Devices Market, By Type
7.5.1.1 Korean Dermatology Treatment Devices Market, By Product
7.5.1.1.1 Korean Dermatology Treatment Devices Market in Lasers, By Type/Application
7.5.1.2 Korean Dermatology Diagnostic Devices Market, By Product
7.5.1.2.1 Korean Dermatology Diagnostic Devices Market in Imaging Techniques, By Type
7.5.1.2.2 Korean Dermatology Diagnostic Devices Market in Dermatoscope, By Type
7.6 Singaporean Dermatology Devices Market
7.6.1 Singaporean Dermatology Devices Market, By Type
7.6.1.1 Singaporean Dermatology Treatment Devices Market, By Product
7.6.1.1.1 Singaporean Dermatology Treatment Devices Market in Lasers, By
Type/Application
7.6.1.2 Singaporean Dermatology Diagnostic Devices Market, By Product
7.6.1.2.1 Singaporean Dermatology Diagnostic Devices Market in Imaging Techniques, By
Type
7.6.1.2.2 Singaporean Dermatology Diagnostic Devices Market in Dermatoscope, By Type
7.7 Malaysian Dermatology Devices Market
7.7.1 Malaysian Dermatology Devices Market, By Type
7.7.1.1 Malaysian Dermatology Treatment Devices Market, By Product
7.7.1.1.1 Malaysian Dermatology Treatment Devices Market in Lasers, By Type/Application
7.7.1.2 Malaysian Dermatology Diagnostic Devices Market, By Product
7.7.1.2.1 Malaysian Dermatology Diagnostic Devices Market in Imaging Techniques, By
Type
7.7.1.2.2 Malaysian Dermatology Diagnostic Devices Market in Dermatoscope, By Type
7.8 Indonesian Dermatology Devices Market
7.8.1 Indonesian Dermatology Devices Market, By Type
7.8.1.1 Indonesian Dermatology Treatment Devices Market, By Product
7.8.1.1.1 Indonesian Dermatology Treatment Devices Market in Lasers, By Type/Application
7.8.1.2 Indonesian Dermatology Diagnostic Devices Market, By Product
7.8.1.2.1 Indonesian Dermatology Diagnostic Devices Market in Imaging Techniques, By
Type
7.8.1.2.2 Indonesian Dermatology Diagnostic Devices Market in Dermatoscope, By Type
7.9 Rest of Asia (ROA) Dermatology Devices Market
7.9.1 Rest of Asia (ROA) Dermatology Devices Market, By Type
7.9.1.1 Rest of Asia (ROA) Dermatology Treatment Devices Market, By Product
7.9.1.1.1 Rest of Asia (ROA) Dermatology Treatment Devices Market in Lasers, By
Type/Application
7.9.1.2 Rest of Asia (ROA) Dermatology Diagnostic Devices Market, By Product
7.9.1.2.1 Rest of Asia (ROA) Dermatology Diagnostic Devices Market in Imaging
Techniques, By Type
7.9.1.2.2 Rest of Asia (ROA) Dermatology Diagnostic Devices Market in Dermatoscope, By
Type
8 Asian Dermatology Devices Market: Competitive Landscape (Page No. - 135)
8.1 Asian Dermatology Devices Market: By Company
8.1.1 Asian Dermatology Treatment Devices Market: By Company
8.1.2 Asian Dermatology Diagnostic Devices Market: By Company
8.2 Company Presence in Dermatology Devices Market, By Type
8.3 Mergers & Acquisitions
8.4 New Product Launches
9 Asian Dermatology Devices Market: Company Profiles (Page No. - 141)
9.1 ALMA Lasers, Ltd.
9.1.1 Overview
9.1.2 EY Financials
9.1.3 Product And Service Offerings
9.1.4 Related Developments
9.2 Ambicare Health Ltd.
9.2.1 Overview
9.2.2 Key Financials
9.2.3 Product And Service Offerings
9.2.4 Related Developments
9.3 amd Global Telemedicine Inc
9.3.1 Overview
9.3.2 Key Financials
9.3.3 Product and Service Offerings
9.3.4 Related Developments
9.4 Applisonix Ltd
9.4.1 Overview
9.4.2 Key Financials
9.4.3 Product and Service Offerings
9.4.4 Related Developments
9.5 Biolitec0020AG
9.5.1 Overview
9.5.2 Key Financials
9.5.3 Product and Service Offerings
9.5.4 Related Developments
9.6 Carl Zeiss
9.6.1 Overview
9.6.2 Key Financials
9.6.3 Product and Service Offerings
9.6.4 Related Developments
9.6.5 Overview
9.6.6 Key Financials
9.6.7 Product And Service Offerings
9.6.8 Related Developments
9.7 Cynosure, Inc.
9.7.1 Overview
9.7.2 Key Financials
9.7.3 Product and Service Offerings
9.7.4 Related Developments
9.8 Ellipse A/S
9.8.1 Overview
9.8.2 Key Financials
9.8.3 Product and Service Offerings
9.8.4 Related Developments
9.9 fei Company
9.9.1 Overview
9.9.2 Key Financials
9.9.3 Product and Service Offerings
9.9.4 Related Developments
9.10 Fotofinder Systems GMBH
9.10.1 Overview
9.10.2 Key Financials
9.10.3 Product and Service Offerings
9.10.4 Related Developments
9.11 Genesis Biosystems.
9.11.1 Overview
9.11.2 Key Financials
9.11.3 Product and Service Offerings
9.11.4 Related Developments
9.12 Leica Microsystems
9.12.1 Overview
9.12.2 Key Financials
9.12.3 Product and Service Offerings
9.12.4 Related Developments
9.13 Lumenis Ltd.
9.13.1 Overview
9.13.2 Key Financials
9.13.3 Product and Service Offerings
9.13.4 Related Developments
9.14 Michelson Diagnostics Ltd
9.14.1 Overview
9.14.2 Key Financials
9.14.3 Product and Service Offerings
9.14.4 Related Developments
9.15 Nikon Corporation
9.15.1 Overview
9.15.2 Key Financials
9.15.3 Product and Service Offerings
9.15.4 Related Developments
9.16 Mela Sciences, Inc.
9.16.1 Overview
9.16.2 Key Financials
9.16.3 Product and Service Offerings
9.16.4 Related Developments
9.17 Verisante Technology, Inc.
9.17.1 Overview
9.17.2 Key Financials
9.17.3 Product and Service Offerings
9.17.4 Related Developments
9.18 Syneron Medical Ltd
9.18.1 Overview
9.18.2 Key Financials
9.18.3 Product and Service Offerings
9.18.4 Related Developments
9.19 Heine Optotechnik
9.19.1 Overview
9.19.2 Key Financials
9.19.3 Product and Service Offerings
9.19.4 Related Developments
9.20 Solta Medical, Llc. (Division of Valeant Pharmaceuticals North America, Llc.)
9.20.1 Overview
9.20.2 Key Financials
9.20.3 Product and Service Offerings
9.20.4 Related Developments
9.21 Photomedex, Inc.
9.21.1 Overview
9.21.2 Key Financials
9.21.3 Product and Service Offerings
9.21.4 Related Developments
10 Appendix (Page No. - 177)
10.1 Customization Options
10.1.1 Supply Chain Analysis
10.1.2 Impact Analysis
10.2 Related Reports
10.3 Introducing RT: Real Time Market Intelligence
10.3.1 RT Snapshots
List of Tables (92 Tables)
Table 1 Asian Dermatology Devices Market: Prevalent Cases of Melanoma of Skin (Males and Females), By Geography, 2014
Table 2 Asian Dermatology Devices Market: Comparison With Asian Medical Devices Market, 2013 – 2019 (USD MN)
Table 3 Asian Dermatology Devices Market: Drivers And Inhibitors
Table 4 Asian Dermatology Devices Market, By Geography, 2013 - 2019 (USD MN)
Table 5 Asian Dermatology Devices Market, By Type, 2013 - 2019 (USD MN)
Table 6 Asian Dermatology Treatment Devices Market, By Product, 2013 - 2019 (USD MN)
Table 7 Asian Dermatology Lasers Market, By Type, 2013 - 2019 (USD MN)
Table 8 Asian Dermatology Lasers Market, By Application, 2013 - 2019 (USD MN)
Table 9 Asian Dermatology Diagnostic Devices Market, By Product, 2013 - 2019 (USD MN)
Table 10 Imaging Techniques in Asian Dermatology Devices Market, By Type, 2013 - 2019 (USD MN)
Table 11 Dermatoscopes in Asian Dermatology Devices Market, By Product,2013 - 2019 (USD MN)
Table 12 Asian Dermatology Devices Market, By Type, 2013 - 2019 (USD MN)
Table 13 Asian Dermatology Treatment Devices Market, By Geography,2013 - 2019 (USD MN)
Table 14 Asian Dermatology Diagnostic Devices Market, By Geography,2013 - 2019 (USD MN)
Table 15 Asian Dermatology Devices Market: Product Comparison Asian Dermatology Devices Market, 2013–2019 (USD MN)
Table 16 Asian Dermatology Devices Market, By End-User, 2013-2019 (USD MN)
Table 17 Asian Dermatology Devices Market in Clinics, By Geography,2013-2019 (USD MN)
Table 18 Asian Dermatology Devices Market in Hospitals, By Geography,2013-2019 (USD MN)
Table 19 Asian Dermatology Devices Market: End-User Comparison With Asian Dermatology Devices Market, 2013–2019 (USD MN)
Table 20 Asian Dermatology Devices Market, By Geography, 2013-2019 (USD MN)
Table 21 Chinese Dermatology Devices Market, By Type, 2013-2019 (USD MN)
Table 22 Chinese Dermatology Treatment Devices Market, By Product,2013-2019 (USD MN)
Table 23 Chinese Dermatology Treatment Devices Market in Lasers, By Type,2013-2019 (USD MN)
Table 24 Chinese Dermatology Treatment Devices Market in Lasers, By Application, 2013-2019 (USD MN)
Table 25 Chinese Dermatology Diagnostic Devices Market, By Product,2013-2019 (USD MN)
Table 26 Chinese Dermatology Treatment Devices Market in Imaging Techniques,By Type, 2013-2019 (USD MN)
Table 27 Chinese Dermatology Treatment Devices Market in Dermatoscope, By Type, 2013-2019 (USD MN)
Table 28 Japanese Dermatology Devices Market, By Type, 2013-2019 (USD MN)
Table 29 Japanese Dermatology Treatment Devices Market, By Product,2013-2019 (USD MN)
Table 30 Japanese Dermatology Treatment Devices Market in Lasers, By Type,2013-2019 (USD MN)
Table 31 Japanese Dermatology Treatment Devices Market in Lasers, By Application, 2013-2019 (USD MN)
Table 32 Japanese Dermatology Diagnostic Devices Market, By Product,2013-2019 (USD MN)
Table 33 Japanese Dermatology Treatment Devices Market in Imaging Techniques, By Type, 2013-2019 (USD MN)
Table 34 Japanese Dermatology Treatment Devices Market in Dermatoscope,By Type, 2013-2019 (USD MN)
Table 35 Indian Dermatology Devices Market, By Type, 2013-2019 (USD MN)
Table 36 Indian Dermatology Treatment Devices Market, By Product,2013-2019 (USD MN)
Table 37 Indian Dermatology Treatment Devices Market in Lasers, By Type,2013-2019 (USD MN)
Table 38 Indian Dermatology Treatment Devices Market in Lasers, By Application, 2013-2019 (USD MN)
Table 39 Indian Dermatology Diagnostic Devices Market, By Product,2013-2019 (USD MN)
Table 40 Indian Dermatology Treatment Devices Market in Imaging Techniques,By Type, 2013-2019 (USD MN)
Table 41 Indian Dermatology Treatment Devices Market in Dermatoscope, By Type, 2013-2019 (USD MN)
Table 42 Korean Dermatology Devices Market, By Type, 2013-2019 (USD MN)
Table 43 Korean Dermatology Treatment Devices Market, By Product,2013-2019 (USD MN)
Table 44 Korean Dermatology Treatment Devices Market in Lasers, By Type,2013-2019 (USD MN)
Table 45 Korean Dermatology Treatment Devices Market in Lasers, By Application, 2013-2019 (USD MN)
Table 46 Korean Dermatology Diagnostic Devices Market, By Product,2013-2019 (USD MN)
Table 47 Korean Dermatology Treatment Devices Market in Imaging Techniques,By Type, 2013-2019 (USD MN)
Table 48 Korean Dermatology Treatment Devices Market in Dermatoscope, By Type, 2013-2019 (USD MN)
Table 49 Singaporean Dermatology Devices Market, By Type, 2013-2019 (USD MN)
Table 50 Singaporean Dermatology Treatment Devices Market, By Product,2013-2019 (USD MN)
Table 51 Singaporean Dermatology Treatment Devices Market in Lasers, By Type, 2013-2019 (USD MN)
Table 52 Singaporean Dermatology Treatment Devices Market in Lasers, By Application, 2013-2019 (USD MN)
Table 53 Singaporean Dermatology Diagnostic Devices Market, By Product,2013-2019 (USD MN)
Table 54 Singaporean Dermatology Treatment Devices Market in Imaging Techniques, By Type, 2013-2019 (USD MN)
Table 55 Singaporean Dermatology Treatment Devices Market in Dermatoscope,By Type, 2013-2019 (USD MN)
Table 56 Malaysian Dermatology Devices Market, By Type, 2013-2019 (USD MN)
Table 57 Malaysian Dermatology Treatment Devices Market, By Product,2013-2019 (USD MN)
Table 58 Malaysian Dermatology Treatment Devices Market in Lasers, By Type, 2013-2019 (USD MN)
Table 59 Malaysian Dermatology Treatment Devices Market in Lasers, By Application, 2013-2019 (USD MN)
Table 60 Malaysian Dermatology Diagnostic Devices Market, By Product,2013-2019 (USD MN)
Table 61 Malaysian Dermatology Treatment Devices Market in Imaging Techniques, By Type, 2013-2019 (USD MN)
Table 62 Malaysian Dermatology Treatment Devices Market in Dermatoscope,By Type, 2013-2019 (USD MN)
Table 63 Indonesian Dermatology Devices Market, By Type, 2013-2019 (USD MN)
Table 64 Indonesian Dermatology Treatment Devices Market, By Product,2013-2019 (USD MN)
Table 65 Indonesian Dermatology Treatment Devices Market in Lasers, By Type, 2013-2019 (USD MN)
Table 66 Indonesian Dermatology Treatment Devices Market in Lasers, By Application, 2013-2019 (USD MN)
Table 67 Indonesian Dermatology Diagnostic Devices Market, By Product,2013-2019 (USD MN)
Table 68 Indonesian Dermatology Treatment Devices Market in Imaging Techniques, By Type, 2013-2019 (USD MN)
Table 69 Indonesian Dermatology Treatment Devices Market in Dermatoscope,By Type, 2013-2019 (USD MN)
Table 70 Rest of Asia (ROA) Dermatology Devices Market, By Type, 2013-2019 (USD MN)
Table 71 Rest of Asia (ROA) Dermatology Treatment Devices Market, By Product, 2013-2019 (USD MN)
Table 72 Rest of Asia (ROA) Dermatology Treatment Devices Market in Lasers,By Type, 2013-2019 (USD MN)
Table 73 Rest of Asia (ROA) Dermatology Treatment Devices Market in Lasers,By Application, 2013-2019 (USD MN)
Table 74 Rest of Asia (ROA) Dermatology Diagnostic Devices Market, By Product, 2013-2019 (USD MN)
Table 75 Rest of Asia (ROA) Dermatology Treatment Devices Market in Imaging Techniques, By Type, 2013-2019 (USD MN)
Table 76 Rest of Asia (ROA) Dermatology Treatment Devices Market in Dermatoscope, By Type, 2013-2019 (USD MN)
Table 77 Asian Dermatology Treatment Devices Market, By Company
Table 78 Asian Dermatology Diagnostic Devices Market Share (%), By Company, 2013
Table 79 North America Dermatology Devices Market: Mergers & Acquisitions
Table 80 North America Dermatology Devices Market: New Product Launches
Table 81 Carl Zeiss: Key Financials, 2011 - 2013 (USD MN)
Table 82 Cutera, Inc: Key Financials, 2011 - 2013 (USD MN)
Table 83 Cynosure, Inc.: Key Financials, 2011 - 2013 (USD MN)
Table 84 Cynosure, Inc.: Key Financials, 2011 - 2013 (USD MN)
Table 85 Leica Microsystems: Key Financials, 2011 - 2013 (USD MN)
Table 86 Lumenis Ltd: Key Financials, 2011 - 2013 (USD MN)
Table 87 Nikon Corporation: Key Financials, 2012 - 2014 (USD MN)
Table 88 Mela Sciences, Inc: Key Financials, 2012 - 2013 (USD MN)
Table 89 Verisante Technology: Key Financials, 2012 - 2014 (USD MN)
Table 90 Syneron Medical Ltd: Key Financials, 2012 - 2014 (USD MN)
Table 91 Solta Medical, Llc. (Division of Valeant Pharmaceuticals North America, Llc.): Key Financials, 2011 - 2013 (USD MN)
Table 92 Photomedex, Inc.: Key Financials, 2011 - 2013 (USD MN)
List of Figures (92 Figures)
Figure 1 Asian Dermatology Devices Market: Segmentation & Coverage
Figure 2 Dermatology Devices Market: Integrated Ecosystem
Figure 3 Top-Down Approach
Figure 4 Global Dermatology Devices Market: Peers
Figure 5 Asian Dermatology Devices Market: Prevalent Cases of Melanoma of Skin (Males And Females), By Geography, 2014
Figure 6 Asian Dermatology Devices Market Snapshot (Top Markets), 2014
Figure 7 Asian Dermatology Devices Market, By Geography, 2013 - 2019 (USD MN)
Figure 8 Asian Dermatology Devices Market, By Type, 2013 - 2019 (USD MN)
Figure 9 Asian Dermatology Treatment Devices Market, By Type, 2013 - 2019 (USD MN)
Figure 10 Asian Dermatology Lasers Market, By Type, 2013 - 2019 (USD MN)
Figure 11 Asian Dermatology Lasers Market, By Application, 2013 - 2019 (USD MN)
Figure 12 Asian Dermatology Diagnostic Devices Market, By Product, 2013 - 2019 (USD MN)
Figure 13 Imaging Techniques in Asian Dermatology Devices Market, By Type,2013 - 2019 (Usd Mn
Figure 14 Dermatoscopes in Asian Dermatology Devices Market, By Product, 2013 - 2019 (USD MN)
Figure 15 Asian Dermatology Devices Market, By Type, 2014
Figure 16 Asian Dermatology Devices Market, By Type, 2013 - 2019 (USD MN)
Figure 17 Asian Dermatology Treatment Devices Market, By Geography,2013 - 2019 (USD MN)
Figure 18 Asian Dermatology Diagnostic Devices Market, By Geography,2013 - 2019 (USD MN)
Figure 19 Asian Dermatology Devices Market: Product Comparison Asian Dermatology Devices Market, 2013–2019 (USD MN)
Figure 20 Asian Dermatology Devices Market, By End-User, 2014
Figure 21 Asian Dermatology Devices Market, By End-User: Number of Plastic Surgeons, 2013
Figure 22 Asian Dermatology Devices Market, By End-User, 2013-2019 (USD MN)
Figure 23 Asian Dermatology Devices Market in Clinics, By Geography,2013-2019 (USD MN)
Figure 24 Asian Dermatology Devices Market in Hospitals, By Geography,2013-2019 (USD MN)
Figure 25 Asian Dermatology Devices Market: End-User Comparison With Asian Dermatology Devices Market, 2013–2019 (USD MN)
Figure 26 Asian Dermatology Devices Market, By Geography, 2014
Figure 27 Chinese Dermatology Devices Market Share, 2014 & 2019 (%)
Figure 28 Chinese Dermatology Devices Market, By Type, 2013-2019 (USD MN)
Figure 29 Chinese Dermatology Treatment Devices Market, By Product,2013-2019 (USD MN)
Figure 30 Chinese Dermatology Treatment Devices Market in Lasers, By Type,2013-2019 (USD MN)
Figure 31 Chinese Dermatology Treatment Devices Market in Lasers, By Application, 2013-2019 (USD MN)
Figure 32 Chinese Dermatology Diagnostic Devices Market, By Product,2013-2019 (USD MN)
Figure 33 Chinese Dermatology Treatment Devices Market in Imaging Techniques,By Type, 2013-2019 (USD MN)
Figure 34 Chinese Dermatology Treatment Devices Market in Dermatoscope, By Type, 2013-2019 (USD MN)
Figure 35 Japanese Dermatology Devices Market Share, 2014 & 2019 (%)
Figure 36 Japanese Dermatology Devices Market, By Type, 2013-2019 (USD MN)
Figure 37 Japanese Dermatology Treatment Devices Market, By Product,2013-2019 (USD MN)
Figure 38 Japanese Dermatology Treatment Devices Market in Lasers, By Type,2013-2019 (USD MN)
Figure 39 Japanese Dermatology Treatment Devices Market in Lasers, By Application, 2013-2019 (USD MN)
Figure 40 Japanese Dermatology Diagnostic Devices Market, By Product,2013-2019 (USD MN)
Figure 41 Japanese Dermatology Treatment Devices Market in Imaging Techniques, By Type, 2013-2019 (USD MN)
Figure 42 Japanese Dermatology Treatment Devices Market in Dermatoscope, By Type, 2013-2019 (USD MN)
Figure 43 Indian Dermatology Devices Market Share, 2014 & 2019 (%)
Figure 44 Indian Dermatology Devices Market, By Type, 2013-2019 (USD MN)
Figure 45 Indian Dermatology Treatment Devices Market, By Product,2013-2019 (USD MN)
Figure 46 Indian Dermatology Treatment Devices Market in Lasers, By Type,2013-2019 (USD MN)
Figure 47 Indian Dermatology Treatment Devices Market in Lasers, By Application, 2013-2019 (USD MN)
Figure 48 Indian Dermatology Diagnostic Devices Market, By Product,2013-2019 (USD MN)
Figure 49 Indian Dermatology Treatment Devices Market in Imaging Techniques,By Type, 2013-2019 (USD MN)
Figure 50 Indian Dermatology Treatment Devices Market in Dermatoscope, By Type, 2013-2019 (USD MN)
Figure 51 Korean Dermatology Devices Market Share, 2014 & 2019 (%)
Figure 52 Korean Dermatology Devices Market, By Type, 2013-2019 (USD MN)
Figure 53 Korean Dermatology Treatment Devices Market, By Product,2013-2019 (USD MN)
Figure 54 Korean Dermatology Treatment Devices Market in Lasers, By Type,2013-2019 (USD MN)
Figure 55 Korean Dermatology Treatment Devices Market in Lasers, By Application, 2013-2019 (USD MN)
Figure 56 Korean Dermatology Diagnostic Devices Market, By Product,2013-2019 (USD MN)
Figure 57 Korean Dermatology Treatment Devices Market in Imaging Techniques,By Type, 2013-2019 (USD MN)
Figure 58 Korean Dermatology Treatment Devices Market in Dermatoscope, By Type, 2013-2019 (USD MN)
Figure 59 Singaporean Dermatology Devices Market Share, 2014 & 2019 (%)
Figure 60 Singaporean Dermatology Devices Market, By Type, 2013-2019 (USD MN)
Figure 61 Singaporean Dermatology Treatment Devices Market, By Product,2013-2019 (USD MN)
Figure 62 Singaporean Dermatology Treatment Devices Market in Lasers, By Type, 2013-2019 (USD MN)
Figure 63 Singaporean Dermatology Treatment Devices Market in Lasers, By Application, 2013-2019 (USD MN)
Figure 64 Singaporean Dermatology Diagnostic Devices Market, By Product,2013-2019 (USD MN)
Figure 65 Singaporean Dermatology Treatment Devices Market in Imaging Techniques, By Type, 2013-2019 (USD MN)
Figure 66 Singaporean Dermatology Treatment Devices Market in Dermatoscope,By Type, 2013-2019 (USD MN)
Figure 67 Malaysian Dermatology Devices Market Share, 2014 & 2019 (%)
Figure 68 Malaysian Dermatology Devices Market, By Type, 2013-2019 (USD MN)
Figure 69 Malaysian Dermatology Treatment Devices Market, By Product,2013-2019 (USD MN)
Figure 70 Malaysian Dermatology Treatment Devices Market in Lasers, By Type,2013-2019 (USD MN)
Figure 71 Malaysian Dermatology Treatment Devices Market in Lasers, By Application, 2013-2019 (USD MN)
Figure 72 Malaysian Dermatology Diagnostic Devices Market, By Product,2013-2019 (USD MN)
Figure 73 Malaysian Dermatology Treatment Devices Market in Imaging Techniques, By Type, 2013-2019 (USD MN)
Figure 74 Malaysian Dermatology Treatment Devices Market in Dermatoscope,By Type, 2013-2019 (USD MN)
Figure 75 Indonesian Dermatology Devices Market Share, 2014 & 2019 (%)
Figure 76 Indonesian Dermatology Devices Market, By Type, 2013-2019 (USD MN)
Figure 77 Indonesian Dermatology Treatment Devices Market, By Product,2013-2019 (USD MN)
Figure 78 Indonesian Dermatology Treatment Devices Market in Lasers, By Type, 2013-2019 (USD MN)
Figure 79 Indonesian Dermatology Treatment Devices Market in Lasers, By Application, 2013-2019 (USD MN)
Figure 80 Indonesian Dermatology Diagnostic Devices Market, By Product,2013-2019 (USD MN)
Figure 81 Indonesian Dermatology Treatment Devices Market in Imaging Techniques, By Type, 2013-2019 (USD MN)
Figure 82 Indonesian Dermatology Treatment Devices Market in Dermatoscope,By Type, 2013-2019 (USD MN)
Figure 83 Rest of Asia (ROA) Dermatology Devices Market Share, 2014 & 2019 (%)
Figure 84 Rest of Asia (ROA) Dermatology Devices Market, By Type, 2013-2019 (USD MN)
Figure 85 Rest of Asia (ROA) Dermatology Treatment Devices Market, By Product, 2013-2019 (USD MN)
Figure 86 Rest of Asia (ROA) Dermatology Treatment Devices Market in Lasers, By Type, 2013-2019 (USD MN)
Figure 87 Rest of Asia (ROA) Dermatology Treatment Devices Market in Lasers, By Application, 2013-2019 (USD MN)
Figure 88 Rest of Asia (ROA) Dermatology Diagnostic Devices Market, By Product, 2013-2019 (USD MN)
Figure 89 Rest of Asia (ROA) Dermatology Treatment Devices Market in Imaging Techniques, By Type, 2013-2019 (USD MN)
Figure 90 Rest of Asia (ROA) Dermatology Treatment Devices Market in Dermatoscope, By Type, 2013-2019 (USD MN)
Figure 91 Asian Dermatology Diagnostic Devices Market Share (%), By Company, 2013
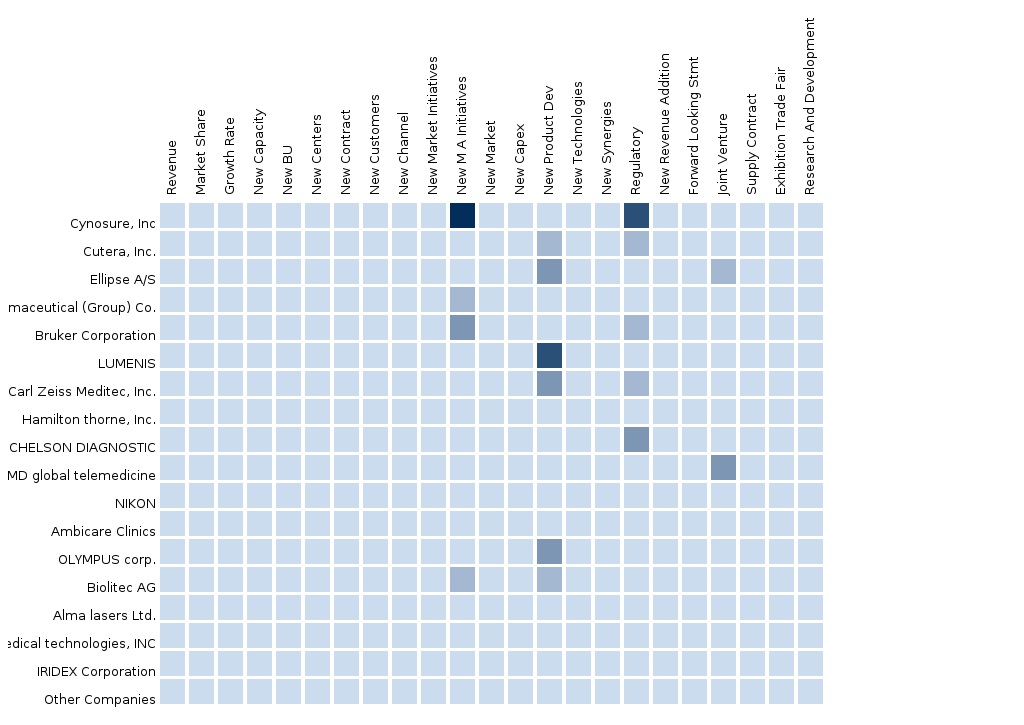
Figure 92 Dermatology Devices Market: Company Product Coverage, By Type, 2013
The Asian dermatology devices market report categorizes this market in terms of type, end-user, and geography. The types include dermatology diagnostic devices and dermatology treatment devices. Furthermore, the dermatology diagnostic devices market covers the dermatoscopes, microscopes and imaging techniques, whereas the dermatology treatment devices consists of electrosurgical equipment, liposuction devices, microdermabrasion, cryotherapy devices, LED light therapy devices, and lasers (carbon dioxide laser, pulsed dye laser, diode laser, argon laser, ruby laser, ER: YAG laser, Nd: YAG laser, and intense pulse light). The end-user segment includes hospitals and clinics. The geographies covered are China, Japan, India, Korea, Singapore, Malaysia, Indonesia, and Rest of Asia (RoA). The Rest of Asia (RoA) segment covers countries such as Taiwan, Mauritius, Vietnam, and the Philippines. The study is based on primary and secondary research, and analyzes the market based on patents, product sales, and competitive scenario. It also studies and analyzes trends and opportunities in the market.
There have been rising incidences of various skin disorders, such as melanoma, psoriasis, vascular lesions, and acne. Among these disorders, melanoma is a type of skin cancer that predominantly develops on the skin and is easily visible to the naked eye. However, the challenge lies in recognizing the early symptoms, so that the appropriate treatment can be initiated before the tumor reaches a thickness of 0.76 mm, which can be fatal for the patient. In the recent years, there has been a significant increase in the demand for various procedures and surgeries for the treatment of skin ailments. Various sophisticated diagnostic instruments, such as dermatoscopes, OCT scanners, and hand-held scanners allow an early detection of melanoma, thereby improving survival rates and reducing the number of biopsies in future, and also the costs of healthcare. The advancements in technology have enabled the development of new, accurate, sensitive, and quantitative diagnostic instruments that have the potential to treat a number of skin disorders. Quantitative Thermographic Imaging (QTI), Confocal Microscopy, and Optical Coherence Tomography (OCT) have been revolutionizing the diagnostic procedures. White-light and polarized-light imaging, spatial and spectroscopic multispectral methods, and Terahertz (THZ) imaging methods have also been applied in certain cases to effectively treat patients.
In 2014, the Asian dermatology devices market was valued at $1,865.8 million and is expected to reach a value of $3,186.6 million by 2019, at a CAGR of 11.3% from 2014 to 2019. The dermatology treatment devices segment dominated the Asian market, with a market share of 94.6% in 2014, followed by the dermatology diagnostic devices segment. The demand for the dermatology devices market in emerging countries is expected to rise due to factors such as increasing awareness among surgeons and the price sensitive nature of the market. Major players in the dermatology devices market are facing tough competition from low-cost manufacturers in China and Italy, as these manufacturers offer devices at a 60% to 70% lesser price, as compared to other players. For instance, in October 2014, Cynosure, Inc. (U.S.) reported that in their third-quarter revenues of $71.5 million, revenue from their Asian subsidiaries increased to 46.0% from the previous one.
The major players in the dermatology devices market include Heine Optotechnik (Germany), Optomed Oy (Finland), FotoFinder Systems (Germany), Michelson diagnostics (UK), Genesis Biosystems (U.S.), Ellipse A/S (Denmark), Alma Lasers (Israel), Palomar Technologies (U.S.), GE Healthcare (UK), Philips Healthcare (Netherlands), 3Gen LLC (U.S.), Welch Allyn (U.S.), Carl Zeiss Meditec, Inc. (U.S.), Hitachi (Japan), Leica Microsystems (Germany), Olympus (Japan), Toshiba Medical Systems (Japan), and Siemens Medical Systems (Germany).
Please visit https://www.micromarketmonitor.com/custom-research-services.html to specify your custom Research Requirement
| PRODUCT TITLE | PUBLISHED | |
|---|---|---|
|
|
Brazil Medical Devices Peers of Brazil medical devices are Orthopedic Devices, Ophthalmology devices, Endoscopy and Neurology Devices comprising 12.8%, 9.2%, 7.2% and 1.9% respectively of the Global Medical Devices market. It is segmented on basis of endusers and... |
Nov 2015 |


