

U.S. Software Defined Networking (SDN) Market
- Publish Date: Upcoming


U.S. Software Defined Networking (SDN) market is estimated to grow from $81.2 million in 2013 to $1,185.2 million by 2019, at a CAGR of 55.3% for the given period. The U.S. Software Defined Networking (SDN) market is primarily driven by the changing traffic patterns in data centers.
Software Defined Networking (SDN) is an advanced way of networking in which the control of the network is de-coupled from the physical hardware and is handled by a software application, called “Controller.” This way, it becomes easy to minimize the limitations of network due to its physical infrastructure. In traditional network architecture, when a packet arrives at a switch, protocols built into the switch’s proprietary firmware tell the switch where to forward the packet. The switch sends every packet with the same destination over the same path, and treats all the packets in the same way. The traditional switches do not perform the application-specific traffic routing. However, in large enterprises, smart switches are been used which are designed with application-specific integrated circuits, and are sophisticated enough to recognize different types of packets and treat them differently. But, the limitation with these switches is that they are too expensive. SDN offers a cost-effective networking approach with an aim to lower down the operational cost thereby reducing latency and performing efficient network traffic management.
In U.S., the traffic patterns in data centers have changed from the traditional ‘north-south’ approach of client/server to ‘east-west’ approach of communicating between different databases and servers before sending the data to the client. The data center workload is expected to grow at a CAGR of 16% from 2012 to 2017. SDN is enabling the organizations operating in U.S. to increase the speed and agility of their networks by real-time resource allocation and thus, leading to the efficient network management.
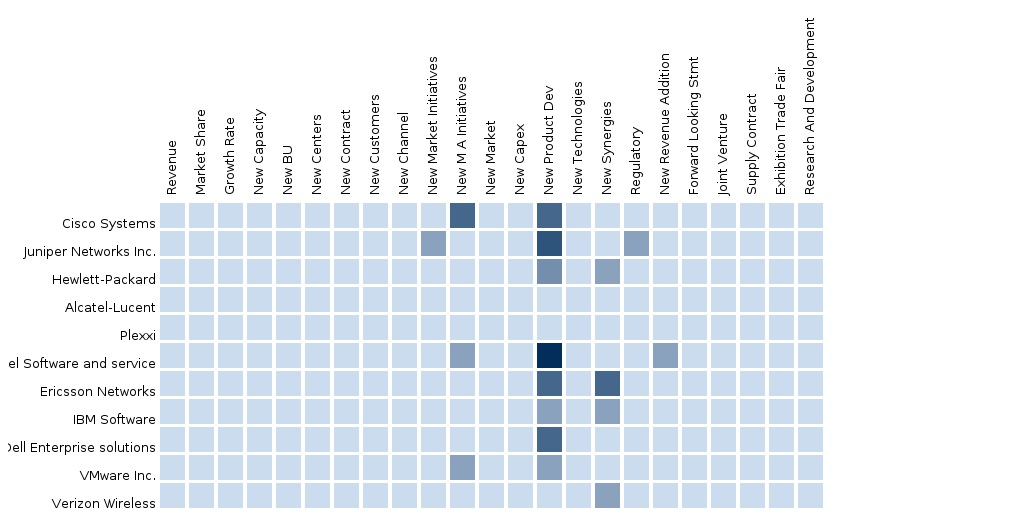
U.S. Software Defined Networking (SDN) market report provides a competitive benchmarking of the leading players in this market such as Cisco, Juniper Networks, HP, Plexxi and Alcatel-lucent in terms of their product offerings, key strategies, and operational parameters. U.S. Software Defined Networking (SDN) market report further provides the market trend, overall adoption scenario, competitive landscape and key drivers, restraints, and opportunities. U.S. Software Defined Networking (SDN) market report aims in estimating the current market size and the future growth potential of the different U.S. Software Defined Networking (SDN) market offerings across different technology trends, standards, business model, adoption factors, solutions and end-users.
Report Options:
U.S. Software Defined Networking (SDN) market segmentations covered in this report are:
- By Solution: SDN Switching, SDN Controllers, Cloud Virtualization Applications, and Network Virtualization Security
- By End-Users: Telecommunication Providers, Cloud Service Providers, and Enterprises
Customization Options:
Along with the MMM assessment, customize the report in alignment with your company’s specific needs. The following customization options provide a comprehensive summary of the industry standards and deep dive analysis:
U.S. Software Defined Networking (SDN) Market Solutions Matrix
- A comprehensive analysis and benchmarking of different market offerings by solutions and end-users in the U.S. Software Defined Networking (SDN) market
U.S. Software Defined Networking (SDN) Market Competitive Benchmarking
- Value-chain evaluation using events, developments, market data for vendors in the market ecosystem, across various end users, market segmentation and categorization
- Uncover the hidden opportunities by connecting related markets using cascaded value chain analysis
U.S. Software Defined Networking (SDN) Market Vendor Landscaping
- Vendor market watch and predictions, vendor market shares and offerings, categorization of adoption trends and market dominance (leaders, challengers, and followers)
U.S. Software Defined Networking (SDN) Market Data Tracker
- U.S. Software Defined Networking (SDN) market forecast and analysis
- Identification of the key end-user segments in U.S.
U.S. Software Defined Networking (SDN) Market Emerging Vendor Landscape
- Evaluate Tier-2/3 vendors’ market offerings using a 2X2 framework (realizing leaders, challengers, and followers)
U.S. Software Defined Networking (SDN) Market Channel Analysis
- Channel/distribution partners/alliances for tier-1 vendors and application-specific products being build towards the customer end of the value chain
1 Introduction
1.1 Key Take-aways
1.2 Report Description
1.3 Markets Covered
1.4 Stakeholders
1.5 Research Methodology
1.5.1 Key Data Points
1.5.2 Data Triangulation and Market Forecasting
1.6 Forecast Assumptions
2 Executive Summary
2.1 Abstract
2.2 Overall Market Size
3 Market Overview
3.1 Market Definition
3.2 Market Evolution
3.3 Business/Application/Cloud Orchestration
3.4 Path Computation Element (PCE)
3.5 Openflow
3.6 Market Segmentation
3.7 Market Dynamics
3.7.1 Drivers
3.7.2 Restraints
3.7.3 Opportunities
3.8 Impact Analysis of DRO
3.9 Value Chain
3.10 SDN Ecosystem
4 U.S. Software Defined Networking (SDN): Technology Trends, Standards, Business Model and Adoption Factors
4.1 Introduction
4.2 Technologies and Platforms
4.2.1 Recent Trends
4.2.2 Deep Packet Inspection (DPI)
4.2.3 Geographic Load Balancing
4.2.4 Power Management
4.2.5 Cloud Management
4.2.6 Software Applications
4.3 Standards
4.3.1 Data Center Bridging (DCB)
4.3.1.1 Priority Flow Control (PFC) 802.1qbb
4.3.1.2 Congestion Management (802.1qau)
4.3.1.3 Bandwidth Management (802.1qaz)
4.3.1.4 Data Center Bridging Exchange (CBX)
4.3.2 Fiber Channel Over Ethernet (FCOE)
4.3.3 Network Virtualization Using Generic Routing Encapsulation (NVGRE)
4.3.4 Shortest Path Bridging (Spb)
4.3.5 Transparent Interconnection of Lots of Links (TRILL)
4.3.6 Virtual Ethernet Port Aggregator (VEPA)
4.3.7 Multiprotocol Label Switching (MPLS)
4.3.8 Virtual Extensible Local Area Network (VXLAN)
4.4 Business Model
4.4.1 Business Model: Now
4.4.1.1 Manual Process-Driven Approach
4.4.1.2 Network Functionality At A Virtual Layer
4.4.1.3 Device Centricity
4.4.1.4 Openflow-Driven Approach
4.4.1.5 Critical Success Factors
4.4.2 Business Model: in The Future
4.4.2.1 Enterprise Data Center Networks Approach
4.4.2.2 Hyper-Scale Cloud Networking
4.4.2.3 SDN: A Function of Software Development
4.4.2.4 Collaboration With Virtual Networking Frameworks
4.4.2.5 Virtual Networking Leadership
4.5 SDN-Adoption Factors
4.5.1 Academia and Open Source Communities
4.5.1.1 Opendaylight
4.5.1.2 Opencontrail
4.5.1.3 Open Network Operating System (ONOS)
4.5.1.4 Floodlight
4.5.1.5 Nodeflow
4.5.1.6 Mininet
4.5.1.7 Snabb Switch
4.5.1.8 Openvswitch
4.5.1.9 Pantou
4.5.1.10 Nox
4.5.1.11 Pox
4.5.1.12 Jaxon
4.5.1.13 Routeflow
4.5.1.14 Flowvisor
4.5.1.15 Flowscale
4.5.2 Early Standardization
4.5.3 SDN Is A Solution Sell, Not A Box Sell
4.5.4 SDN Overcomes The “Rip and Replace” Strategy
4.5.5 Role of Var
4.6 Technology and Market Roadmap
4.6.1 SDN Inevitable
4.6.2 Functionality To Openflow Controllers
4.6.3 Revolutionizing Network Utilization
4.6.4 Transitioning For Competitive Advantage
4.6.5 Enterprise Commercialization
5 U.S. SDN Market Size, Analysis and Forecast By Solution
5.1 Introduction
5.2 SDN Switching
5.2.1 Overview
5.2.2 Markets Size and Forecast
5.2.3 Market Size & Forecast By Countries
5.3 SDN Controllers
5.3.1 Overview
5.3.2 Market Size & Forecast
5.3.3 Market Size and Forecast By Countries
5.4 Cloud Virtualization Applications
5.4.1 Overview
5.4.2 Market Size and Forecast
5.4.3 Market Size & Forecast By Countries
5.5 Network Virtualization Security
5.5.1 Overview
5.5.2 Market Size and Forecast
5.5.3 Market Size & Forecast By Countries
6 U.S. SDN: Market Analysis and Forecast By End Users
6.1 Introduction
6.2 Telecommunications Providers
6.2.1 Overview
6.2.2 Market Size and Forecast
6.2.3 Market Size & Forecast By Countries
6.3 Cloud Service Providers
6.3.1 Overview
6.3.2 Market Size and Forecast
6.3.3 Market Size & Forecast By Countries
6.4 Enterprises
6.4.1 Overview
6.4.2 Market Size and Forecast
6.4.3 Market Size & Forecast By Countries
7 U.S. SDN: Competitive Landscape
7.1 Competitive Landscape
7.2 Ecosystem and Roles
7.2.1 Portfolio Comparison
7.3 End-User Landscape
7.3.1 Market Opportunity Analysis
7.3.2 End-User Analysis
7.3.2.1 The Global Networking Is Expected to Reach $50 Billion By 2019
7.3.2.2 The Smartphone Market Will Experience Immense Growth By 2019 and Is Expected to Reach $9.3 Billion Driven By Byod Trend
7.3.2.3 Cloud Computing Market Is Expected to Reach $480 Billion By 2019 Driving The Demand For SDN Solutions
8 Company Profiles
8.1 AT&T Inc.
8.1.1 Introduction
8.1.2 Products & Services
8.1.3 Strategies & Insights
8.1.4 New Developments
8.1.5 MMM View
8.2 Cisco Systems, Inc.
8.2.1 Introduction
8.2.2 Products & Services
8.2.3 Strategies & Insights
8.2.4 New Developments
8.2.5 MMM View
8.3 Dell Inc.
8.3.1 Introduction
8.3.2 Products & Services
8.3.3 Strategies & Insights
8.3.4 New Developments
8.3.5 MMM View
8.4 Hewlett-Packard Company
8.4.1 Introduction
8.4.2 Products & Services
8.4.3 Strategies & Insights
8.4.4 New Developments
8.4.5 MMM View
8.5 Ibm
8.5.1 Introduction
8.5.2 Products & Services
8.5.3 Strategies & Insights
8.5.4 New Developments
8.5.5 MMM View
8.6 Intel Corporation
8.6.1 Introduction
8.6.2 Products & Services
8.6.3 Strategies & Insights
8.6.4 New Developments
8.6.5 MMM View
8.7 Juniper Networks
8.7.1 Introduction
8.7.2 Products & Services
8.7.3 Strategies & Insights
8.7.4 New Developments
8.7.5 MMM View
8.8 Nec Corporation
8.8.1 Introduction
8.8.2 Products & Services
8.8.3 Strategies & Insights
8.8.4 New Developments
8.8.5 MMM View
8.8 Pica8 Inc.
8.8.1 Introduction
8.8.2 Products & Services
8.8.3 Strategies & Insights
8.8.4 New Developments
8.8.5 MMM View
8.9 Plexxi, Inc.
8.9.1 Introduction
8.9.2 Products & Services
8.9.3 Strategies & Insights
8.9.4 New Developments
8.9.5 MMM View
8.10 Alcatel-Lucent
8.10.1 Introduction
8.10.2 Products & Services
8.10.3 Strategies & Insights
8.10.4 New Developments
8.10.5 MMM View
9 Appendix
9.1 Venture Capital (VC) Funding
9.2 Merger & Acquisitions (M&A)
List of Tables
Table 1 Forecast Assumptions
Table 2 Global SDN Market Size, 2014-2018 ($Million)
Table 3 U.S. SDN Market, By Solutions, 2014 – 2018 ($Million)
Table 4 U.S. SDN Market, By Solutions, 2014 – 2018 (Y-O-Y %)
Table 5 U.S. SDN: Switching Market, 2014-2018 ($Million, Y-O-Y %)
Table 6 U.S. SDN: Switching Market, By Countries, 2014 – 2018 ($Million)
Table 7 U.S. SDN: Switching Market, By Countries, 2014 – 2018 (Y-O-Y %)
Table 8 U.S. SDN: Controllers Market, 2014-2018 ($Million, Y-O-Y %)
Table 8 U.S. SDN: Controllers Market, By Countries, 2014 – 2018 ($Million)
Table 10 U.S. SDN: Controllers Market, By Countries, 2014 – 2018 (Y-O-Y %)
Table 11 U.S. SDN: Cloud Virtualization Application Market, 2014-2018 ($Million, Y-O-Y %)
Table 12 U.S. SDN: Cloud Virtualization Applications Market, By Countries, 2014 – 2018 ($Million)
Table 13 U.S. SDN: Cloud Virtualization Applications Market, By Countries, 2014 – 2018 (Y-O-Y %)
Table 14 U.S. SDN: Network Virtualization Security Market, 2014-2018 ($Million, Y-O-Y %)
Table 15 U.S. SDN: Network Virtualization Security Market, By Countries, 2014 – 2018 ($Million)
Table 16 U.S. SDN: Network Virtualization Security Market, By Countries, 2014 – 2018 (Y-O-Y %)
Table 17 U.S. SDN Market, By End-Users, 2014 – 2018 ($Million)
Table 18 U.S. SDN Market, By End-Users, 2014 – 2018 (Y-O-Y %)
Table 18 U.S. SDN: Telecommunications Provider Market, 2014-2018 ($ Million, Y-O-Y %)
Table 20 U.S. SDN: Telecom Providers Market, By Countries, 2014 – 2018 ($Million)
Table 21 U.S. SDN: Telecom Providers Market, By Countries, 2014 – 2018 (Y-O-Y %)
Table 22 U.S. SDN: Cloud Service Providers Market, 2014-2018 ($ Million, Y-O-Y %)
Table 23 U.S. SDN: Cloud Service Providers Market, By Countries, 2014 – 2018 ($Million)
Table 24 U.S. SDN: Cloud Service Providers Market, By Countries, 2014 – 2018 (Y-O-Y %)
Table 25 U.S. SDN: Enterprise Data Center Market, 2014-2018 ($ Million, Y-O-Y %)
Table 26 U.S. SDN: Enterprise Data Centers Market, By Countries, 2014 – 2018 ($Million)
Table 27 U.S. SDN: Enterprise Data Centers Market, By Countries, 2014 – 2018 (Y-O-Y %)
Table 28 U.S. SDN Market Revenue By Countries, 2014 – 2018 ($Million)
Table 28 U.S. SDN Market, By Countries, 2014 – 2018 (Y-O-Y %)
Table 30 U.S. SDN: North America Market, 2014-2018 ($Million, Y-O-Y %)
Table 31 U.S. SDN: North America Market, By End-Users, 2014 – 2018 ($Million)
Table 32 U.S. SDN: North America Market, By End-Users, 2014 – 2018 (Y-O-Y %)
Table 33 U.S. SDN: North America Market, By Solutions, 2014 – 2018 ($Million)
Table 34 U.S. SDN: North America Market, By Solutions, 2014 – 2018 (Y-O-Y %)
Table 35 U.S. SDN Competitive Ecosystem
Table 36 U.S. SDN: Venture Capital (Vc) Funding
Table 37 U.S. SDN: Mergers And Acquisitions (M&A)
List Of Figures
Figure 1 Secondary And Primary Research
Figure 2 Data Triangulation And Market Forecasting
Figure 3 Global SDN Market Size, 2014-2018 ($Million)
Figure 4 U.S. SDN Market Evolution
Figure 5 SDN Market Segmentation
Figure 6 Impact Analysis Of Dro On U.S. SDN Market
Figure 7 U.S. SDN: Value Chain
Figure 8 Aster*X Controller Design For The Main Control Logic
Figure 8 Google SDN Wan History
Figure 10 U.S. SDN Market, By Solutions, 2014 – 2018 (Y-O-Y %)
Figure 11 U.S. SDN: Switching Market, 2014-2018 ($Million, Y-O-Y %)
Figure 12 U.S. SDN: Switching Market, By Countries, 2014 – 2018 (Y-O-Y %)
Figure 13 U.S. SDN: Controllers Market, 2014-2018 ($Million, Y-O-Y %)
Figure 14 U.S. SDN: Controllers Market, By Countries, 2014 – 2018 (Y-O-Y %)
Figure 15 U.S. SDN: Cloud Virtualization Application Market, 2014-2018 ($Million, Y-O-Y %)
Figure 16 U.S. SDN: Cloud Virtualization Applications Market, By Countries, 2014 – 2018 (Y-O-Y %)
Figure 17 U.S. SDN: Network Virtualization Security Market, 2014-2018 ($Million, Y-O-Y %)
Figure 18 U.S. SDN: Network Virtualization Security Market, By Countries, 2014 – 2018 (Y-O-Y %)
Figure 18 U.S. SDN Market, By End-Users, 2014 – 2018 (Y-O-Y %)
Figure 20 U.S. SDN: Telecommunications Provider Market, 2014-2018 ($Million, Y-O-Y %)
Figure 21 U.S. SDN: Telecom Providers Market, By Countries, 2014 – 2018 (Y-O-Y %)
Figure 22 U.S. SDN: Cloud Service Providers Market, 2014-2018 ($Million, Y-O-Y %)
Figure 23 U.S. SDN: Cloud Service Providers Market, By Countries, 2014 – 2018 (Y-O-Y %)
Figure 24 U.S. SDN: Enterprise Data Center Market, 2014-2018 ($Million, Y-O-Y %)
Figure 25 U.S. SDN: Enterprise Data Centers Market, By Countries, 2014 – 2018 (Y-O-Y %)
Figure 26 U.S. SDN Market, By Countries, 2014 – 2018 (Y-O-Y %)
Figure 27 U.S. SDN Market: Parfait Chart
Figure 28 U.S. SDN: North America Market, 2014-2018 ($Million, Y-O-Y %)
Figure 28 U.S. SDN: North America Market, By End-Users, 2014 – 2018 (Y-O-Y %)
Figure 30 U.S. SDN: North America Market, By Solutions, 2014 – 2018 (Y-O-Y %)
Figure 31 U.S. SDN: Portfolio Comparison
Figure 32 U.S. SDN: Market Opportunity Plot
Please fill in the form below to receive a free copy of the Summary of this Report
Please visit https://www.micromarketmonitor.com/custom-research-services.html to specify your custom Research Requirement


