

U.S. Application Delivery Network (ADN) Market
- Publish Date: Upcoming


The U.S application delivery network market is estimated to grow from $0.89 billion in 2013 to $1.32 billion by 2018, at a CAGR of 8.1% from 2013 to 2018. The market for application delivery networks in the U.S is primarily driven by the increasing number of smart devices.
The application delivery network market is a combination of WAN optimization and application delivery control (ADC). The market deals with access of distributed applications over web, which are used by many organizations, and it is an effort to make that network more receptive and adaptive to IT business. Application delivery networks are needed for effective delivery of vital information over web and to provide protection against potential security threats that may interrupt or halt network operations. This report gives detailed insights into the U.S application delivery network market split across various products, regions, verticals, type of end-users, and end-user environments.
One of the major drivers for the U.S application delivery network market is data center consolidation. This driver is backed by the U.S. government. This has created a need for network delivery alternatives to enhance the real-time interaction between business applications and consolidated data centers. The application delivery network is one of the alternatives for enhanced delivery of applications, in order to achieve a greater degree of agility in terms of business applications.
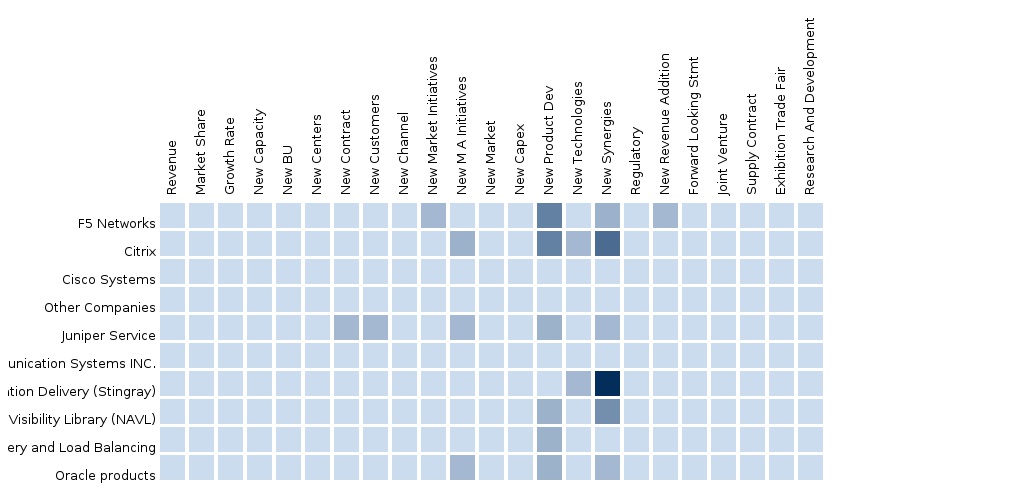
The report provides a competitive benchmarking of the leading players in this market. The market players include Brocade, Citrix Systems, F5 Network, Juniper Network, and Cisco. The report gives the financial analysis, which includes CAGR and market shares of the different region, vendors.
Report Options:
The application delivery network market segmentation covered in this report includes:
- By Products: Application controllers, application security equipment, and application gateways
- By End-Users Environment: Cloud service providers, telecommunications service providers, and enterprises
- By End-User: Small and medium businesses (SMBs), and enterprises
- By Vertical Segment: High tech, education, media and entertainment, BFSI, government, and retail, among others
Customization Options:
Along with the MMM assessment, customize the report in alignment with your company’s specific needs. The following customization options provide a comprehensive summary of the industry standards and a deep dive analysis of the market:
Application Delivery Network Solutions Matrix:
- A comprehensive analysis and benchmarking by products, by end-user environment, by end-user, and by vertical segment in the market
Application Delivery Network Competitive Benchmarking:
- Value-chain evaluation using events, developments, market data for vendors in the market ecosystem, across various industrial verticals, market segmentation and categorization
- To uncover hidden opportunities by connecting related markets using cascaded value chain analysis
Application Delivery Network Vendor Landscaping:
- Vendor market watch and predictions, vendor market shares and offerings, categorization of adoption trends and market dominance (leaders, challengers, and followers)
Application Delivery Network Market Data Tracker:
- Country-specific market forecast and analysis
- The identification of key end-user segments, by country
Application Delivery Network Vertical Analysis:
- An analysis of different industrial verticals by products, by end-user environment, by end-user, and by vertical segment in the market
Application Delivery Network Emerging Vendor Landscape:
- To evaluate Tier-2/3 vendors’ market offerings using a 2X2 framework (realizing leaders, challengers, and followers)
Application Delivery Network Channel Analysis:
- Channel/distribution partners/alliances for tier-1 vendors and application-specific products being build towards the customer end of the value chain
Application Delivery Network Client Tracker:
- The listing and analysis of deals, case studies, R&D investments, events, discussion forums, campaigns, alliances and partners of tier-1 and tier-2/3 vendors for the last 3 years
1 Introduction
1.1 Research Overview
1.1.1 Report Description
1.1.2 Key Take-aways
1.2 Research Methodology
1.2.1 Secondary And Primary Research
1.2.2 Data Triangulation And Forecasting
1.2.3 Forecast Assumptions
1.3 Market Overview
1.3.1 Markets Covered
1.3.2 Segment Definitions
2 Executive Summary
2.1.1 Abstract
2.1.2 Overall Market Size
3 U.S. ADN Market: Market Overview And Dynamics
3.1 Market Ecosystem
3.1.1 Mapping Trends
3.1.1.1 Bring-Your-Own Device (BYOD)
3.1.1.2 Network-Based Application Recognition (NBAR)
3.1.1.3 Carrier-Grade Network Address Translation (CGNAT)
3.1.1.4 Voice, Video, And Data Convergence
3.1.1.5 Server Load Balancing And Health Monitoring
3.1.2 Market Players And Roles
3.2 Market Dynamics
3.2.1 Drivers
3.2.2 Challenges
3.2.3 Opportunities
3.2.4 Time-Impact Analysis Of Dynamics
4 U.S. ADN Market Size And Forecast By Products
4.1 Overview And Introduction
4.2 Controllers
4.2.1 Overview
4.2.2 Market Size And Forecast By Countries
4.2.3 Market Size And Forecast By Verticals
4.2.4 Market Size And Forecast By End-User Environment
4.3 Application Security Equipments
4.3.1 Overview
4.3.2 Market Size And Forecast By Countries
4.3.3 Market Size And Forecast By Verticals
4.3.4 Market Size And Forecast By End-User Environment
4.4 Application Gateways
4.4.1 Overview
4.4.2 Market Size And Forecast By Countries
4.4.3 Market Size And Forecast By Verticals
4.4.4 Market Size And Forecast By End-User Environment
5 U.S. ADN Market Size And Forecast By End-User Environment
5.1 Overview And Introduction
5.2 Cloud Service Providers
5.2.1 Market Size And Forecast By Countries
5.3 Telecommunications Service Providers
5.3.1 Market Size And Forecast By Countries
5.4 Enterprises
5.4.1 Market Size And Forecast By Countries
6 U.S. ADN Market Size And Forecast By End-Users
6.1 Overview And Introduction
6.2 Small And Medium Businesses (SMB)
6.2.1 Market Size And Forecast By Countries
6.3 Enterprises
6.3.1 Market Size And Forecast By Countries
7 U.S. ADN Market Size And Forecast By Verticals
7.1 High-Tech
7.1.1 Overview
7.1.2 Market Size And Forecast By Products
7.1.3 Market Size And Forecast By Countries
7.2 Education
7.2.1 Overview
7.2.2 Market Size And Forecast By Products
7.2.3 Market Size And Forecast By Countries
7.3 Media And Entertainment
7.3.1 Overview
7.3.2 Market Size And Forecast By Products
7.3.3 Market Size And Forecast By Countries
7.4 Banking, Financial Services, And Insurance (BFSI)
7.4.1 Overview
7.4.2 Market Size And Forecast By Products
7.4.3 Market Size And Forecast By Countries
7.5 Government
7.5.1 Overview
7.5.2 Market Size And Forecast By Products
7.5.3 Market Size And Forecast By Countries
7.6 Retail
7.6.1 Overview
7.6.2 Market Size And Forecast By Products
7.6.3 Market Size And Forecast By Countries
7.7 Others
7.7.1 Overview
7.7.2 Market Size And Forecast By Products
7.7.3 Market Size And Forecast By Countries
8 U.S. ADN Market Analysis, Trends And Insights
8.1 Market Evolution
8.2 Market Uptake And Disruption
8.2.1 Lifecycle And Chasm Plot
8.2.2 Go To Market (GTM) Strategy
8.3 Market Roadmaps And Opportunity
8.3.1 Adoption Roadmaps
8.3.2 Opportunity Plots
9 ADN Competitive Landscape
9.1 Portfolio Comparison
9.2 Venture Capital (VC) Funding Analysis
9.3 Mergers And Acquisitions (M&A)
9.4 Social Reach
10 Company Profiles (MMM View, Overview, Products And Services, Financials, Strategies And Insights)
10.1 Array Networks
10.2 Aryaka Networks
10.3 A10 Networks
10.4 Blue Coat Systems
10.5 Brocade
10.6 Cisco Systems, Inc.
10.7 Citrix Systems, Inc.
10.8 Dell, Inc.
10.9 F5 Networks
10.10 Hewlett-Packard (HP)
10.11 Juniper Networks
10.12 Oracle Corporation
10.13 Radware
10.14 Riverbed Technology
10.15 Verizon
List Of Tables
Table 1 Application Delivery Network (ADN): Market Size, 2013 – 2019 ($Million)
Table 2 Market Proportions, By Products, 2013 – 2019 (%)
Table 3 Market Size, By Products, 2013 – 2019 ($Million)
Table 4 Market Growth, By Products, 2013 – 2019 (Y-O-Y %)
Table 5 Application Delivery Network (ADN): Controllers, Market Size, 2013 – 2019 (%)
Table 6 U.S. ADN: Controllers, Market Growth, 2013 – 2019 (Y-O-Y %)
Table 7 U.S. ADN: Controllers, Market Size, By Countries, 2013 – 2019 ($Million)
Table 8 U.S. ADN: Controllers, Market Growth, By Countries, 2013 – 2019 (Y-O-Y %)
Table 9 U.S. ADN: Controllers, Market Size, By Verticals, 2013 – 2019 ($Million)
Table 10 U.S. ADN: Controllers, Market Growth, By Verticals, 2013 – 2019 (Y-O-Y %)
Table 11 U.S. ADN: Controllers, Market Size, By End-User Environment, 2013 – 2019 ($Million)
Table 12 U.S. ADN: Controllers, Market Growth, By End-User Environment, 2013 – 2019 (Y-O-Y %)
Table 13 Application Delivery Network (ADN): Application Security Equipment, Market Size, By Countries, 2013 – 2019 ($Million)
Table 14 U.S. ADN: Application Security Equipment, Market Growth, By Countries, 2013 – 2019 (Y-O-Y %)
Table 15 U.S. ADN: Application Security Equipment, Market Size, By Verticals, 2013 – 2019 ($Million)
Table 16 U.S. ADN: Application Security Equipment, Market Growth, By Verticals, 2013 – 2019 (Y-O-Y %)
Table 17 U.S. ADN: Application Security Equipment, Market Size, By End-User Environment, 2013 – 2019 ($Million)
Table 18 U.S. ADN: Application Security Equipment, Market Growth, By End-User Environment, 2013 – 2019 (Y-O-Y %)
Table 19 Application Delivery Network (ADN): Application Gateway, Market Size, By Countries, Market Size, 2013 – 2019 ($Million)
Table 20 Application Delivery Network (ADN): Application Gateway, Market Growth, By Countries, 2013 – 2019 (Y-O-Y %)
Table 21 U.S. ADN: Application Gateway, Market Size, By Verticals, 2013 – 2019 ($Million)
Table 22 U.S. ADN: Application Gateway, Market Growth, By Verticals, 2013 – 2019 (Y-O-Y %)
Table 23 U.S. ADN: Application Gateway, Market Size, By End-User Environment, 2013 – 2019 ($Million)
Table 24 U.S. ADN: Application Gateway, Market Growth, By End-User Environment, 2013 – 2019 (Y-O-Y %)
Table 25 U.S. ADN: Market Proportions, By End-User Environment, 2013 – 2019 (%)
Table 26 U.S. ADN: Market Size, By End-User Environment, 2013 – 2019 ($Million)
Table 27 U.S. ADN: Market Growth, By End-User Environment, 2013 – 2019 (Y-O-Y %)
Table 28 U.S. ADN: Cloud Service Provider, Market Size, By Countries, 2013 – 2019 ($Million)
Table 29 U.S. ADN: Cloud Service Provider, Market Growth, By Countries, 2013 – 2019 (Y-O-Y %)
Table 30 U.S. ADN: Telecommunications Service Providers, Market Size, By Countries, 2013 – 2019 ($Million)
Table 31 U.S. ADN: Telecommunications Service Providers, Market Growth, By Countries, 2013 – 2019 (Y-O-Y %)
Table 32 U.S. ADN: Enterprises, Market Size, By Countries, 2013 – 2019 ($Million)
Table 33 U.S. ADN: Enterprises, Market Growth, By Countries, 2013 – 2019 (Y-O-Y %)
Table 34 U.S. ADN: Smb, Market Size, By Countries, 2013 – 2019 ($Million)
Table 35 U.S. ADN: Smb, Market Growth, By Countries, 2013 – 2019 (Y-O-Y %)
Table 36 Application Delivery Network (ADN): Enterprises, Market Size, By Countries, 2013 – 2019 ($Million)
Table 37 U.S. ADN: Enterprises, Market Growth, By Countries, 2013 – 2019 (Y-O-Y %)
Table 38 Application Delivery Network (ADN): High-Tech, Market Size, By Products, 2013 – 2019 ($Million)
Table 39 U.S. ADN: High-Tech, Market Growth, By Products, 2013 – 2019 (Y-O-Y %)
Table 40 U.S. ADN: High-Tech, Market Size, By Countries, 2013 – 2019 ($Million)
Table 41 U.S. ADN: High-Tech, Market Growth, By Countries, 2013 – 2019 (Y-O-Y %)
Table 42 Application Delivery Network (ADN): Education, Market Size, By Products, 2013 – 2019 ($Million)
Table 43 U.S. ADN: Education, Market Growth, By Products, 2013 – 2019 (Y-O-Y %)
Table 44 U.S. ADN: Education, Market Size, By Countries, 2013 – 2019 ($Million)
Table 45 U.S. ADN: Education, Market Growth, By Countries, 2013 – 2019 (Y-O-Y %)
Table 46 Application Delivery Network (ADN): Media And Entertainment, Market Size, By Products, 2013 – 2019 ($Million)
Table 47 U.S. ADN: Media And Entertainment, Market Growth, By Products, 2013 – 2019 (Y-O-Y %)
Table 48 U.S. ADN: Media And Entertainment, Market Size, By Countries, 2013 – 2019 ($Million)
Table 49 U.S. ADN: Media And Entertainment, Market Growth, By Countries, 2013 – 2019 (Y-O-Y %)
Table 50 Application Delivery Network (ADN): BFSI, Market Size, By Products, 2013 – 2019 ($Million)
Table 51 U.S. ADN: BFSI, Market Growth, By Products, 2013 – 2019 (Y-O-Y %)
Table 52 U.S. ADN: BFSI, Market Size, By Countries, 2013 – 2019 ($Million)
Table 53 U.S. ADN: BFSI, Market Growth, By Countries, 2013 – 2019 (Y-O-Y %)
Table 54 Application Delivery Network (ADN): Government, Market Size, By Products, 2013 – 2019 ($Million)
Table 55 U.S. ADN: Government, Market Growth, By Products, 2013 – 2019 (Y-O-Y %)
Table 56 U.S. ADN: Government, Market Size, By Countries, 2013 – 2019 ($Million)
Table 57 U.S. ADN: Government, Market Growth, By Countries, 2013 – 2019 (Y-O-Y %)
Table 58 U.S. ADN: Retail, Market Size, By Products, 2013 – 2019 ($Million)
Table 59 Application Delivery Network (ADN): Government, Market Growth, By Products, 2013 – 2019 (Y-O-Y %)
Table 60 Application Delivery Network (ADN): Retail, Market Size, By Countries, 2013 – 2019 ($Million)
Table 61 Retail, Market Growth, By Countries, 2013 – 2019 (Y-O-Y %)
Table 62 Application Delivery Network (ADN): Others, Market Size, By Products, 2013 – 2019 ($Million)
Table 63 Others, Market Growth, By Products, 2013 – 2019 (Y-O-Y %)
Table 64 Others, Market Size, By Countries, 2013 – 2019 ($Million)
Table 65 Others, Market Growth, By Countries, 2013 – 2019 (Y-O-Y %)
Table 66 Brocade: Revenue, 2012 – 2013 ($Million)
Table 67 Brocade: Revenue, By Segments, 2012 – 2013 ($Million)
Table 68 Brocade: Revenue, By Countries, 2012 – 2013 ($Million)
Table 69 Cisco: Revenue, 2012 – 2013 ($Million)
Table 70 Cisco: Revenue, By Segments, 2013 – 2019 ($Million)
Table 71 Cisco: Revenue, By Countries, 2012 – 2013 ($Million)
Table 72 Citrix: Revenue, 2012 – 2013 ($Million)
Table 73 Citrix: Revenue, By Segment, 2012 – 2013 ($Million)
Table 74 Citrix: Revenue, By Geographies, 2012 – 2013 ($Million)
Table 75 Dell: Revenue, 2012 – 2013 ($Million)
Table 76 Dell: Revenue, By Segment, 2012 – 2013 ($Million)
Table 77 Dell: Revenue, By Geographies, 2012 – 2013 ($Million)
Table 78 F5 Networks: Revenue, 2012 – 2013 ($Million)
Table 79 F5 Networks: Revenue By Segment, 2012 – 2013 ($Million)
Table 80 HP: Revenue, 2012 – 2013 ($Million)
Table 81 HP: Revenue, By Segment, 2012 – 2013 ($Million)
Table 82 HP: Revenue, By Geographies, 2012 – 2013 ($Million)
Table 83 Juniper Networks: Revenue, 2012 – 2013 ($Million)
Table 84 Juniper Networks: Revenue, By Segment, 2012 – 2013 ($Million)
Table 85 Juniper Networks: Revenue, By Segment, 2013 – 2019 ($Million)
Table 86 Juniper Networks: Revenue, By Countries, 2013 – 2019 ($Million)
Table 87 Oracle: Revenue, 2012 – 2013 ($Million)
Table 88 Oracle: Revenue, By Segment, 2012 – 2013 ($Million)
Table 89 Oracle: Revenue, By Countries, 2012 – 2013 ($Million)
Table 90 Radware: Revenue, 2012 – 2013 ($Million)
Table 91 Radware: Revenue By Segment, 2012 – 2013 ($Million)
Table 92 Radware: Revenue By Countries, 2012 – 2013 ($Million)
Table 93 Riverbed: Revenue, 2012 – 2013 ($Million)
Table 94 Riverbed: Revenue By Segment, 2012 – 2013 ($Million)
Table 95 Verizon: Revenue, 2012 - 2013 ($Million)
Table 96 Verizon: Revenue By Segment, 2013 – 2019 ($Million)
List Of Figures
Figure 1 Research Methodology
Figure 2 Data Triangulation
Figure 3 Application Delivery Network (ADN): Segment Definition
Figure 4 ADN Features
Figure 5 Application Delivery Network (ADN): 2013 – 2019 (Y-O-Y %)
Figure 6 Application Delivery Network (ADN): Ecosystem
Figure 7 U.S. ADN: Market Players
Figure 8 Time-Impact Analysis
Figure 9 Application Delivery Network (ADN): By Products
Figure 10 Application Delivery Network (ADN): Market Growth, By Products, 2013 – 2019 (Y-O-Y %)
Figure 11 Application Delivery Network (ADN): Controllers, Market Growth, 2013 – 2019 (Y-O-Y %)
Figure 12 U.S. ADN: Controllers, Market Growth, By Countries, 2013 – 2019 (Y-O-Y %)
Figure 13 U.S. ADN: Controllers, Market Growth, By Verticals, 2013 – 2019 (Y-O-Y %)
Figure 14 U.S. ADN: Controllers, Market Growth, By End-User Environment, 2013 – 2019 (Y-O-Y %)
Figure 15 U.S. ADN: Application Security Equipment, Market Growth, By Countries, 2013 – 2019 (Y-O-Y %)
Figure 16 U.S. ADN: Application Security Equipment, Market Growth, By Verticals, 2013 – 2019 (Y-O-Y %)
Figure 17 U.S. ADN: Application Security Equipment, Market Growth, By End-User Environment, 2013 – 2019 (Y-O-Y %)
Figure 18 U.S. ADN: Application Gateway, By Countries, 2013 – 2019 (Y-O-Y %)
Figure 19 U.S. ADN: Application Gateway, Market Growth, By Verticals, 2013 – 2019 (Y-O-Y %)
Figure 20 U.S. ADN: Application Gateway, Market Growth, By End-User Environment, 2013 – 2019 (Y-O-Y %)
Figure 21 U.S. ADN: Market Growth, By End-User Environment, 2013 – 2019 (Y-O-Y %)
Figure 22 U.S. ADN: Cloud Service Provider, Market Growth, By Countries, 2013 – 2019 (Y-O-Y %)
Figure 23 U.S. ADN: Telecommunications Service Providers, Market Growth, By Countries, 2013 – 2019 (Y-O-Y %)
Figure 24 U.S. ADN: Enterprises, Market Growth, By Countries, 2013 – 2019 (Y-O-Y %)
Figure 25 U.S. ADN: Smb, Market Growth, By Countries, 2013 – 2019 (Y-O-Y %)
Figure 26 U.S. ADN: Enterprises, Market Growth, By Countries, 2013 – 2019 (Y-O-Y %)
Figure 27 U.S. ADN: High-Tech, Market Growth, By Products, 2013 – 2019 (Y-O-Y %)
Figure 28 U.S. ADN: High-Tech, Market Growth, By Countries, 2013 – 2019 (Y-O-Y %)
Figure 29 U.S. ADN: Education, Market Growth, By Products, 2013 – 2019 (Y-O-Y %)
Figure 30 U.S. ADN: Education, Market Growth, By Countries, 2013 – 2019 (Y-O-Y %)
Figure 31 U.S. ADN: Media And Entertainment, Market Growth, By Products, 2013 – 2019 (Y-O-Y %)
Figure 32 U.S. ADN: Media And Entertainment, Market Growth, By Countries, 2013 – 2019 (Y-O-Y %)
Figure 33 U.S. ADN: BFSI, Market Growth, By Products, 2013 – 2019 (Y-O-Y %)
Figure 34 U.S. ADN: BFSI, Market Growth, By Countries, 2013 – 2019 (Y-O-Y %)
Figure 35 U.S. ADN: Government, Market Growth, By Products, 2013 – 2019 (Y-O-Y %)
Figure 36 U.S. ADN: Government, Market Growth, By Countries, 2013 – 2019 (Y-O-Y %)
Figure 37 U.S. ADN: Retail, Market Growth, By Products, 2013 – 2019 (Y-O-Y %)
Figure 38 U.S. ADN: Retail, By Countries, 2013 – 2019 (Y-O-Y %)
Figure 39 U.S. ADN: Others, Market Growth, By Products, 2013 – 2019 (Y-O-Y %)
Figure 40 U.S. ADN: Others, Market Growth, By Countries, 2013 – 2019 (Y-O-Y %)
Figure 41 Parfait Charts
Figure 42 Market Evolution
Figure 43 U.S. ADN: Market Disruption
Figure 44 U.S. ADN: Lifecycle And Chasm Plot
Figure 45 U.S. ADN: GTM Strategy
Figure 46 U.S. ADN: Adoption Roadmap
Figure 47 U.S. ADN: Vertical Opportunity Plots
Figure 48 Portfolio Comparison
Figure 49 Application Delivery Network (ADN): Social Reach
Please fill in the form below to receive a free copy of the Summary of this Report
Please visit https://www.micromarketmonitor.com/custom-research-services.html to specify your custom Research Requirement


