

Southeast Asia & Australia Bio-stimulants Market By Type (Humic Acids, Fulvic Acids, Seaweed, Microbials, Trace Minerals, Vitamins & Amino Acids), By Application Method, By Crop Type & By Region - Trends & Forecasts To 2021
- Publish Date: Aug 2016
- Number of Pages: 187


The Southeast Asian & Australian biostimulants market is projected to reach USD 451.8 million by 2021, at a CAGR of 11.3% from 2016 to 2021. In terms of area of application, the biostimulants market is projected to reach 5.2 million hectares by 2021, and is projected to grow at a CAGR of 12.0% from 2016 to 2021.
The objectives of the study are as follows:
- To define, segment, and project the Southeast Asia & Australia market size of biostimulants on the basis of active ingredients, application mode, crop type, and country
- To project the size of the market, in terms of value (USD million) and area (thousand hectares)
- To provide detailed information regarding the crucial factors influencing the growth of the market (drivers, restraints, opportunities, and industry-specific challenges)
The years considered for the study are as follows:
- Base year – 2015
- Estimated year – 2016
- Projected year – 2021
- Forecast period – 2016 to 2021
The research methodology used to estimate and forecast the biostimulants market begins with capturing data on key players, their revenues, and supplier prices on different trading platforms through secondary research. The bottom-up procedure was employed to arrive at the overall market size of the global market after analyzing the regional demand. After arriving at the overall market size, the total market was used along with secondary research in the top-down procedure to estimate the sizes of other individual segments and subsegments, which are then verified through primary research by conducting extensive interviews with key people such as CEOs, VPs, directors, and executives. This data triangulation and market breakdown procedures were employed to complete the overall market engineering process and arrive at the exact statistics for all segments and subsegments.
BREAKDOWN OF PRIMARY INTERVIEWS

*Others includes sales managers, marketing managers, and product managers.
“To know about assumptions considered for this research report, download pdf brochure.”
The report studies about the interlinked supply chain operations between the upstream and downstream players. It has also covered the growing importance of players involved in raw material supply such as seaweed extractors, vitamin and amino acid suppliers, and humic acid manufacturers in Southeast Asia and Australia such as Leili Group (China) and Biostadt India Limited (India). The downstream players include agrochemical manufacturers, biotechnological companies, and biostimulant and specialty fertilizer manufacturers, such as Omnia Holdings Limited (South Africa), Tradecorp International (Spain, Sapec Group), Valagro SpA (Italy), Brandt Consolidated, Inc. (U.S.), Platform Specialty Products Company (U.S.), and Biolchim SpA (Italy).
Target Audience:
The report targeted towards the existing players in the industry is as follows:
- Biostimulant & fertilizer manufacturers
- Seaweed harvesters and processors
- Humic acids and seaweed traders/distributors/suppliers
- Organic certification agencies and biostimulant importers/exporters
- Biostimulant manufacturer associations and industry bodies
“The study answers several questions for stakeholders, primarily which market segments to focus on in the next two to five years for prioritizing efforts and investments.”
SCOPE OF THE REPORT
On the basis of active ingredients, the biostimulants market have been segmented as follows:
- Humic acid
- Fulvic acid
- Seaweed extracts
- Microbial amendments
- Trace minerals
- Vitamins & amino acids
- Other ingredients & additives (polysaccharides, enzymes, soil conditioners, wetting agents, and antioxidants)
On the basis of application mode, the biostimulants market have been segmented as follows:
- Foliar
- Soil
- Seed
On the basis of crop type, the biostimulants market have been segmented as follows:
- Row crops (cereals, oilseeds, and pulses)
- Fruits & vegetables
- Turfs & ornamentals
- Other crops (fiber crops, plantation crops, hydroponics, and forage grasses)
On the basis of region, the biostimulants market have been segmented as follows:
- Southeast Asia
- Australia
AVAILABLE CUSTOMIZATIONS
With the given market data, MicroMarketMonitor offers customizations according to the client-specific needs.
The following customization options are available for the report:
Product Analysis
- Product matrix, which gives a detailed comparison of the product portfolio of each company
Regional Analysis
- Further breakdown of Europe biostimulants market into Sweden, Norway, Denmark, and the Netherlands
- Further breakdown of Asia-Pacific biostimulants market into Vietnam, Thailand, Philippines, and New Zealand
- Further breakdown of Latin American biostimulants market into Uruguay, Chile, and Colombia
- Further breakdown of the biostimulants market of other countries in RoW into Morocco, Ghana, and Egypt
Company Information
- Detailed analysis and profiling of additional market players (up to five)
Table of Contents:
1 Introduction
1.1 Objectives Of The Study
1.2 Market Definition
1.3 Scope Of The Study
1.3.1 Markets Covered
1.4 Periodization Considered
1.5 Unit Considered
1.6 Currency
1.7 Stakeholders
2 Research Methodology
2.1 Research Data
2.1.1 Secondary Research
2.1.1.1 Key Data From Secondary Sources
2.1.2 Primary Data
2.1.2.1 Key Data From Primary Sources
2.1.2.2 Key Industry Insights
2.1.2.3 Breakdown Of Primary Interviews
2.2 Factor Analysis
2.2.1 Introduction
2.2.2 Demand-Side Analysis
2.2.2.1 Decreasing Area Under Agricultural Cultivation
2.2.2.2 Increasing Growth In Fruit & Vegetable Production
2.2.3 Supply-Side Analysis
2.2.3.1 Growing Environmental & Regulatory Concerns
2.2.3.2 Efficient Sourcing Due To Strong Supply Of Seaweeds At Lower Costs
2.3 Market Size Estimation
2.3.1 Bottom-Up Approach
2.3.2 Top-Down Approach
2.4 Market Breakdown & Data Triangulation
2.5 Research Assumptions & Limitations
2.5.1 Assumptions
2.5.2 Limitations
3 Executive Summary
4 Premium Insights
4.1 Extensive Opportunities In Southeast Asia & Australia For Biostimulants
4.2 Biostimulants Market, Key Type Segments (USD Million)
4.3 Southeast Asia: Emerging Market For Biostimulants
4.4 Biostimulants Market, By Country
4.5 Life Cycle Analysis, By Region
5 Market Overview
5.1 Introduction
5.2 Evolution
5.3 Market Segmentation
5.3.1 By Type
5.3.2 By Crop Type
5.3.3 By Mode Of Application
5.4 Market Dynamics
5.4.1 Drivers
5.4.1.1 Need For Sustainable Way To Improve Crop Yield And Quality
5.4.1.1.1 Enhancing Stress Response In Crops During Harsh Conditions
5.4.1.1.2 Restoring And Enriching Degraded Soils
5.4.1.2 Easier Raw Material Availability And Limited Investments
5.4.2 Restraints
5.4.2.1 Lack Of Awareness Among Farmers
5.4.3 Opportunities
5.4.3.1 Strengthening Product Portfolios For Broad-Acre Crops
5.4.3.2 Demand For Cost-Effective Portfolios In Developing Countries
5.4.4 Challenges
5.4.4.1 Unclear Legislatory Standardization Of Biostimulants
5.4.4.2 Increasing Number Of Players With Similar Formulations
6 Industry Trends
6.1 Introduction
6.2 Value Chain Analysis
6.3 Supply Chain Analysis
6.3.1 Fertilizer & Insecticide Manufacturers
6.3.2 Government Regulatory Authorities
6.3.3 End Users
6.3.4 Key Influencers
6.4 Industry Insights
6.5 Porter’s Five Forces Analysis
6.5.1 Intensity Of Competitive Rivalry
6.5.2 Threat Of New Entrants
6.5.3 Threat Of Substitutes
6.5.4 Bargaining Power Of Suppliers
6.5.5 Bargaining Power Of Buyers
6.6 Regulatory Framework
6.6.1 Australia
6.6.1.1 Standards Australia
6.6.1.2 Department Of Agriculture And Water Resources
6.6.2 Indonesia
6.6.3 New Zealand
7 Southeast Asian & Australian Biostimulants Market, By Type
7.1 Introduction
7.2 Humic Acid
7.3 Fulvic Acid
7.4 Seaweed Extracts
7.5 Microbial Amendments
7.6 Trace Minerals
7.7 Vitamins & Amino Acids
7.8 Other Ingredients & Additives
8 Southeast Asian & Australian Biostimulants Market, By Crop Type
8.1 Introduction
8.2 Row Crops
8.3 Fruits & Vegetables
8.4 Turf & Ornamentals
8.5 Other Crop Types
9 Southeast Asian & Australasian Biostimulants Market, By Mode Of Application
9.1 Introduction
9.2 Foliar Treatment
9.3 Soil Treatment
9.4 Seed Treatment
10 Southeast Asian & Australian Biostimulants Market, By Region
10.1 Introduction
10.2 Southeast Asia
10.2.1 Indonesia
10.2.2 Philippines
10.2.3 Thailand
10.2.4 Vietnam
10.2.5 Malaysia
10.2.6 Rest Of Southeast Asia
10.3 Australasia
10.3.1 Australia
10.3.2 New Zealand
10.3.3 Rest Of Australasia
11 Competitive Landscape
11.1 Overview
11.2 Market Scenario & Trends
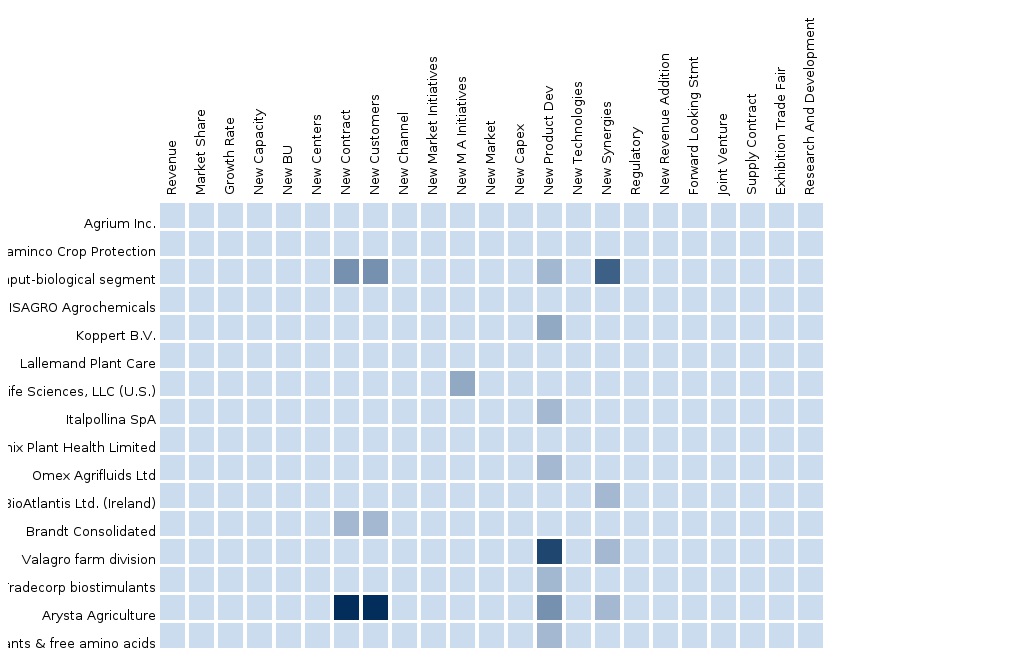
11.3 Competitive Situation & Trends
11.4 New Product Launches
11.5 Expansions & Investments
11.6 Agreements, Collaborations & Partnerships
11.7 Acquisitions
12 Company Profiles
(Overview, Financials, Products & Services, Strategy, And Developments)*
12.1 Introduction
12.2 Sapec Group (Trade Corporation International)
12.3 Platform Specialty Products Company
12.4 Brandt Consolidated, Inc.
12.5 Leili Group
12.6 Biostadt India Limited
12.7 Valagro Spa
12.8 Novozymes A/S
12.9 Isagro Spa
12.1 Omnia Holdings Limited
12.11 Biolchim S.P.A
*Details On Overview, Financials, Product & Services, Strategy, And Developments Might Not Be Captured In Case Of Unlisted Company
13 Appendix
13.1 Insights Of Industry Experts
13.2 Discussion Guide
13.3 Introducing Rt: Real-Time Market Intelligence
13.4 Available Customizations
List of Tables:
Table 1 Southeast Asia & Australia Biostimulants Market, By Type, 2014-2021 (Usd Million)
Table 2 Relative Amount Of Humic And Fulvic Acids In Various Organic Substances
Table 3 Humic Acid: Biostimulants Market, By Sub-Type, 2014 - 2021 (Usd Million)
Table 4 Fulvic Acid: Biostimulants Market, By Region, 2014-2021 (Usd Million)
Table 5 Seaweed Extracts: Biostimulants Market, By Region, 2014-2021 (Usd Million)
Table 6 Microbial Amendments: Biostimulants Market, By Region, 2014-2021 (Usd Million)
Table 7 Trace Minerals: Biostimulants Market, By Region, 2014-2021 (Usd Million)
Table 8 Vitamins & Amino Acids: Biostimulants Market, By Region, 2014-2021 (Usd Million)
Table 9 Other Ingredients & Additives: Biostimulants Market, By Region, 2014-2021 (Usd Million)
Table 10 Southeast Asia & Australia: Biostimulants Market, By Crop Type, 2014-2021 (Usd Million)
Table 11 Southeast Asia & Australia: Biostimulants Market, By Crop Type, 2014-2021 (Thousand Hectares)
Table 12 Row Crops: Biostimulants Market, By Region, 2014-2021 (Usd Million)
Table 13 Row Crops: Biostimulants Market, By Region, 2014-2021 (Thousand Hectares)
Table 14 Fruits & Vegetables: Biostimulants Market, By Region, 2014-2021 (Usd Million)
Table 15 Fruits & Vegetables: Biostimulants Market, By Region, 2014-2021 (Thousand Hectares)
Table 16 Turf & Ornamentals: Biostimulants Market, By Region, 2014-2021 (Usd Million)
Table 17 Turf & Ornamentals: Biostimulants Market, By Region, 2014-2021 (Thousand Hectares)
Table 18 Other Crops: Biostimulants Market, By Region, 2014-2021 (Usd Million)
Table 19 Other Crops: Biostimulants Market, By Region, 2014-2021 (Thousand Hectares)
Table 20 Southeast Asia & Australia: Biostimulants Market Size, By Mode Of Application, 2014-2021 (Usd Million)
Table 21 Southeast Asia & Australia: Biostimulants Market Size, By Mode Of Application, 2014-2021 (Thousand Hectares)
Table 22 Foliar Treatment: Biostimulants Market Size, By Region, 2014-2021 (Usd Million)
Table 23 Foliar Treatment: Biostimulants Market Size, By Region, 2014-2021 (Thousand Hectares)
Table 24 Soil Treatment: Biostimulants Market Size, By Region, 2014-2021 (Usd Million)
Table 25 Soil Treatment: Biostimulants Market Size, By Region, 2014-2021 (Thousand Hectares)
Table 26 Seed Treatment: Biostimulants Market Size, By Region, 2014-2021 (Usd Million)
Table 27 Seed Treatment: Biostimulants Market Size, By Region, 2014-2021 (Thousand Hectares)
Table 28 Southeast Asian & Australia Biostimulants Market Size, By Region, 2014-2021 (Usd Million)
Table 29 Southeast Asian & Australia Biostimulants Market Size, By Region, 2014-2021 (Thousand Hectares)
Table 30 Southeast Asia: Biostimulants Market Size, By Country, 2014-2021 (Usd Million)
Table 31 Southeast Asia: Biostimulants Market Size, By Country, 2014-2021 (Thousand Hectares)
Table 32 Southeast Asia: Biostimulants Market Size, By Type, 2014-2021 (Usd Million)
Table 33 Southeast Asia: Biostimulants Market Size, By Crop Type, 2014-2021 (Usd Million)
Table 34 Southeast Asia: Biostimulants Market Size, By Crop Type, 2014-2021 (Thousand Hectares)
Table 35 Indonesia: Biostimulants Market Size, By Type, 2014-2021 (Usd Million)
Table 36 Indonesia: Biostimulants Market Size, By Crop Type, 2014-2021 (Usd Million)
Table 37 Indonesia: Biostimulants Market Size, By Crop Type, 2014-2021 (Thousand Hectares)
Table 38 Philippines: Biostimulants Market Size, By Type, 2014-2021 (Usd Million)
Table 39 Philippines: Biostimulants Market Size, By Crop Type, 2014-2021 (Usd Million)
Table 40 Philippines: Biostimulants Market Size, By Crop Type, 2014-2021 (Thousand Hectares)
Table 41 Thailand: Biostimulants Market Size, By Type, 2014-2021 (Usd Million)
Table 42 Thailand: Biostimulants Market Size, By Crop Type, 2014-2021 (Usd Million)
Table 43 Thailand: Biostimulants Market Size, By Crop Type, 2014-2021 (Thousand Hectares)
Table 44 Vietnam: Biostimulants Market Size, By Type, 2014-2021 (Usd Million)
Table 45 Vietnam: Biostimulants Market Size, By Crop Type, 2014-2021 (Usd Million)
Table 46 Vietnam: Biostimulants Market Size, By Crop Type, 2014-2021 (Thousand Hectares)
Table 47 Malaysia: Biostimulants Market Size, By Type, 2014-2021 (Usd Million)
Table 48 Malaysia: Biostimulants Market Size, By Crop Type, 2014-2021 (Usd Million)
Table 49 Malaysia: Biostimulants Market Size, By Crop Type, 2014-2021 (Thousand Hectares)
Table 50 Rest Of Southeast Asia: Biostimulants Market Size, By Type, 2014-2021 (Usd Million)
Table 51 Rest Of Southeast Asia: Biostimulants Market Size, By Crop Type, 2014-2021 (Usd Million)
Table 52 Rest Of Southeast Asia: Biostimulants Market Size, By Crop Type, 2014-2021 (Thousand Hectares)
Table 53 Australia: Biostimulants Market Size, By Country, 2014-2021 (Usd Million)
Table 54 Australia: Biostimulants Market Size, By Country, 2014-2021 (Thousand Hectares)
Table 55 Australia: Biostimulants Market Size, By Type, 2014-2021 (Usd Million)
Table 56 Australia: Biostimulants Market Size, By Crop Type, 2014-2021 (Usd Million)
Table 57 Australia: Biostimulants Market Size, By Crop Type, 2014-2021 (Thousand Hectares)
Table 58 Australia: Biostimulants Market Size, By Type, 2014-2021 (Usd Million)
Table 59 Australia: Biostimulants Market Size, By Crop Type, 2014-2021 (Usd Million)
Table 60 Australia: Biostimulants Market Size, By Crop Type, 2014-2021 (Thousand Hectares)
Table 61 New Zealand: Biostimulants Market Size, By Type, 2014-2021 (Usd Million)
Table 62 New Zealand: Biostimulants Market Size, By Crop Type, 2014-2021 (Usd Million)
Table 63 New Zealand: Biostimulants Market Size, By Crop Type, 2014-2021 (Thousand Hectares)
Table 64 Rest Of Australia: Biostimulants Market Size, By Type, 2014-2021 (Usd Million)
Table 65 Rest Of Australia: Biostimulants Market Size, By Crop Type, 2014-2021 (Usd Million)
Table 66 Rest Of Australia: Biostimulants Market Size, By Crop Type, 2014-2021 (Thousand Hectares)
Table 67 New Product Launches, 2011–2016
Table 68 Expansions & Investments, 2015–2016
Table 69 Agreements, Collaborations & Partnerships, 2014–2016
Table 70 Acquisitions, 2014–2016
List of Figures:
Figure 1 Southeast Asian & Australian Biostimulants Market Segmentation
Figure 2 Research Design: Southeast Asian & Australia Biostimulants Market
Figure 3 Breakdown Of Primary Interviews: By Company Type, Designation & Region
Figure 4 Asia: Area Under Agricultural Practice, 2010–2013 (Million Hectares)
Figure 5 Southeast Asia & Australia: Arable Land & Permanent Croplands Share, By Country, 2013 (Million Hectares)
Figure 6 Southeast Asia: Area Harvested Under Fruits, Vegetables & Other High-Value Crops, 2010–2013 (Million Hectares)
Figure 7 Southeast Asia: Fruits, Vegetables & Other High-Value Crop Production, 2010-2013 (Million Tons)
Figure 8 Key Global Producers Of Seaweeds, 2000–2012 (‘000 Tons)
Figure 9 Market Size Estimation Methodology: Bottom-Up Approach
Figure 10 Market Size Estimation Methodology: Top-Down Approach
Figure 11 Data Triangulation
Figure 12 Assumptions Of The Study
Figure 13 Biostimulants Market Snapshot, 2016 Vs. 2021: Seaweed Extracts & Microbial Amendments Poised For Strong Growth (USD Million)
Figure 14 Broad-Acre Crops And Plantation Crops: Most Attractive Growth Segments, 2016-2021 (Thousand Hectares)
Figure 15 Strong Growth Trend Observed In Southeast Asia, 2016–2021 (USD Million)
Figure 16 A Prospective Market With Robust Growth Potential, 2016-2021 (USD Million)
Figure 17 Southeast Asian & Australia Biostimulants Market, By Type, 2016-2021 (USD Million)
Figure 18 Innovative & Sustainable Practices Influence Product Enhancements For Row Crops, 2015
Figure 19 Country-Level Shares Highlight The Fragmented & Nascent Stage Of The Market, 2015 (USD Million)
Figure 20 Asia-Pacific Approaching The Growth Phase With A Promising Future, 2016
Figure 21 Development Of Biostimulants
Figure 22 Southeast Asian & Australian Biostimulants Market Segmentation, By Type
Figure 23 Southeast Asian & Australia Biostimulants Market, By Crop Type
Figure 24 Southeast Asian & Australia Biostimulants Market, By Mode Of Application
Figure 25 Promising Results And Organic & Sustainable Practices Driving Market Demand
Figure 26 Southeast Asia: Cultivated Area Under Cereals & Oilseeds And Plantation Crops, 2011-2013 (Million Ha)
Figure 27 Crop Harvested Area In Indonesia & Thailand, 2011-2013 (Million Ha)
Figure 28 Manufacturing Process: Main Phase Of Value Addition 63
Figure 29 Raw Material Accessibility & Efficient Marketing Channels: Critical Checkpoints
Figure 30 Diligent Efforts On Product Innovation & Distribution Network: Key Areas For Growth
Figure 31 Development Of Business Units & Distribution Networks Highlights The Competitive Intensity
Figure 32 Se Asia & Australia: Biostimulants Market Size, By Type, 2016 Vs. 2021 (USD Million)
Figure 33 Humic Acid Market Size, By Region, 2016 Vs. 2021 (USD Million)
Figure 34 Fulvic Acid Market Size, By Region, 2016 Vs. 2021 (USD Million)
Figure 35 Major Seaweed Producers In 2013
Figure 36 Seaweed Extracts Market Size, By Region, 2016 Vs. 2021 (USD Million)
Figure 37 Southeast Asia & Australia: Biostimulants Market Size, By Crop Type, 2016 Vs. 2021 (USD Million)
Figure 38 Row Crops: Biostimulants Market, By Region, 2016-2021 (USD Million)
Figure 39 Fruits & Vegetables: Biostimulants Market, By Region, 2014-2021 (USD Million)
Figure 40 Turf & Ornamentals: Biostimulants Market, By Region, 2014-2021 (USD Million)
Figure 41 Other Crops: Biostimulants Market, By Region, 2016-2021 (USD Million)
Figure 42 Southeast Asia & Australia: Biostimulants Market Size, By Mode Of Application, 2016 Vs. 2021 (USD Million)
Figure 43 Foliar Treatment: Biostimulants Market Size, By Region, 2016 Vs. 2021 (USD Million)
Figure 44 Soil Treatment: Biostimulants Market Size, By Region, 2016 Vs. 2021 (USD Million)
Figure 45 Seed Treatment: Biostimulants Market Size, By Region, 2016 Vs. 2021 (USD Million)
Figure 46 Southeast Asian Market Snapshot: Modern Agricultural Practices & Sustainable Farming Drive The Market Growth, 2015
Figure 47 Australian Biostimulants Market: A Snapshot
Figure 48 Acquisitions: Leading Approach Of Key Companies, 2011-2016
Figure 49 Sapec Group: Company Snapshot
Figure 50 Sapec Group: Swot Analysis
Figure 51 Platform Specialty Products Company: Company Snapshot
Figure 52 Platform Specialty Products Company: Swot Analysis
Figure 53 Brandt Consolidated, Inc.: Swot Analysis
Figure 54 Leili Group: Swot Analysis
Figure 55 Biostadt India Limited: Swot Analysis
Figure 56 Novozymes A/S: Company Snapshot
Figure 57 Isagro Spa: Company Snapshot
Figure 58 Omnia Holdings Limited: Company Snapshot
The biostimulants market is projected to grow at a CAGR of 10.4% from 2016 to 2021 and reach a projected value of USD 2.91 billion by 2021. In terms of area of application, the biostimulants market is projected to grow at a CAGR of 11.7% from 2016 to 2021, to reach USD 24.9 million hectares by 2021. Factors such as raw material availability and widening applications in row crops such as cereals & oilseeds for their efficient stress response mechanism are projected to drive the biostimulants market.
The biostimulant products are gaining popularity for their fastest-growing innovative ingredient segments such as seaweed extracts and microbial amendments, owing to the need for adopting sustainable practices effectively with limited resources (land, water, and nutrients).
In the biostimulants market, row crops are projected to gain a strong growth, in terms of value and area, in the next five years with respect to strengthening the crop production during adverse stress conditions such as drought and intense heat.
Europe accounted for the largest market share in 2015, whereas the Asia-Pacific region is the fastest-growing market from 2016 to 2021 with respect to biostimulants. Growth in the Asia-Pacific region has been attributed to the strong demand to improve crop productivity of cereals & oilseeds within the concept of good agricultural practices.
BIOSTIMULANTS MARKET SIZE, BY REGION, 2016 VS. 2021 (USD MILLION)

Source: MicroMarketMonitor Analysis
Raw materials such as humic substances, organic waste matter, and vermicompost are utilized by farmers from their own farm resources, without complete awareness of their function as sources of biostimulants such as humic acids and fulvic acids. The popularity of biostimulant products depends on the understanding of its constituents and benefits, among the farmers. Companies, being aware of the effectiveness of these specific acids, extract them and provide them as ready-to-use end products to the market, sometimes formulated along with microbials and amino acids. The information gap caused by misplaced marketing about the concept of biostimulants serves as a challenge towards the growth of the biostimulants market.
The key players have been exploring the market in new regions by adopting strategies such as new product launches, and expansions & investments in the last five years. On the backdrop, acquisitions of seaweed manufacturers and extractors for their technologies also take place in a subtle manner.
According to M&M, Biolchim SpA (Italy), Valagro SpA (Italy), and Italpollina SpA (Italy) are important players involved in raw material supply of seaweed extracts as well as in its formulations for biostimulant products. Well-established back-end and front-end operations of these companies, impressive product portfolio launches, and acquisition of seaweed processors are projected to further stabilize the position in the European as well as the overseas market.
“To speak to our analyst for a discussion on the above findings, please fill up the required details by clicking on the Speak to Analyst tab.”
Please visit https://www.micromarketmonitor.com/custom-research-services.html to specify your custom Research Requirement
| PRODUCT TITLE | PUBLISHED | |
|---|---|---|
|
|
Europe Agriculture Biologicals Market Biologicals-Europe and Agriculture Biopesticides Market, Bio... |
Upcoming |
|
|
Asia-Pacific Agriculture Biologicals Market Biologicals-Asia and Agriculture Biopesticides Market, Bio... |
Upcoming |
|
|
Latin America Agriculture Biologicals Market Biologicals-Latin America and Agriculture Biopesticides Market, Bio... |
Apr 2015 |
|
|
North America Agriculture Biologicals Market The North America agriculture biologicals market was valued at $1,409.07 million in 2014 and is projected to reach $2,758.24 million by 2019 at a CAGR of 14.4% during the forecast period. The market, by application is led by cereals and grains in 2014. In North America, U.S. has the largest share in the agriculture biologicals market. It constitutes of 72.47% of North America agriculture biologicals market. The biopesticides are mostly consumed in North America than other biological types. |
May 2015 |


