

Australia Micronutrient Fertilizers Market, By Crop Type [Cereals & Oilseeds, Fruits & Vegetables, Rest (Crops)], By Type [Zinc, Copper, Iron, Manganese, Boron, Molybdenum, Calcium, Others], By Form, By Application Mode, & By Geography, Trends and Forecast to 2019
- Publish Date: Jul 2015


The Australian micronutrient fertilizers market is estimated to grow at a CAGR of 7.5% from 2014 to 2019. Micronutrient deficiency in soil has emerged as one of the major constraints to crop productivity. While zinc, iron, boron, and manganese deficient areas are vast, copper and molybdenum deficiency has also been observed in many regions of Australia. The problem has emerged due to the increasing demand for food, which increases the demand for crops, and thus, agriculture production. This results in extensive use of soil, which makes the soil deficient in various micronutrients.
Micronutrient fertilizers are used to achieve better results by increasing the productivity of soil and fulfilling the deficiency of different micronutrients in soil. The major micronutrients that are essential for the normal growth and development of crops are zinc, copper, iron, manganese, boron, calcium, and molybdenum. Several other micronutrients, such as chlorine, nickel, and cobalt are also needed, but in very minute quantities.
The Australian micronutrient fertilizers market is dominated by New South Wales, followed by South Australia and Victoria. New South Wales is an economically important state in Australia. This area is involved in large scale production of wine grapes, which needs good supply of micronutrients from soil. This has increased the demand for micronutrient fertilizers in New South Wales. While the South Australian agriculture sector is flourishing, the soil in the region suffers from major micronutrient deficiency adding to the demand of micronutrient fertilizers. Queensland and Victoria are the other major shareholders in the agriculture sector of the Australian micronutrient fertilizers market. They contribute largely in the cereals, oilseeds, and fruits application segments of the market.
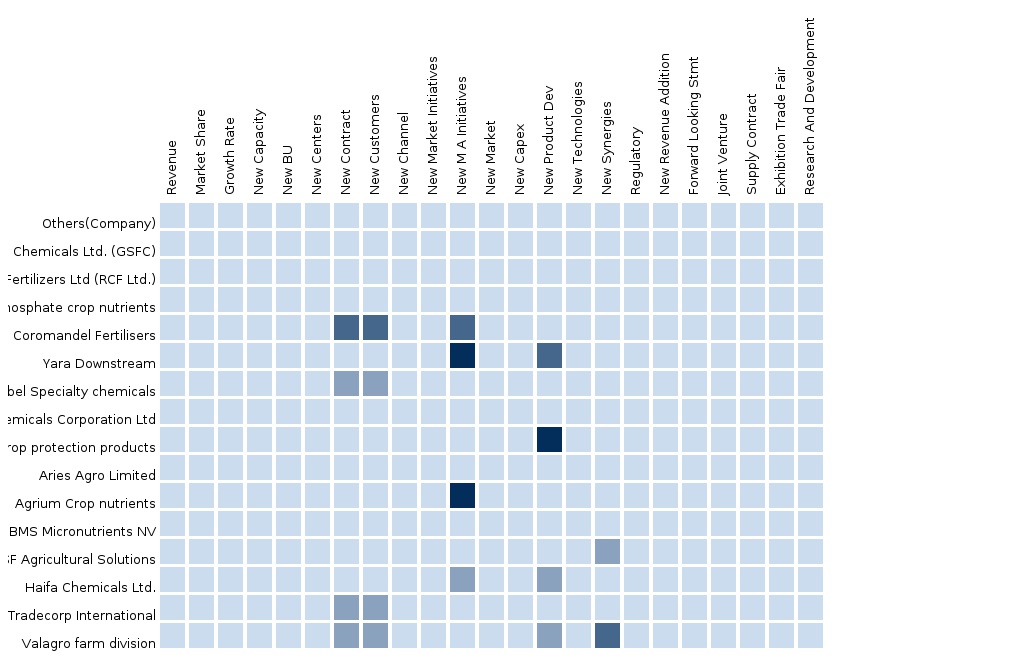
The Australian micronutrient fertilizers market is a competitive market, with firms such as Yara International (Norway), The Mosaic Company (U.S.), AkzoNobel N.V. (Netherlands), BASF SE (Germany), Cheminova A/S (Denmark), Agrium Inc. (Canada), Incitec Pivot Fertilizers Ltd. (Australia), and Haifa (Israel) active in the market. And to gain the market shares, these companies adopt numerous market strategies that include innovative product development, partnerships, mergers & acquisitions, and expansion of existing facilities. Apart from these companies, there are various other local firms present in the Australian micronutrient fertilizers market.
Scope of the Report
This research report categorizes the Australia micronutrient fertilizers market into the following segments and sub segments:
Australia Micronutrient Fertilizers Market, by Crop Type
- Cereals & Oilseeds
- Fruits & Vegetables
- Rest (Crops)
Australia Micronutrient Fertilizers Market, by Type
- Zinc
- Molybdenum
- Copper
- Manganese
- Boron
- Iron
- Calcium
- Others
Australia Micronutrient Fertilizers Market, by Form
- Non-Chelated
- Chelated
Australia Micronutrient Fertilizers Market, by Application Mode
- Soil
- Fertigation
- Foliar
- Others
Australia Micronutrient Fertilizers Market, by Geography
- New South Wales
- South Australia
- Victoria
- Queensland
- Western Australia
- Rest of Australia
Table Of Contents
1 Introduction (Page No. - 12)
1.1 Objectives Of The Study
1.2 Market Definition And Scope Of The Study
1.3 Segmentation & Coverage
1.4 Stakeholders
1.5 Assumptions
1.6 Limitations
1.7 Declaration
2 Research Methodology (Page No. - 18)
2.1 Integrated Ecosystem Of Micronutrient Fertilizers Market
2.2 Arriving At The Micronutrient Fertilizers Market Size
2.2.1 Top-Down Approach
2.2.2 Bottom-Up Approach
2.2.3 Macroindicator-Based Approach
3 Executive Summary (Page No. - 25)
4 Market Overview (Page No. - 27)
4.1 Introduction
4.2 Key Market Dynamics
4.3 Market Drivers And Inhibitors
5 Australia Micronutrient Fertilizers Market, By Crop Type (Page No. - 38)
5.1 Introduction
5.2 Australia Micronutrient Fertilizers Market In Cereals & Oilseeds, By Geography
5.3 Australia Micronutrient Fertilizers Market In Fruits & Vegetables, By Geography
5.4 Australia Micronutrient Fertilizers Market In Rest (Crops), By Geography
6 Australia Micronutrient Fertilizers Market, By Type (Page No. - 50)
6.1 Introduction
6.2 Australia Zinc (Micronutrient Fertilizers) Market, By Geography
6.3 Australia Copper (Micronutrient Fertilizers) Market, By Geography
6.4 Australia Iron (Micronutrient Fertilizers) Market, By Geography
6.5 Australia Manganese (Micronutrient Fertilizers) Market, By Geography
6.6 Australia Boron (Micronutrient Fertilizers) Market, By Geography
6.7 Australia Molybdenum (Micronutrient Fertilizers) Market, By Geography
6.8 Australia Calcium (Micronutrient Fertilizers) Market, By Geography
7 Australia Micronutrient Fertilizers Market, By Form (Page No. - 73)
7.1 Introduction
7.2 Australia Chelated Micronutrient Fertilizers Market, By Geography
7.3 Australia Non-Chelated Micronutrient Fertilizers Market, By Geography
8 Australia Micronutrient Fertilizers Market, By Application Mode (Page No. - 83)
8.1 Introduction
8.2 Australia Micronutrient Fertilizers Market In Soil Application, By Geography
8.3 Australia Micronutrient Fertilizers Market In Foliar Application, By Geography
8.4 Australia Micronutrient Fertilizers Market In Fertigation, By Geography
9 Australia Micronutrient Fertilizers Market, By Geography (Page No. - 96)
9.1 Introduction
9.2 Western Australia Micronutrient Fertilizers Market
9.2.1 Western Australia Micronutrient Fertilizers Market, By Crop Type
9.2.2 Western Australia Micronutrient Fertilizers Market, By Type
9.2.3 Western Australia Micronutrient Fertilizers Market, By Form
9.2.4 Western Australia Micronutrient Fertilizers Market, By Application Mode
9.3 South Australia Micronutrient Fertilizers Market
9.3.1 South Australia Micronutrient Fertilizers Market, By Crop Type
9.3.2 South Australia Micronutrient Fertilizers Market, By Type
9.3.3 South Australia Micronutrient Fertilizers Market, By Form
9.3.4 South Australia Micronutrient Fertilizers Market, By Application Mode
9.4 Queensland Micronutrient Fertilizers Market
9.4.1 Queensland Micronutrient Fertilizers Market, By Crop Type
9.4.2 Queensland Micronutrient Fertilizers Market, By Type
9.4.3 Queensland Micronutrient Fertilizers Market, By Form
9.4.4 Queensland Micronutrient Fertilizers Market, By Application Mode
9.5 New South Wales Micronutrient Fertilizers Market
9.5.1 New South Wales Micronutrient Fertilizers Market, By Crop Type
9.5.2 New South Wales Micronutrient Fertilizers Market, By Type
9.5.3 New South Wales Micronutrient Fertilizers Market, By Form
9.5.4 New South Wales Micronutrient Fertilizers Market, By Application Mode
9.6 Victoria Micronutrient Fertilizers Market
9.6.1 Victoria Micronutrient Fertilizers Market, By Crop Type
9.6.2 Victoria Micronutrient Fertilizers Market, By Type
9.6.3 Victoria Micronutrient Fertilizers Market, By Form
9.6.4 Victoria Micronutrient Fertilizers Market, By Application Mode
9.7 Rest Of Australia Micronutrient Fertilizers Market
9.7.1 Rest Of Australia Micronutrient Fertilizers Market, By Crop Type
9.7.2 Rest Of Australia Micronutrient Fertilizers Market, By Type
9.7.3 Rest Of Australia Micronutrient Fertilizers Market, By Form
9.7.4 Rest Of Australia Micronutrient Fertilizers Market, By Application Mode
10 Australia Micronutrient Fertilizers Market, By Company (Page No. - 129)
10.1 Agrium Inc.
10.1.1 Overview
10.1.2 Key Financials
10.1.3 Product Portfolio
10.1.4 Related Developments
10.1.5 Mmm View
10.2 Akzonobel N.V.
10.2.1 Overview
10.2.1 Key Financials
10.2.2 Product Portfolio
10.2.3 Related Developments
10.2.4 Mmm View
10.3 Basf Se
10.3.1 Overview
10.3.2 Key Financials
10.3.3 Product Portfolio
10.3.4 Related Developments
10.3.5 Mmm View
10.4 Cheminova
10.4.1 Overview
10.4.2 Key Financials
10.4.3 Product Portfolio
10.4.4 Related Developments
10.4.5 Mmm View
10.5 Incitec Pivot Fertilizers Ltd.
10.5.1 Overview
10.5.2 Key Financials
10.5.3 Product Portfolio
10.5.4 Related Developments
10.5.5 Mmm View
10.6 Haifa
10.6.1 Overview
10.6.2 Key Financials
10.6.3 Product Portfolio
10.6.4 Related Developments
10.6.5 Mmm View
10.7 Tradecorp International
10.7.1 Overview
10.7.2 Key Financials
10.7.3 Product Portfolio
10.7.4 Related Developments
10.7.5 Mmm View
10.8 The Mosaic Company
10.8.1 Key Financials
10.8.2 Product Portfolio
10.8.3 Related Developments
10.8.4 Mmm View
10.9 Valagro S.P.A
10.9.1 Overview
10.9.2 Key Financials
10.9.3 Product Portfolio
10.9.4 Related Developments
10.9.5 Mmm View
10.1 Yara International
10.10.1 Overview
10.10.2 Key Financials
10.10.3 Product Portfolio
10.10.4 Related Developments
10.10.5 Mmm View
10.11 Introducing Rt: Real Time Market Intelligence
10.11.1 Rt Snapshots
List Of Tables
Table 1 Australia Micronutrient Fertilizers Market: Macroindicator,By Geography, 2014 (Mn Ha) 23
Table 2 Australia Micronutrient Fertilizers Market, By Crop Type,2013-2019 (Usd Mn) 28
Table 3 Australia Micronutrient Fertilizers Market, By Crop Type, 2013-2019 (000’mt)
Table 4 Australia Micronutrient Fertilizers Market, By Type, 2013-2019 (Usd Mn)
Table 5 Australia Micronutrient Fertilizers Market, By Type, 2013-2019 (000’mt)
Table 6 Australia Micronutrient Fertilizers Market, By Form, 2013-2019 (Usd Mn)
Table 7 Australia Micronutrient Fertilizers Market, By Form, 2013-2019 (000’mt)
Table 8 Australia Micronutrient Fertilizers Market, By Application Mode,2013-2019 (Usd Mn) 32
Table 9 Australia Micronutrient Fertilizers Market, By Application Mode,2013-2019 (000’mt) 33
Table 10 Australian Micronutrient Fertilizers Market: Drivers And Inhibitors
Table 11 Australia Micronutrient Fertilizers Market, By Crop Type,2013-2019 (Usd Mn) 37
Table 12 Australia Micronutrient Fertilizers Market, By Crop Type, 2013-2019 (000’mt)
Table 13 Australia Micronutrient Fertilizers Market In Cereals & Oilseeds,By Geography, 2013-2019 (Usd Mn) 39
Table 14 Australia Micronutrient Fertilizers Market In Cereals & Oilseeds,By Geography, 2013-2019 (000’mt) 40
Table 15 Australia Micronutrient Fertilizers Market In Fruits & Vegetables,By Geography, 2013-2019 (Usd Mn) 42
Table 16 Australia Micronutrient Fertilizers Market In Fruits & Vegetables,By Geography, 2013-2019 (000’mt) 43
Table 17 Australia Micronutrient Fertilizers Market In Rest (Crops), By Geography, 2013-2019 (Usd Mn)
Table 18 Australia Micronutrient Fertilizers Market In Rest (Crops), By Geography, 2013-2019 (000’mt)
Table 19 Australia Micronutrient Fertilizers Market, By Type, 2013-2019 (Usd Mn)
Table 20 Australia Micronutrient Fertilizers Market, By Type, 2013-2019 (000’mt)
Table 21 Australia Zinc (Micronutrient Fertilizers) Market, By Geography,2013-2019 (Usd Mn) 52
Table 22 Australia Zinc (Micronutrient Fertilizers) Market, By Geography,2013-2019 (000’mt) 53
Table 23 Australia Copper (Micronutrient Fertilizers) Market, By Geography,2013-2019 (Usd Mn) 55
Table 24 Australia Copper (Micronutrient Fertilizers) Market, By Geography,2013-2019 (000’mt) 56
Table 25 Australia Iron (Micronutrient Fertilizers) Market, By Geography,2013-2019 (000’mt) 58
Table 26 Australia Manganese (Micronutrient Fertilizers) Market, By Geography, 2013-2019 (Usd Mn)
Table 27 Australia Manganese (Micronutrient Fertilizers) Market, By Geography, 2013-2019 (000’mt)
Table 28 Australia Boron (Micronutrient Fertilizers) Market, By Geography,2013-2019 (Usd Mn) 63
Table 29 Australia Boron (Micronutrient Fertilizers) Market, By Geography,2013-2019 (000’mt) 64
Table 30 Australia Molybdenum (Micronutrient Fertilizers) Market, By Geography, 2013-2019 (Usd Mn)
Table 31 Australia Molybdenum (Micronutrient Fertilizers) Market, By Geography, 2013-2019 (000’mt)
Table 32 Australia Calcium (Micronutrient Fertilizers) Market, By Geography,2013-2019 (Usd Mn) 68
Table 33 Australia Calcium (Micronutrient Fertilizers) Market, By Geography,2013-2019 (000’mt) 69
Table 34 Australia Micronutrient Fertilizers Market, By Form, 2013-2019 (Usd Mn)
Table 35 Australia Micronutrient Fertilizers Market, By Form, 2013-2019 (000’mt)
Table 36 Australia Chelated Micronutrient Fertilizers Market, By Geography,2013-2019 (Usd Mn) 74
Table 37 Australia Chelated Micronutrient Fertilizers Market, By Geography,2013-2019 (000’mt) 75
Table 38 Australia Non-Chelated Micronutrient Fertilizers Market, By Geography, 2013-2019 (Usd Mn)
Table 39 Australia Non-Chelated Micronutrient Fertilizers Market, By Geography, 2013-2019 (000’mt)
Table 40 Australia Micronutrient Fertilizers Market, By Application Mode,2013-2019 (Usd Mn) 81
Table 41 Australia Micronutrient Fertilizers Market, By Application Mode,2013-2019 (000’mt) 82
Table 42 Australia Micronutrient Fertilizers Market In Soil Application,By Geography, 2013-2019 (Usd Mn) 84
Table 43 Australia Micronutrient Fertilizers Market In Soil Application,By Geography, 2013-2019 (000’mt) 85
Table 44 Australia Micronutrient Fertilizers Market In Foliar Application,By Geography, 2013-2019 (Usd Mn) 87
Table 45 Australia Micronutrient Fertilizers Market In Foliar Application,By Geography, 2013-2019 (000’mt) 88
Table 46 Australia Micronutrient Fertilizers Market In Fertigation, By Geography, 2013-2019 (Usd Mn)
Table 47 Australia Micronutrient Fertilizers Market In Fertigation, By Geography, 2013-2019 (000’mt)
Table 48 Agrium Inc., Key Financials, 2010–2014 (Usd Mn)
Table 49 Akzonobel N.V.: Key Financials, 2010–2014 (Usd Mn)
Table 50 Basf Se: Key Financials, 2010–2014 (Usd Mn)
Table 51 Cheminova A/S: Key Financials, 2010–2014 (Usd Mn)
Table 52 Incitec Pivot Ltd.: Key Financials, 2010–2014 (Usd Mn)
Table 53 The Mosaic Company: Key Financials, 2009–2013 (Usd Mn)
Table 54 Yara International Asa: Key Financials, 2010–2014 (Usd Mn)
List Of Figures
Figure 1 Australia Micronutrient Fertilizers Market: Segmentation & Coverage
Figure 2 Micronutrient Fertilizers Market: Integrated Ecosystem
Figure 3 Research Methodology
Figure 4 Top-Down Approach
Figure 5 Bottom-Up Approach
Figure 6 Macroindicator-Based Approach
Figure 7 Australia Micronutrient Fertilizers Market: Snapshot
Figure 8 Australia Micronutrient Fertilizers Market: Growth Aspects
Figure 9 Australia Micronutrient Fertilizers Market, By Crop Type, 2014 Vs 2019
Figure 10 Australia Micronutrient Fertilizers Market, By Type, 2014 (Usd Mn)
Figure 11 Australia Micronutrient Fertilizers Market, By Form, 2014 (Usd Mn)
Figure 12 Australia Micronutrient Fertilizers Market, By Application Mode, 2014
Figure 13 Australia Micronutrient Fertilizers Market, By Crop Type,2014 & 2019 (Usd Mn) 36
Figure 14 Australia Micronutrient Fertilizers Market, By Crop Type,2014 & 2019 (000’mt) 37
Figure 15 Australia Micronutrient Fertilizers Market In Cereals & Oilseeds,By Geography, 2013-2019 (Usd Mn) 38
Figure 16 Australia Micronutrient Fertilizers Market In Cereals & Oilseeds,By Geography, 2013-2019 (000’mt) 39
Figure 17 Australia Micronutrient Fertilizers Market In Fruits & Vegetables,By Geography, 2013-2019 (Usd Mn) 41
Figure 18 Australia Micronutrient Fertilizers Market In Fruits & Vegetables,By Geography, 2013-2019 (000’mt) 42
Figure 19 Australia Micronutrient Fertilizers Market In Rest (Crops), By Geography, 2013-2019 (Usd Mn)
Figure 20 Australia Micronutrient Fertilizers Market In Rest (Crops), By Geography, 2013-2019 (000’mt)
Figure 21 Australia Micronutrient Fertilizers Market, By Type, 2014 & 2019 (Usd Mn)
Figure 22 Australia Micronutrient Fertilizers Market, By Type, 2014 & 2019 (000’mt)
Figure 23 Australia Zinc (Micronutrient Fertilizers) Market, By Geography,2013-2019 (Usd Mn) 51
Figure 24 Australia Zinc (Micronutrient Fertilizers) Market, By Geography,2013-2019 (000’mt) 52
Figure 25 Australia Copper (Micronutrient Fertilizers) Market, By Geography,2013-2019 (Usd Mn) 54
Figure 26 Australia Copper (Micronutrient Fertilizers) Market, By Geography,2013-2019 (000’mt) 55
Figure 27 Australia Iron (Micronutrient Fertilizers) Market, By Geography,2013-2019 (Usd Mn) 57
Figure 28 Australia Iron (Micronutrient Fertilizers) Market, By Geography,2013-2019 (Usd Mn) 57
Figure 29 Australia Iron (Micronutrient Fertilizers) Market, By Geography,2013-2019 (000’mt) 58
Figure 30 Australia Manganese (Micronutrient Fertilizers) Market, By Geography, 2013-2019 (Usd Mn)
Figure 31 Australia Manganese (Micronutrient Fertilizers) Market, By Geography, 2013-2019 (000’mt)
Figure 32 Australia Boron (Micronutrient Fertilizers) Market, By Geography,2013-2019 (Usd Mn) 62
Figure 33 Australia Boron (Micronutrient Fertilizers) Market, By Geography,2013-2019 (000’mt) 63
Figure 34 Australia Molybdenum (Micronutrient Fertilizers) Market, By Geography, 2013-2019 (Usd Mn)
Figure 35 Australia Molybdenum (Micronutrient Fertilizers) Market, By Geography, 2013-2019 (000’mt)
Figure 36 Australia Calcium (Micronutrient Fertilizers) Market, By Geography,2013-2019 (Usd Mn) 67
Figure 37 Australia Calcium (Micronutrient Fertilizers) Market, By Geography,2013-2019 (000’mt) 68
Figure 38 Australia Micronutrient Fertilizers Market, By Form, 2014 & 2019 (Usd Mn)
Figure 39 Australia Micronutrient Fertilizers Market, By Form, 2014 & 2019 (000’mt)
Figure 40 Australia Chelated Micronutrient Fertilizers Market, By Geography,2013-2019 (Usd Mn) 73
Figure 41 Australia Chelated Micronutrient Fertilizers Market, By Geography,2013-2019 (000’mt) 74
Figure 42 Australia Non-Chelated Micronutrient Fertilizers Market, By Geography, 2013-2019 (Usd Mn)
Figure 43 Australia Non-Chelated Micronutrient Fertilizers Market, By Geography, 2013-2019 (000’mt)
Figure 44 Australia Micronutrient Fertilizers Market, By Application Mode,2014 & 2019 (Usd Mn) 80
Figure 45 Australia Micronutrient Fertilizers Market, By Application Mode,2014 & 2019 (000’mt) 81
Figure 46 Australia Micronutrient Fertilizers Market In Soil Application,By Geography, 2013-2019 (Usd Mn) 83
Figure 47 Australia Micronutrient Fertilizers Market In Soil Application,By Geography, 2013-2019 (000’mt) 84
Figure 48 Australia Micronutrient Fertilizers Market In Foliar Application,By Geography, 2013-2019 (Usd Mn) 86
Figure 49 Australia Micronutrient Fertilizers Market In Foliar Application,By Geography, 2013-2019 (000’mt) 87
Figure 50 Australia Micronutrient Fertilizers Market In Fertigation,By Geography, 2013-2019 (Usd Mn) 89
Figure 51 Australia Micronutrient Fertilizers Market In Fertigation,By Geography, 2013-2019 (000’mt) 90
Figure 52 Agrium Inc., Revenue Mix, 2014 (%)
Figure 53 Akzonobel N.V. : Revenue Mix, 2014 (%)
Figure 54 Basf Se : Revenue Mix, 2014 (%)
Figure 55 Cheminova As: Revenue Mix, 2014 (%)
Figure 56 Incitec Pivot Ltd.: Revenue Mix, 2014 (%)
Figure 57 The Mosaic Company: Revenue Mix, 2013 (%)
Figure 58 Yara International Asa: Revenue Mix, 2014 (%)
The decline in fertility of soil due to extensive farming, resulting in increasing micronutrient deficiency in soil, has fueled the demand for micronutrient fertilizers. Australia suffers from large scale micronutrient deficiency due to variation in pH of soil in different states. The reducing availability of arable land area has added to the demand for micronutrient fertilizers to fulfill the demand of the ever-growing population. The increase in aeroponics and hydroponics crop production technology has also contributed to the demand of micronutrient fertilizers in Australia.
Micronutrients are elements needed by plants in minuscule amounts; these elements are also known as minor elements or trace elements. Some major micronutrients are boron, copper, iron, calcium, manganese, molybdenum, and zinc. Micronutrient fertilizers tackle the deficiency of these micronutrients in soil by adding micronutrients to the soil applied by different application modes such as soil, foliar, and fertigation. The cereals & oilseeds and fruits & vegetables are the crop-types with the largest demand for micronutrient fertilizers in Australia.
The objective of this report is to identify various application modes and usage patterns across industries and to analyze the complete ecosystem of the Australia micronutrient fertilizers market. It involves an in-depth analysis of the market segmentation, which comprises micronutrient fertilizers type, crop-type, form, application mode, and geography covered. The report also provides a deep insight into the strategies of key players of the market.
The Australia micronutrient fertilizers market was valued at $111.3 million in 2014 and is projected to grow at a CAGR of 7.5% from 2014 to 2019. The concerned market is segmented with respect to different type, application mode, crop-type, form, and geography. The application mode includes soil, foliar, fertigation, and others. The soil application mode segment has the largest share in 2014. On the basis of different crop-type, the market is segmented into cereals & oilseeds, fruits & vegetables, and rest (crops). In 2014, cereals & oilseeds are the largest crop-type segment of the micronutrient fertilizers market in Australia.
Please visit https://www.micromarketmonitor.com/custom-research-services.html to specify your custom Research Requirement
| PRODUCT TITLE | PUBLISHED | |
|---|---|---|
|
|
North America Agrochemicals Agrochemicals-North America and Pesticides, Agricultural... |
Upcoming |
|
|
Europe Agrochemicals Agrochemicals-Europe and Pesticides, Agricultural... |
Upcoming |


