

North America Revenue Cycle Management (RCM) Market, by product (Integrated RCM, Standalone RCM), by Component, by Deployment (On premise, Web based, Cloud-based), by End-User (Hospitals, Physicians, Labs, Others), by Function (Front office, Middle office, Back office) – Forecast to 2021
- Publish Date: Apr 2016


Globally, North America is the largest revenue cycle management (RCM) market growing at a CAGR of 12.0% for the forecast period from 2016-2021. The large share is attributed to the rise in adoption of new and updated versions of RCM solutions. There is a huge unmet demand for new versions of RCM solutions due to consolidation of Healthcare Providers especially in the advent of decline in reimbursements rates, forcing hospitals to find areas wherein they can increase internal efficiency and automate processes with an aim of reducing expenditure.
In this report, the revenue cycle management market is segmented on the basis of its product type, deployment, component, end-user, and function segment. There are two product type of Revenue Cycle Management available in the market, such as integrated revenue cycle management and standalone revenue cycle management. Standalone billing and practice management solutions are on the wane in the market today as medical practices move towards integrated, end-to-end systems that unite front and back office data flows, provide seamless access to clinical data from EHRs, and rationalize and streamline the entire RCM process.
To know about the assumptions considered for the study, Download the PDF Brochure !
On the basis of deployment this report further categorizes market into on-premises, web-premises, and cloud-premises. Due to its advantages over on-premises, and web-premises, RCM solutions deployed on cloud are growing at double digit CAGR from 2016 to 2021.
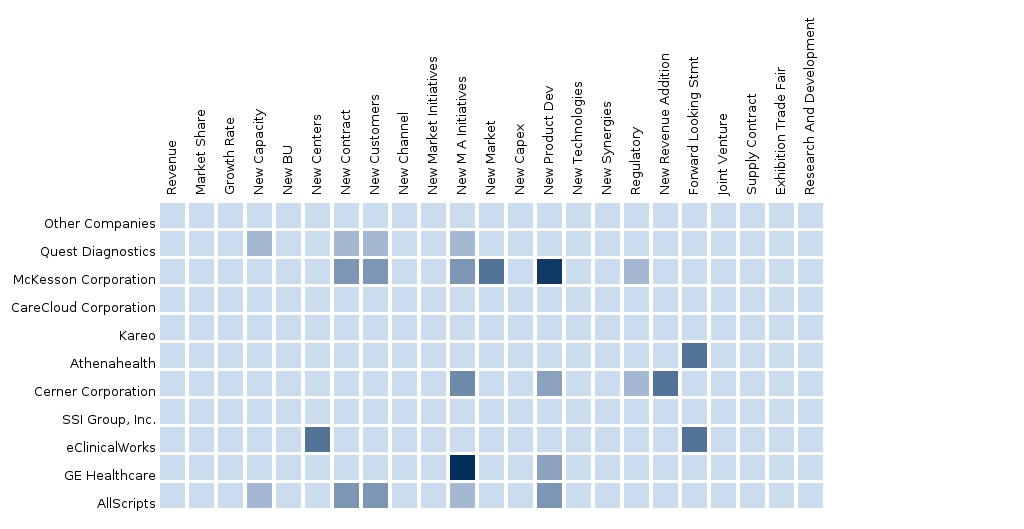
The major companies operating in this market are Quest Diagnostics (U.S.), Cerner Corporation (U.S.), McKesson Corporation (U.S.), Athenahealth, Inc. (U.S.), Allscripts Healthcare Solutions, Inc. (U.S.), eClinicalWorks, Inc. (U.S.), CareCloud Corporation (U.S.), The SSI Groups, Inc. (U.S.), GE Healthcare (U.K.), Epic Systems (U.S.), Siemens Healthcare (Germany), Kareo, Inc. (U.S.)
The report provides a detailed competitive landscaping of these companies. Segment and Country specific Company shares, News & Deals, M&A, segment specific pipeline products, product approvals and product recalls of the major companies would be detailed. Key players of the Revenue Cycle Management (RCM) market in North America intend to focus on acquisitions and strategic collaborations including agreements, joint ventures to increase their market share and strethen the product portfolio. For instance, in July 2014, Allscripts Healthcare Solutions, Inc. (U.S.) acquired Oasis Medical Solutions Limited (U.K.).
Related Reports:
Global Revenue Cycle Management (RCM) Market by Product (Integrated RCM, Standalone RCM), by Deployment (On Premise, Web Based, Cloud Based), by Component ( Software, Services) and, by End User
http://www.micromarketmonitor.com/market-report/revenue-cycle-management-rcm-reports-3433871731.html
Table of Contents
1 Introduction
1.1 Objectives of the Study
1.2 Market Segmentation & Coverage
1.3 Stakeholders
2 Research Methodology
2.1 Integrated Ecosystem of Revenue Cycle Management Market
2.2 Arriving At the Revenue Cycle Management Market Size
2.2.1 Top-Down Approach
2.2.2 Bottom-Up Approach
2.2.3 Macro Indicator-Based Approach
2.3 Assumptions
3 Executive Summary
4 Market Overview
4.1 Introduction
4.2 Market Drivers and Inhibitors
4.3 Key Market Dynamics
5 North American Revenue Cycle Management Market, By Product
5.1 Introduction
5.2 North America: Revenue Cycle Management Market, By Product
5.3 North America: Integrated Revenue Cycle Management Market, By Geography, 2015 Vs 2021 (USD Mn)
5.4 North America: Standalone Revenue Cycle Management Market, By Geography, 2015 Vs 2021 (USD Mn)
6 North American Revenue Cycle Management Market, By Component
6.1 Introductions
6.2 North America: Revenue Cycle Management Market in Services, By Geography, 2014–2021 (USD Mn)
6.3 North America: Revenue Cycle Management Market in Software, By Geography, 2014–2021 (USD Mn)
7 North American Revenue Cycle Management, By Deployment
7.1 Introduction
7.2 North America: Revenue Cycle Management Market in Web-Based, By Geography, 2014–2021 (USD Mn)
7.3 North America: Revenue Cycle Management Market in on-Premise, By Geography, 2014–2021 (USD Mn)
7.4 North America: Revenue Cycle Management Market in Cloud-Based, By Geography, 2014–2021 (USD Mn)
8 North American Revenue Cycle Management, By End-User
8.1 Introduction
8.2 North America: Revenue Cycle Management Market in Physicians, By Geography, 2014–2021 (USD Mn)
8.3 North America: Revenue Cycle Management Market in Hospitals, By Geography, 2014–2021 (USD Mn)
8.4 North America: Revenue Cycle Management Market in Laboratories, By Geography, 2014–2021 (USD Mn)
9 North American Revenue Cycle Management, By Function
9.1 Introduction
9.2 North America: Front Office Revenue Cycle Management Marke, By Geography, 2014–2021 (USD Mn)
9.3 North America: Middle Office Revenue Cycle Management Market, By Geography, 2014–2021 (USD Mn)
9.4 North America: Back Office Revenue Cycle Management Market, By Geography, 2014–2021 (USD Mn)
10 North American Revenue Cycle Management Market, By Geography
10.1 U.S. Revenue Cycle Management Market
10.1.1 U.S. Revenue Cycle Management Market, By Product
10.1.2 U.S. Revenue Cycle Management Market, By Component
10.1.3 U.S. Revenue Cycle Management Market, By Deployment
10.1.4 U.S. Revenue Cycle Management Market, By End-User
10.1.5 U.S. Revenue Cycle Management Market, By Function
10.2 Canada Revenue Cycle Management Market
10.2.1 Canada Revenue Cycle Management Market, By Product
10.2.2 Canada Revenue Cycle Management Market, By Component
10.2.3 Canada Revenue Cycle Management Market, By Deployment
10.2.4 Canada Revenue Cycle Management Market, By End-User
10.2.5 Canada Revenue Cycle Management Market, By Function
10.3 Mexico Revenue Cycle Management Market
10.3.1 Mexico Revenue Cycle Management Market, By Product
10.3.2 Mexico Revenue Cycle Management Market, By Component
10.3.3 Mexico Revenue Cycle Management Market, By Deployment
10.3.4 Mexico Revenue Cycle Management Market, By End-User
10.1.5 Mexico Revenue Cycle Management Market, By Function
11 North American Revenue Cycle Management Market: Competitive Landscape
11.1 North America: Revenue Cycle Management Market Company Share Analysis
11.2 Company Presence In the North American Revenue Cycle Management Market, By Product
11.3 Mergers & Acquisitions
11.4 Expansions
11.5 Investments
11.6 Joint Ventures
12 North American Revenue Cycle Management Market, By Company
(Overview, Financials, Products & Services, Strategy, and Developments)*
12.1 Allscripts
12.2 Athenahealth, Inc.
12.3 Carecloud Corporation
12.4 Cerner Corporation
12.5 Eclinicalworks
12.6 Epic Systems Corporation
12.7 General Electric Company
12.8 Kareo, Inc
12.9 Mckesson Corporation
12.10 Quest Diagnostics
12.11 The Ssi Group, Inc.
12.12 Emdeon Inc.
12.13 Transunion Llc.
*Details on Overview, Financials, Product & Services, Strategy, and Developments Might Not Be Captured in Case Of Unlisted Company
13 Appendix
13.1 Customization Options
13.1.1 Regulatory Framework
13.1.2 Impact Analysis
13.2 Related Reports
13.3 Introducing Rt: Real Time Market Intelligence
13.3.1 Rt Snapshots
List of Tables
Table 1 North America Revenue Cycle Management Market: Drivers and Inhibitors
Table 2 North America: Revenue Cycle Management Market, By Product, 2014–2021 (USD Mn)
Table 3 North America: Revenue Cycle Management Market, By Geography, 2014–2021 (USD Mn)
Table 4 North America: Revenue Cycle Management Market, By Component, 2014–2021 (USD Mn)
Table 5 North America: Revenue Cycle Management Market: By Deployment, 2014–2021 (USD Mn)
Table 6 North America: Revenue Cycle Management Market, By End-User, 2014–2021 (USD Mn)
Table 7 North America: Revenue Cycle Management Market, By Function, 2014–2021 (USD Mn)
Table 8 North America: Integrated Revenue Cycle Management Market, By Geography, 2014–2021 (USD Mn)
Table 9 North America: Standalone Revenue Cycle Management Market, By Geography, 2014–2021 (USD Mn)
Table 10 North America: Revenue Cycle Management Market, By Component, 2014–2021 (USD Mn)
Table 11 North America: Revenue Cycle Management Market in Services, By Geography, 2014–2021 (USD Mn)
Table 12 North America: Revenue Cycle Management Market in Software, By Geography, 2014–2021 (USD Mn)
Table 13 North America: Revenue Cycle Management Market, By Deployment, 2014–2021 (USD Mn)
Table 14 North America: Revenue Cycle Management Market in Web-Based, By Geography, 2014–2021 (USD Mn)
Table 15 North America: Revenue Cycle Management Market in on-Premise, By Geography, 2014–2021 (USD Mn)
Table 16 North America: Revenue Cycle Management Market in Cloud-Based, By Geography, 2014–2021 (USD Mn)
Table 17 North America: Revenue Cycle Management Market, By End-User, 2014–2021 (USD Mn)
Table 18 North America: Revenue Cycle Management Market in Physicians, By Geography, 2014–2021 (USD Mn)
Table 19 North America: Revenue Cycle Management Market in Hospitals, By Geography, 2014–2021 (USD Mn)
Table 20 North America: Revenue Cycle Management Market in Laboratories, By Geography, 2014–2021 (USD Mn)
Table 21 North America: Front Office Revenue Cycle Management Market, By Geography, 2014–2021 (USD Mn)
Table 22 North America: Middle Office Revenue Cycle Management Market, By Geography, 2014–2021 (USD Mn)
Table 23 North America: Back Office Revenue Cycle Management Market, By Geography, 2014–2021 (USD Mn)
Table 24 U.S. Revenue Cycle Management Market, By Product, 2014–2021 (USD Mn)
Table 25 U.S. Revenue Cycle Management Market, By Component, 2014–2021 (USD Mn)
Table 26 U.S. Revenue Cycle Management Market, By Deployment, 2014–2021 (USD Mn)
Table 27 U.S. Revenue Cycle Management Market, By End-User, 2014–2021 (USD Mn)
Table 28 U.S. Revenue Cycle Management Market, By Function, 2014–2021 (USD Mn)
Table 29 Canada: Revenue Cycle Management Market, By Product, 2014–2021 (USD Mn)
Table 30 Canada Revenue Cycle Management Market, By Component, 2014–2021 (USD Mn)
Table 31 Canada Revenue Cycle Management Market, By Deployment, 2014–2021 (USD Mn)
Table 32 Canada Revenue Cycle Management Market, By End-User, 2014–2021 (USD Mn)
Table 33 Canada Revenue Cycle Management Market, By Function, 2014–2021 (USD Mn)
Table 24 Mexico Revenue Cycle Management Market, By Product, 2014–2021 (USD Mn)
Table 35 Mexico Revenue Cycle Management Market, By Component, 2014–2021 (USD Mn)
Table 36 Mexico Revenue Cycle Management Market, By Component, 2014–2021 (USD Mn)
Table 37 Mexico Revenue Cycle Management Market, By End-User, 2014–2021 (USD Mn)
Table 38 Mexico Revenue Cycle Management Market, By Function, 2014–2021 (USD Mn)
Table 39 Revenue Cycle Management Market: Company Share Analysis, 2015
Table 40 North America: Revenue Cycle Management Market Mergers & Acquisitions
Table 41 North America: Revenue Cycle Management Market Expansions
Table 42 North America: Revenue Cycle Management Market Investments
Table 43 North America: Revenue Cycle Management Market Joint Ventures
Table 44 Allscripts Healthcare Solutions, Inc.: Key Financials, 2011-2015 (USD Mn)
Table 45 Athenahealth, Inc.: Key Financials, 2011–2015 (USD Mn)
Table 46 Cerner Corporation: Key Financials, 2011-2015 (USD Mn)
Table 47 Ge Healthcare: Key Financials, 2011–2015 (USD Mn)
Table 48 Ge Healthcare: Key Financials, By Geographical Segment, 2011–2015 (USD Mn)
Table 49 Mckesson Corporation: Key Financials, By Business Segment, 2011–2015 (USD Mn)
Table 50 Mckesson Corporation: Key Financials, By Geographical Segment, 2011–2015 (USD Mn)
Table 51 Quest Diagnostics: Key Financials, 2011–2015 (USD Mn)
List of Figures
Figure 1 North American Revenue Cycle Management Market: Segmentation & Coverage
Figure 2 Revenue Cycle Management Market: Integrated Ecosystem
Figure 3 Research Methodology
Figure 4 Top-Down Approach
Figure 5 Bottom-Up Approach
Figure 6 Macro Indicator-Based Approach
Figure 7 North America: Revenue Cycle Management Market Snapshot
Figure 8 U.S. Revenue Cycle Management: Adoption Rate (%)
Figure 9 North America: Revenue Cycle Management Market: Product, By Geography, 2015 (USD Mn)
Figure 10 North America: Revenue Cycle Management Market, By Product, 2015 Vs 2021 (USD Mn)
Figure 11 North America: Integrated Revenue Cycle Management Market, By Geography, 2015 Vs 2021 (USD Mn)
Figure 12 North America: Standalone Revenue Cycle Management Market, By Geography, 2015 Vs 2021 (USD Mn)
Figure 13 North America: Revenue Cycle Management Market, By Component, 2015 Vs 2021 (USD Mn)
Figure 14 North America: Revenue Cycle Management Market in Services, By Geography, 2014–2021 (USD Mn)
Figure 15 North America: Revenue Cycle Management Market in Software, By Geography, 2014–2021 (USD Mn)
Figure 16 North America: Revenue Cycle Management, By Deployment, 2015 Vs 2021 (USD Mn)
Figure 17 North America: Revenue Cycle Management Market in Web-Based, By Geography, 2014–2021 (USD Mn)
Figure 18 North America: Revenue Cycle Management Market in on-Premise, By Geography, 2014–2021 (USD Mn)
Figure 19 North America: Revenue Cycle Management Market in Cloud-Based, By Geography, 2014–2021 (USD Mn)
Figure 20 North America: Revenue Cycle Management Market, By End-User, 2015 Vs 2021 (USD Mn)
Figure 21 North America: Revenue Cycle Management Market in Physicians, By Geography, 2014–2021 (USD Mn)
Figure 22 North America: Revenue Cycle Management Market in Hospitals, By Geography, 2014–2021 (USD Mn)
Figure 23 North America: Revenue Cycle Management Market in Laboratories, By Geography, 2014–2021 (USD Mn)
Figure 24 North America: Front Office Revenue Cycle Management Market, By Geography, 2014–2021 (USD Mn)
Figure 25 North America: Middle Office Revenue Cycle Management Market, By Geography, 2014–2021 (USD Mn)
Figure 26 North America: Back Office Revenue Cycle Management Market, By Geography, 2014–2021 (USD Mn)
Figure 27 U.S. Revenue Cycle Management Market Overview, 2015 & 2021 (%)
Figure 28 U.S.: Revenue Cycle Management Market, By Product, 2014–2021 (USD Mn)
Figure 29 U.S. Revenue Cycle Management Market, By Component, 2014–2021 (USD Mn)
Figure 30 U.S. Revenue Cycle Management Market, By Deployment, 2014–2021 (USD Mn)
Figure 31 U.S. Revenue Cycle Management Market, By End-User, 2014–2021 (USD Mn)
Figure 32 Canada Revenue Cycle Management Market Overview, 2015 & 2021 (%)
Figure 33 Canada Revenue Cycle Management Market, By Product, 2014–2021 (USD Mn)
Figure 34 Canada Revenue Cycle Management Market, By Component, 2014–2021 (USD Mn)
Figure 35 Canada Revenue Cycle Management Market, By Deployment, 2014–2021 (USD Mn)
Figure 36 Canada Revenue Cycle Management Market, By End-User, 2014–2021 (USD Mn)
Figure 37 Mexico Revenue Cycle Management Market Overview, 2015 & 2021 (%)
Figure 38 Mexico Revenue Cycle Management Market, By Product, 2014–2021 (USD Mn)
Figure 39 Mexico Revenue Cycle Management Market, By Component, 2014–2021 (USD Mn)
Figure 40 Mexico Revenue Cycle Management Market, By Deployment, 2014–2021 (USD Mn)
Figure 41 Mexico Revenue Cycle Management Market, By End-User, 2014–2021 (USD Mn)
Figure 42 Revenue Cycle Management Market: Company Share Analysis, 2015 (%)
Figure 43 North American Revenue Cycle Management: Company Product Coverage, By Product 2015
Figure 44 Allscripts Healthcare Solutions, Inc.: Revenue Mix, 2015 (%)
Figure 45 Cerner Corporation: Revenue Mix, 2015 (%)
Figure 46 Contribution of Services Segment Towards Company Revenues, 2008–2014 (USD Mn)
Figure 47 Ge Healthcare Revenue Mix, 2015 (%)
Figure 48 Mckesson Corporation Revenue Mix, 2015 (%)
Figure 49 Quest Diagnostics Revenue Mix, 2015 (%)
Figure 50 Contribution of Diagnostic Solutions Segment Towards Company Revenues, 2009–2014 (USD Mn)
Revenue cycle management (RCM) for healthcare providers enables healthcare organizations to accelerate their respective revenue cycle processes. This is achieved by reducing the number of denied insurance claims, speeding explanation of benefits (EOB) reconciliation, improving the quality of information, streamlining denial management, and automating operational processes. The RCM solution starts when a patient enters the hospital, thereby automating business processes and leading to speedy follow ups, which encompasses patient and payer follow-ups. Hospitals need to maintain a faster RCM cycle to stay solvent, maintain requisite cash flow, and keep revenue figures stable.
In this report, the revenue cycle management market is segmented on the basis of product, deployment, component, end-user, and geography. The revenue cycle management market is segmented with respect to product into integrated RCM and standalone RCM. The end-users of this market include hospitals, laboratories, and physicians among others.
In the components sub-category of the North American revenue cycle management market, the services segment dominates the market with 68.2% share in 2014. Similarly, in the deployments sub-category of the market, the web-based segment dominates the market, and is expected to grow at a CAGR of 12.2% from 2014 to 2019. The end-user segment is dominated by physicians among end-users, and is expected to reach $13,220.8 million by 2019.
The North American revenue cycle management market is steadily progressing owing to factors, such as decreasing reimbursement in healthcare industry, reduction of overall healthcare costs, initiatives undertaken by governmental bodies for implementing RCM solutions, and increasing expenditure on information technology. The North American revenue cycle management (RCM) market was valued at USD 20.50 billion in 2015, and is expected to reach USD 40.44 billion by 2021, at a CAGR of 12.0% from 2016 to 2021.
The key players in the North American revenue cycle management market are McKesson Corporation (U.S.), Cerner Corporation (U.S.), Quest Diagnostics (U.S.), Athenahealth, Inc. (U.S.), Allscripts Healthcare Solutions, Inc. (U.S.), eClinicalWorks, Inc. (U.S.), CareCloud Corporation (U.S.), The SSI Groups, Inc. (U.S.), GE Healthcare (U.K.), Epic Systems (U.S.), Siemens Healthcare (Germany), and Kareo, Inc. (U.S.) among others.
Speak to our expert analyst for a discussion on the above findings, click Speak to Analyst !
Please visit https://www.micromarketmonitor.com/custom-research-services.html to specify your custom Research Requirement
| PRODUCT TITLE | PUBLISHED | |
|---|---|---|
|
|
North American Non-Clinical Information System Market North America is the largest market for non-clinical information systems globally, and is expected to grow at a CAGR of 8.1% from 2013 to 2018, to reach a value of $8,905.5 million in 2018. This market is segmented into sub-segments, components, deployments, end users, applications, and geographies. |
Upcoming |
|
|
European Non-Clinical Information Systems Market The European non-clinical information systems (NCIS) market has been segmented by types, deployment, components, end users, applications, and geographies. Globally, this is the second-largest NCIS market, and is expected to grow at a CAGR of 6.3% from 2014 to 2019. |
Upcoming |
|
|
Asian Non-Clinical Information Systems Market Asia is the fastest-growing market for non-clinical information systems, and was valued at $1,336.4 million in 2013. It is expected to grow at a CAGR of 7.2%, from 2013 to 2018, to reach a value of $1,892.2 million in 2018. This market can be segmented by companies, deployments, components, end users, and macro indicators. |
Upcoming |


