

Non-Lethal Weapons Market - North America by Type (Offensive and Defensive) by Technology (Electromagnetic & Sonic, Kinetic Impact, Chemical Agents) by Application (Police Forces, Special Forces, First Responders) by Country (U.S. and Canada) Analysis and Forecast (2014-2019)
- Publish Date: Apr 2015


The North America non-lethal weapons market has been classified on the basis of applications, weapon types, technology, and country. The major applications include police forces, special forces, and first responders.
Police forces application segment is expected to be the largest segment in the North America, and is projected to grow at a CAGR of 5.8% from 2014 to 2019. Increasing social unrest, increasing applications by law enforcement agencies, and efficiency and effectiveness of non-lethal weapons are driving the police forces application segment at a significant pace.
The North American market is a competitive one with presence of a large number of market players. As of 2014, the North American market was dominated by NonLethal Technologies, Inc., TASER International, Inc., Raytheon Company, and Lamperd less Lethal Inc. New product developments, agreements, and contracts are the major strategies adopted by these major players to achieve growth in the North America non-lethal weapons market.
Reasons to Buy the Report:
From an insight perspective, this research report focuses on various levels of analysis—industry analysis (industry trends and PEST analysis), market share analysis of top players, supply chain analysis, and company profiles, which together provide the basic views on the competitive landscape, emerging and high-growth segments of the market, high-growth countries & their respective regulatory policies, government initiatives, and market drivers, restraints, and opportunities.
The report will enrich both the established firms as well as new entrants/smaller firms to gauge the pulse of the market, which in turn will help the firms garner a greater share in the North American market. Firms that purchase the report could use any one or a combination of five strategies that include market penetration, product development/innovation, market development, market diversification, and competitive assessment to strengthen their market share.
The report provides insights on the following pointers:
Market Penetration: Comprehensive information on weapons types offered by top players in the non-lethal weapons market.
- Product Development/Innovation: Detailed insights on upcoming technologies, research & development activities, and new product launches in the non-lethal weapons market.
- Market Development: Comprehensive information of lucrative emerging markets. The report analyzes the markets for various non-lethal weapons technologies at regional and country levels.
- Market Diversification: Exhaustive information of new products, untapped geographies, recent developments, and investments in the market.
Competitive Assessment: In-depth assessment of market shares, strategies, products, and manufacturing capabilities of leading players in the market.
Table of Contents
1 Introduction (Page No. - 9)
1.1 Objectives of the Study
1.2 Market Segmentation & Coverage
1.3 Stakeholders
2 Research Methodology (Page No. - 11)
2.1 Integrated Ecosystem of Non-Lethal Weapons Market
2.2 Arriving at the Non-Lethal Weapons Market Size
2.2.1 Top-Down Approach
2.2.2 Bottom-Up Approach
2.2.3 Demand Side Approach
2.2.4 Macro Indicator-Based Approach
2.3 Assumptions
3 Executive Summary (Page No. - 18)
4 Market Overview (Page No. - 19)
4.1 Introduction
4.2 Non-Lethal Weapons Market: Comparison With Parent Market
4.3 Market Drivers and Inhibitors
4.4 Key Market Dynamics
4.5 Demand-Side Analysis
5 North America Non-Lethal Weapons Market, By Application (Page No. - 27)
5.1 Introduction
5.2 Demand-Side Analysis
5.3 Non-Lethal Weapons for Police Forces, By Geography
5.4 Non-Lethal Weapons for Special Forces, By Geography
5.5 Non-Lethal Weapons for First Responders, By Geography
5.6 Sneak View: North American Weapons Market, By Application, 2014 (USD MN)
6 North America Non-Lethal Weapons Market, By Type (Page No. - 34)
6.1 Introduction
6.2 North American Direct Contact Weapons Market:, By Type
6.3 North American Directed Energy Weapons Market:, By Type
6.4 North American Personal Protective Equipment Market, By Type
6.5 North American Direct Contact Weapons Market, By Geography
6.6 North American Directed Energy Weapons Market, By Geography
6.7 North American Personal Protective Equipment Market, By Geography
6.8 North American Surveillance Systems Market, By Geography
6.9 Sneak View: North American Market, By Type
7 North America Non-Lethal Weapons Market, By Technology (Page No. - 44)
7.1 Introduction
7.2 North American Electromagnetic & Sonic Weapons Market, By Geography
7.3 North American Kinetic Impact Weapons Market, By Geography
7.4 North American Chemical Agents Market, By Geography
8 North America Non-Lethal Weapons Market, By Geography (Page No. - 49)
8.1 U.S. Market
8.1.1 U.S. Market, By Application
8.1.2 U.S. Market, By Type
8.2 CanadaMarket
8.2.1 Canada Market, By Application
8.2.2 Canada Market, By Type
9 North America Non-Lethal Weapons Market: Competitive Landscape (Page No. - 61)
9.1 Non-Lethal Weapons Market: Company Share Analysis
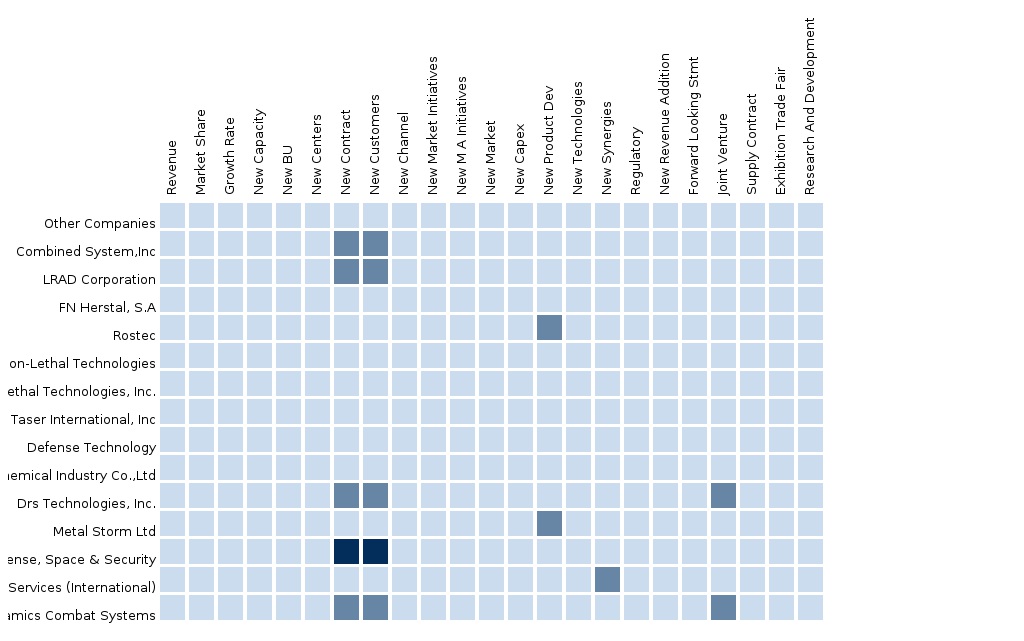
9.2 Company Presence in the Market, By Type
9.3 Contracts
9.4 Expansions
9.5 New Product Launches
9.6 Joint Ventures
10 North America Non-Lethal Weapons Market, By Company (Page No. - 65)
10.1 Taser International, Inc.
10.2 Nonlethal Technologies, Inc.
10.3 LRAD Corporation
10.4 Lamperd Less Lethal Inc.
10.5 Raytheon Company
10.6 Amtec Less-Lethal Systems, Inc.
11 Appendix (Page No. - 81)
11.1 Customization Options
11.1.1 Technical Analysis
11.1.2 Weapon Types
11.1.3 Regulatory Framework
11.1.4 Impact Analysis
11.1.5 Historical Data and Trends
11.2 Related Reports
List of Tables (54 Tables)
Table 1 Global Non-Lethal Weapons: Peer Market Size, 2014 (USD MN)
Table 2 North American Market, By Application, 2014 (USD MN)
Table 3 North American Market: Macro Indicators, By Geography, 2014 (USD MN)
Table 4 Global Market: Comparison With Parent Market, 2013 – 2019 (USD MN)
Table 5 North America Non-Lethal Weapons Market: Comparison With Parent Market, 2013 – 2019 (USD MN)
Table 6 North American Market: Drivers and Inhibitors
Table 7 North American Market, By Application, 2013 - 2019 (USD MN)
Table 8 North American Market, By Technology, 2013 - 2019 (USD MN)
Table 9 North American Market, By Type, 2013 - 2019 (USD MN)
Table 10 North American Market, By Geography, 2013 - 2019 (USD MN)
Table 11 North American Market: Comparison With Application Markets, 2013 - 2019 (USD MN)
Table 12 North American Market, By Application, 2013 - 2019 (USD MN)
Table 13 North American Non-Lethal Weapons for Police Forces, By Geography, 2013 - 2019 (USD MN)
Table 14 North American Non-Lethal Weapons for Special Forces, By Geography, 2013 - 2019 (USD MN)
Table 15 North American Non-Lethal Weapons for First Responders, By Geography, 2013 - 2019 (USD MN)
Table 16 North American Market, By Type, 2013 - 2019 (USD MN)
Table 17 North American Direct Contact Weapons Market, By Type, 2013 - 2019 (USD MN)
Table 18 North American Directed Energy Weapons Market, By Type, 2013 - 2019 (USD MN)
Table 19 North American Personal Protective Equipment Market, By Type, 2013 - 2019 (USD MN)
Table 20 North American Direct Contact Weapons Market, By Geography, 2013 - 2019 (USD MN)
Table 21 North American Directed Energy Weapons Market, By Geography, 2013 - 2019 (USD MN)
Table 22 North American Personal Protective Equipment Market, By Geography, 2013 - 2019 (USD MN)
Table 23 North American Surveillance Systems Market, By Geography, 2013 – 2019
Table 24 North America Market, By Technology, 2013 - 2019 (USD MN)
Table 25 North American Electromagnetic & Sonic Weapons Market, By Geography, 2013 - 2019 (USD MN)
Table 26 North American Kinetic Impact Weapons Market, By Geography, 2013 - 2019 (USD MN)
Table 27 North American Chemical Agents Market, By Geography, 2013 - 2019 (USD MN)
Table 28 North American Market, By Geography, 2013 - 2019 (USD MN)
Table 29 U.S. Market, By Application, 2013 - 2019 (USD MN)
Table 30 U.S. Market, By Type, 2013 - 2019 (USD MN)
Table 31 U.S. Market: Direct Contact Weapons, By Type, 2013 - 2019 (USD MN)
Table 32 U.S. Market: Directed Energy Weapons, By Type, 2013 - 2019 (USD MN)
Table 33 U.S. Personal Protective Equipment Market, By Type, 2013 - 2019 (USD MN)
Table 34 U.S. Market, By Technology, 2013 - 2019 (USD MN)
Table 35 Canada Market, By Application, 2013 - 2019 (USD MN)
Table 36 Canada Market, By Type, 2013 - 2019 (USD MN)
Table 37 Canada Direct Contact Weapons Market, By Type, 2013 - 2019 (USD MN)
Table 38 Canada Directed Energy Weapons Market, By Type, 2013 - 2019 (USD MN)
Table 39 Canada Personal Protective Equipment Market, By Type, 2013 - 2019 (USD MN)
Table 40 Canada Market, By Technology, 2013 - 2019 (USD MN)
Table 41 Non-Lethal Weapons Market: Company Share Analysis, 2014 (%)
Table 42 North America Non-Lethal Weapons Market: Contracts
Table 43 North America Non-Lethal Weapons Market: Expansions
Table 44 North America Non-Lethal Weapons Market: New Product Launches
Table 45 North America Non-Lethal Weapons Market: Joint Ventures
Table 46 Taser International, Inc.: Key Operations Data, 2009 - 2013 (USD MN)
Table 47 Taser International, Inc.: Key Financials, 2009 - 2013 (USD MN)
Table 48 Taser International, Inc.: Geographic Market Share, 2009 - 2013 (%)
Table 49 LRAD Corporation: Key Operations Data, 2010 - 2014 (USD MN)
Table 50 LRAD Corporation.: Key Financials, 2010 - 2014 (USD MN)
Table 51 LRAD Corporation: Geographic Market Share, 2013 - 2014 (%)
Table 52 Raytheon Company: Key Operations Data, 2009 - 2013 (USD MN)
Table 53 Raytheon Company: Key Financials, 2009 - 2013 (USD MN)
Table 54 Raytheon Company: Geographic Market Share, 2009 - 2013 (%)
List of Figures (47 Figures)
Figure 1 North America Non-Lethal Weapons Market: Segmentation & Coverage
Figure 2 Non-Lethal Weapons Market: Integrated Ecosystem
Figure 3 Research Methodology
Figure 4 Top-Down Approach
Figure 5 Bottom-Up Approach
Figure 6 Demand-Side Approach
Figure 7 Macro Indicator-Based Approach
Figure 8 North America Non-Lethal Weapons MarketMarket Snapshot
Figure 9 Non-Lethal Weapons Market: Growth Aspects
Figure 10 North American Market, By Application, 2014 Vs 2019 (USD MN)
Figure 11 North America Non-Lethal Weapon Technology, By Geography, 2014 (USD MN)
Figure 12 North American Non-Lethal Weapon, By Type, 2014 (USD MN)
Figure 13 North American Market: Growth Analysis, By Type, 2014 - 2019 (%)
Figure 14 North American Market, By Application, 2014 - 2019 (USD MN)
Figure 15 North American Market for Police Forces, By Geography, 2013 - 2019 (USD MN)
Figure 16 North American Market for Special Forces, By Geography, 2013 - 2019 (USD MN)
Figure 17 North America Non-Lethal Weapons Market Market for First Responders, By Geography, 2013 - 2019 (USD MN)
Figure 18 Sneak View: North American Market, 2014 (USD MN)
Figure 19 North American Market, By Type, 2014 - 2019 (USD MN)
Figure 20 North American Direct Contact Weapons Market, By Type, 2013 - 2019 (USD MN)
Figure 21 North American Directed Energy Weapons, By Type, 2013 - 2019 (USD MN)
Figure 22 North America Personal Protective Equipment Market, By Type, 2013 - 2019 (USD MN)
Figure 23 North American Direct Contact Weapons Market, By Geography, 2013 - 2019 (USD MN)
Figure 24 North American Directed Energy Weapons Market, By Geography, 2013 - 2019 (USD MN)
Figure 25 North American Personal Protective Equipment Market, By Geography, 2013 - 2019 (USD MN)
Figure 26 North American Surveillance Systems Market, By Geography, 2013 - 2019 (USD MN)
Figure 27 North American Non-Lethal Weapons Market, By Technology, 2013 - 2019 (USD MN)
Figure 28 North American Electromagnetic & Sonic Weapons Market, By Geography, 2013 - 2019 (USD MN)
Figure 29 North American Kinetic Impact Weapons Market, By Geography, 2013 - 2019 (USD MN)
Figure 30 North American Chemical Agents Market, By Geography, 2013 - 2019 (USD MN)
Figure 31 North American Non-Lethal Weapons Market: Growth Analysis, By Geography, 2014 - 2019 (USD MN)
Figure 32 U.S. Market Overview, 2014 & 2019 (%)
Figure 33 U.S. Market, By Application, 2013 - 2019 (USD MN)
Figure 34 U.S. Market: Application Snapshot
Figure 35 U.S. Non-Lethal Weapons Market, By Type, 2013 - 2019 (USD MN)
Figure 36 U.S. Market Share, By Type, 2014 - 2019 (Usd)
Figure 37 Canada Non-Lethal Weapons Market Overview, 2014 & 2019 (%)
Figure 38 Canada Market, By Application, 2013 - 2019 (USD MN)
Figure 39 Canada Market: Application Snapshot
Figure 40 Canada Market, By Type, 2013 - 2019 (USD MN)
Figure 41 Canada Market Share, By Type, 2014 - 2019 ( Usd)
Figure 42 Non-Lethal Weapons Market: Company Share Analysis, 2014 (%)
Figure 43 Non-Lethal Weapons: Company Product Coverage, By Type, 2014
Figure 44 Taser International, Inc.: Revenue Mix, 2013 (%)
Figure 45 Contribution of Non-Lethal Weapons Towards Company Revenue, 2009 - 2013 (USD MN)
Figure 46 LRAD Corporation Revenue Mix, 2014 (%)
Figure 47 Raytheon Company, Revenue Mix, 2013 (%)
The uncertain economic circumstances, complex political situations, and weakening security conditions across the globe have given rise to unrest and protests. Armed forces and law enforcement officers are increasingly called upon to deal with internal and external threats and it is imperative that they are well-equipped to handle these scenarios. Non-lethal weapons provide the perfect solution here as they help in managing the situations effectively without any lethal impact on the people.
Armed forces increasingly operate in urban terrains, where they have to deal with criminals and anti-social people and groups that live among the civilian population. In addition, law enforcement officers often have to deal with uncontrollable mobs and transnational threats. Such circumstances emphasize the need for non-lethal weapons which minimize the risk of injury by using lethal force.
Non-lethal weapons are specially designed and employed to incapacitate an individual or vehicle while reducing injury to personnel and damage to property and surrounding. They are broadly classified into counter-personnel and counter-material capabilities, which are used for controlling crowds and for stopping vehicles respectively. They provide flexible alternatives to the challenge that law enforcement officers or soldiers face. Some missions where they prove to be effective are patrols, checkpoints, crowd control, convoys, and vessel stopping.
The North America non-lethal weapons market was valued at $2,125.6 million in 2014, and is projected to reach $2,805.6 million by the end of 2019, at a CAGR of 5.7% during the forecast period. The market, by applications, was led by police forces in 2014 with a share of 87.0%. The market for offensive weapons is projected to reach $2,314.4 million in 2019, at a CAGR of 6.0%. The directed energy weapons market is estimated to grow at the highest CAGR of 6.7% by 2019. The U.S. is the leading market among all countries in North America for non-lethal weapons.
Leading players in North American market for non-lethal weapons include NonLethal Technologies, Inc., TASER International, Inc., Lamperd less Lethal Inc., LRAD Corporation, and others.
Please visit https://www.micromarketmonitor.com/custom-research-services.html to specify your custom Research Requirement


