

North America Food and Beverages Stabilizers and Systems Market by Application (Bakery, Confectionery, Dairy, Sauces, Dressing, Meat, Poultry, Convenience, Beverages) by Function (Stability, Texture, Moisture Retention) - North America Forecasts to 2019
- Publish Date: Apr 2015


The North America food and beverages stabilizers and systems market is projected to grow at a CAGR of 4.3% from 2014 to 2019. Food stabilizer blends are used in a wide range of products applications such as bakery, meat, convenience food, ice-creams, canned and packed food, confectionery, dairy, and beverages.
Food stabilizer bends perform various functions in food preparations. These include product stability, thermal stability, softness, and moisture retention. Stabilizer blends that comprise hydrocolloid blends and other ingredients, such as emulsifiers, are essential for stability of food products and are offered as systems by food ingredient manufactures. Other functions delivered by the food stabilizers blends include enhanced mouthfeel, prevention of ice crystallization, and egg replacement.
The North America food and beverages stabilizers and systems market is dominated by the U.S., followed by Canada and Mexico. The U.S. market has been steadily progressing due to changing consumer lifestyles and food habits. The demand for natural food ingredients influences the ingredient buying behavior of key food & beverage manufacturers in the market. The potential demand for stabilizer blends is further driven by the food service industries.
The North America food and beverages stabilizers and systems market is competitive, with firms such as Tate & Lyle (U.K.), Cargill Inc. (U.S.), DuPont (U.S.), Kerry (Ireland), Archer Daniels Midland Company (U.S.), and Nexira (France) among others, which are expanding their market share. To gain larger market shares, these companies are adopting numerous strategies such as innovative product development, partnerships, mergers & acquisitions, and expansion of existing facilities. Apart from these companies, there are large numbers of small firms present in the North American market.
Scope of the Report
This research report categorizes the North America food and beverages stabilizers and systems market into the following segments and sub-segments:
North America Food and Beverages Stabilizers & Systems Market, by Applications
- Bakery
- Confectionery
- Dairy & Dairy Products
- Sauces & Dressing
- Meat & Poultry
- Convenience Foods
- Beverages
North America Food and Beverages Stabilizers & Systems Market, by Function
- Stability
- Texture
- Moisture Retention
North America Food and Beverages Stabilizers & Systems Market, by Geography
- U.S.
- Canada
- Mexico
Table of Contents
1 Introduction (Page No. - 13)
1.1 Objectives of the Study
1.2 Market Segmentation & Coverage
1.3 Stakeholders
2 Research Methodology (Page No. - 15)
2.1 Integrated Ecosystem of Food & Beverage Stabilizers and Systems Market
2.2 Arriving at the Food & Beverage Stabilizers and Systems Market Size
2.2.1 Top-Down Approach
2.2.2 Bottom-Up Approach
2.2.3 Macro Indicator-Based Approach
2.3 Assumptions
3 Executive Summary (Page No. - 23)
4 North America food and beverages stabilizers & systems Market Overview (Page No. - 25)
4.1 Introduction
4.2 North America Food and Beverages Stabilizers and Systems Market: Comparison With Parent Market
4.3 Market Drivers and Inhibitors
4.4 Key Market Dynamics
4.5 Demand-Side Analysis
5 North America Food and Beverages Stabilizers & Systems Market, By Application (Page No. - 36)
5.1 Introduction
5.2 North America Food and Beverages Stabilizers and Systems in Dairy Products, By Geography
5.3 North America Food and Beverages Stabilizers and Systems in Confectionery, By Geography
5.4 North America Food and Beverages Stabilizers and Systems in Convenience Food, By Geography
5.5 North America Food and Beverages Stabilizers and Systems in Bakery,By Geography
5.6 North America Food & Beverages Stabilizers and Systems in Meat & Meat Products, By Geography
5.7 North America Food and Beverages Stabilizers and Systems in Beverages,By Geography
5.8 North America Food and Beverages Stabilizers and Systems in Sauces, Dressings & Condiments, By Geography
6 North America Food and Beverages Stabilizers & Systems Market, By Function (Page No. - 51)
6.1 Introduction
6.2 North America Food and Beverages Stabilizers and Systems Market, Functions Comparison With Food Ingredients Market
6.3 North America Texture Function Market, By Geography
6.4 North America Stability Function Market, By Geography,2013 - 2019 (USD MN)
6.5 North America Moisture Retention Function Market, By Geography
6.6 Sneak View: North America Food Ingredients Market, By Function
7 North America Food & Beverage Stabilizers & Systems Market, By Geography (Page No. - 59)
7.1 Introduction
7.2 U.S. Food & Beverage Stabilizers and Systems Market
7.2.1 U.S. Food & Beverage Stabilizers and Systems Market, By Application
7.2.2 U.S. Food & Beverage Stabilizers and Systems Market, By Function
7.3 Canada Food & Beverage Stabilizers and Systems Market
7.3.1 Canada Food & Beverage Stabilizers and Systems Market, By Application
7.3.2 Canada Food & Beverage Stabilizers and Systems Market, By Function
7.4 Mexico Food & Beverage Stabilizers and Systems Market
7.4.1 Mexico Food & Beverage Stabilizers and Systems Market,By Application
7.4.2 Mexico Food & Beverage Stabilizers and Systems Market, By Function
8 North America Food & Beverages Stabilizers and Systems Market: Competitive Landscape (Page No. - 77)
8.1 Food & Beverage Stabilizers and Systems Market: Company Share Analysis
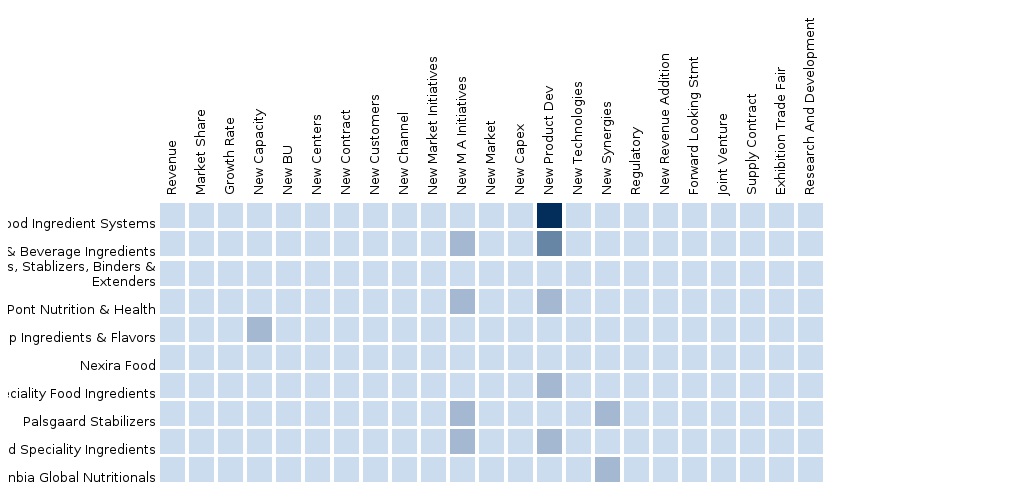
8.2 Company Presence in Food & Beverage Stabilizers and Systems Market,By Function
8.3 Mergers & Acquisitions
8.4 Expansions
8.5 Joint Ventures
8.6 New Product Launches
9 North America Food and Beverages Stabilizers & Systems Market,By Company (Page No. - 82)
(Overview, Financials, Products & Services, Strategy, and Developments)*
9.1 Tate & Lyle PLC.
9.2 Kerry Group PLC
9.3 E.I. Du Pont De Nemours and Company
9.4 Cargill Incorporated.
9.5 Nexira
9.6 Archer Daniels Midland Company (ADM)
*Details on Overview, Financials, Product & Services, Strategy, and Developments Might Not be Captured in Case of Unlisted Company
10 Appendix (Page No. - 98)
10.1 Customization Options
10.1.1 Technical Analysis
10.1.2 Low-Cost Sourcing Locations
10.1.3 Regulatory Framework
10.1.4 Impact Analysis
10.1.5 Trade Analysis
10.1.6 Historical Data and Trends
10.2 Related Reports
10.3 Introducing RT: Real Time Market Intelligence
10.3.1 RT Snapshots
List of Tables (56 Tables)
Table 1 Global Food & Beverage Stabilizers and Systems Peer Market Size,2014 (USD MN)
Table 2 North America Food and Beverages Stabilizers and Systems Market: Macro Indicators, By Population, 2014 (Thousands)
Table 3 North America Food and Beverages Stabilizers & Systems Market: Comparison With Parent Market, 2013 – 2019 (USD MN)
Table 4 North America Food and Beverages Stabilizers & Systems Market: Comparison With Parent Market, 2013 – 2019 (MT)
Table 5 North America Food and Beverages Stabilizers & Systems Market: Drivers and Inhibitors
Table 6 North America Food and Beverages Stabilizers & Systems Market,By Application, 2013 - 2019 (USD MN)
Table 7 North America Food and Beverages Stabilizers & Systems Market,By Application, 2013 - 2019 (MT)
Table 8 North America Food and Beverages Stabilizers & Systems Market,By Function, 2013 - 2019 (USD MN)
Table 9 North America Food and Beverage Stabilizers & Systems Market,By Function, 2013 - 2019 (MT)
Table 10 North America Food and Beverage Stabilizers & Systems Market,By Geography, 2013 - 2019 (USD MN)
Table 11 North America Food and Beverage Stabilizers and Systems Market,By Geography, 2013 - 2019 (MT)
Table 12 North America Food and Beverage Stabilizers Market: Comparison With Application Markets, 2013 - 2019(USD MN)
Table 13 North America Food and Beverage Stabilizers and Systems Market,By Application, 2013 - 2019 (USD MN)
Table 14 North America Food & Beverage Stabilizers and Systems Market,By Application, 2013 - 2019 (MT)
Table 15 North America Food & Beverage Stabilizers and Systems in Dairy Products, By Geography, 2013 - 2019 (USD MN)
Table 16 North America Food & Beverage Stabilizers and Systems in Dairy Products, By Geography, 2013 - 2019 (MT)
Table 17 North America Food & Beverage Stabilizers and Systems in Confectionery, 2013 - 2019 (USD MN)
Table 18 North America Food & Beverage Stabilizers and Systems in Confectionery, By Geography, 2013 - 2019 (MT)
Table 19 North America Food & Beverage Stabilizers and Systems in Convenience Food, By Geography, 2013 - 2019 (USD MN)
Table 20 North America Food & Beverage Stabilizers and Systems in Convenience Food, By Geography, 2013 - 2019 (MT)
Table 21 North America Food & Beverage Stabilizers and Systems in Bakery,By Geography, 2013 - 2019 (USD MN)
Table 22 North America Food & Beverage Stabilizers and Systems in Bakery,By Geography, 2013 - 2019 (MT)
Table 23 North America Food & Beverage Stabilizers and Systems in Meat & Meat Products, By Geography, 2013 - 2019 (USD MN)
Table 24 North America Food & Beverage Stabilizers and Systems in Meat & Meat Products, By Geography, 2013 - 2019 (MT)
Table 25 North America Food & Beverage Stabilizers and Systems in Beverages,By Geography, 2013 - 2019 (USD MN)
Table 26 North America Food & Beverage Stabilizers and Systems in Beverages,By Geography, 2013 - 2019 (MT)
Table 27 North America Food & Beverage Stabilizers and Systems in Sauces, Dressings & Condiments, 2013 - 2019 (USD MN)
Table 28 North America Food & Beverage Stabilizers and Systems in Sauces, Dressings & Condiments, By Geography, 2013 - 2019 (MT)
Table 29 North America Food & Beverage Stabilizers and Systems Market,By Function, 2013 - 2019 (USD MN)
Table 30 North America Food & Beverage Stabilizers and Systems Market,By Function, 2013 - 2019 (MT)
Table 31 North America Food & Beverage Stabilizers and Systems Market: Functions Comparison With Parent Market, 2013 – 2019 (USD MN)
Table 32 North America Texture Function Market, By Geography,2013 – 2019 (USD MN)
Table 33 North America Stability Function Market, By Geography,2013 - 2019 (USD MN)
Table 34 North America Moisture Retention Function, By Geography,2013 - 2019 (USD MN)
Table 35 North America Food & Beverage Stabilizers and Systems Market,By Country, 2013 – 2019 (USD MN)
Table 36 North America Food & Beverage Stabilizers and Systems Market,By Country, 2013 – 2019 (MT)
Table 37 U.S. Food & Beverage Stabilizers and Systems Market, By Application,2013 – 2019 (USD MN)
Table 38 U.S. Food & Beverage Stabilizers and Systems Market, By Application,2013 – 2019 (MT)
Table 39 U.S. Food & Beverage Stabilizers and Systems Market, By Function,2013 – 2019 (USD MN)
Table 40 Canada Food & Beverage Stabilizers and Systems Market, By Application, 2013 – 2019 (USD MN)
Table 41 Canada Food & Beverage Stabilizers and Systems Market, By Application, 2013 – 2019 (MT)
Table 42 Canada Food & Beverage Stabilizers and Systems Market, By Function, 2013 – 2019 (USD MN)
Table 43 Mexico Food & Beverage Stabilizers and Systems Market, By Application, 2013 – 2019 (USD MN)
Table 44 Mexico Food & Beverage Stabilizers and Systems Market, By Application, 2013 – 2019 (MT)
Table 45 Mexico Food & Beverage Stabilizers and Systems Market, By Function,2013 – 2019 (USD MN)
Table 46 Food & Beverage Stabilizers and Systems Market: Company Share Analysis, 2014
Table 47 Mergers & Acquisitions
Table 48 Expansions
Table 49 Joint Ventures
Table 50 Expansions/ New Product Launches
Table 51 Tate & Lyle Plc: Key Operations, 2009 - 2013 (USD MN)
Table 52 Tate & Lyle Plc: Key Financials, 2009 - 2013 (USD MN)
Table 53 Kerry Group PLC. : Key Financials, 2009 - 2013 (USD MN)
Table 54 E.I. Du Pont De Nemours and Company: Key Financials, 2009 - 2013 (USD MN)
Table 55 Cargill Incorporated: Key Financials, 2010 - 2014 (USD MN)
Table 56 Archer Daniel Midland Company (ADM): Key Financials, 2009 - 2013 (USD MN)
List of Figures (50 Figures)
Figure 1 North America Food & Beverage Stabilizers and Systems Market: Segmentation and Coverage
Figure 2 Food & Beverage Stabilizers and Systems Market: Integrated Ecosystem
Figure 3 Research Methodology
Figure 4 Top-Down Approach
Figure 5 Bottom-Up Approach
Figure 6 Macro Indicator-Based Approach
Figure 7 North America Food & Beverage Stabilizers and Systems Market Snapshot (2014)
Figure 8 Food & Beverage Stabilizer & Systems Market: Growth Aspects
Figure 9 North America Food & Beverage Stabilizers and Systems Market,By Application, 2014 vs 2019
Figure 10 North America Food & Beverage Stabilizers and Systems Function,By Geography, 2014 (USD MN)
Figure 11 North America Food & Beverages Stabilizers Market: Growth Analysis,By Function, 2014–2019 (%)
Figure 12 Food & Beverage Stabilizers and Systems: Application Market Scenario
Figure 13 North America Food & Beverage Stabilizers and Systems Market,By Application, 2014 - 2019 (USD MN)
Figure 14 North America Food & Beverage Stabilizers and Systems Market,By Application, 2014 - 2019 (MT)
Figure 15 North America Food & Beverage Stabilizers and Systems Market in Dairy Products, By Geography, 2013 - 2019 (USD MN)
Figure 16 North America Food & Beverage Stabilizers and Systems Market in Confectionery, By Geography, 2013 - 2019 (USD MN)
Figure 17 North America Food & Beverage Stabilizers and Systems Market in Convenience Food, By Geography, 2013 - 2019 (USD MN)
Figure 18 North America Food & Beverage Stabilizers and Systems Market in Bakery, By Geography, 2013 - 2019 (USD MN)
Figure 19 North America Food & Beverage Stabilizers and Systems Market in Meat & Meat Products, By Geography, 2013 - 2019 (USD MN)
Figure 20 North America Food & Beverage Stabilizers and Systems Market in Beverages, By Geography, 2013 - 2019 (USD MN)
Figure 21 North America Food & Beverage Stabilizers and Systems Market in Sauces, Dressings & Condiments, By Geography, 2013 - 2019 (USD MN)
Figure 22 North America Food & Beverage Stabilizers and Systems Market,By Function, 2014 - 2019 (USD MN)
Figure 23 North America Food & Beverage Stabilizers and Systems Market,By Function, 2014 & 2019 (MT)
Figure 24 North America Food & Beverage Stabilizers and Systems Market: Functions Comparison With Food Ingredients Market, 2013 – 2019 (USD MN)
Figure 25 North America Texture Function Market, By Geography,2013 – 2019 (USD MN)
Figure 26 North America Moisture Retention Function Market, By Geography,2013 - 2019 (USD MN)
Figure 27 North America Food & Beverage Stabilizers and Systems Market: Growth Analysis, By Geography, 2014 – 2019 (USD MN)
Figure 28 North America Food & Beverage Stabilizers and Systems Market: Growth Analysis,By Geography, 2014 – 2019 (MT)
Figure 29 U.S. Food & Beverage Stabilizers and Systems Market Overview, 2014 & 2019
Figure 30 U.S. Food & Beverage Stabilizers and Systems Market, By Application,2013 – 2019 (USD MN)
Figure 31 U.S. Food & Beverage Stabilizers and Systems Market: Application Snapshot (USD MN)
Figure 32 U.S. Food & Beverage Stabilizers and Systems Market, By Function,2013 – 2019 (USD MN)
Figure 33 U.S. Food & Beverage Stabilizers and Systems Market Share, By Function, 2014 & 2019
Figure 34 Canada Food & Beverage Stabilizers and Systems Market Overview,2014 & 2019
Figure 35 Canada Food & Beverage Stabilizers and Systems Market, By Application, 2013 – 2019 (USD MN)
Figure 36 Canada Food & Beverage Stabilizers and Systems Market: Application Snapshot
Figure 37 Canada Food & Beverage Stabilizers and Systems Market, By Function, 2013 – 2019 (USD MN)
Figure 38 Canada Food & Beverage Stabilizers and Systems Market Share, By Function, 2014 & 2019
Figure 39 Mexico Food & Beverage Stabilizers and Systems Market Overview,2014 & 2019
Figure 40 Mexico Food & Beverage Stabilizers and Systems Market, By Application, 2013 – 2019 (USD MN)
Figure 41 Mexico Food & Beverage Stabilizers and Systems Market: Application Snapshot
Figure 42 Mexico Food & Beverage Stabilizers and Systems Market, By Function,2013 – 2019 (USD MN)
Figure 43 Mexico Food & Beverage Stabilizers and Systems Market: Function Snapshot
Figure 44 Food & Beverage Stabilizers and Systems Market: Company Share Analysis, 2014
Figure 45 Food & Beverage Stabilizers and Systems: Company Product Coverage,By Function, 2014
Figure 46 Tate & Lyle Plc: Revenue Mix, 2013 (%)
Figure 47 Kerry Group Plc: Revenue Mix, 2013 (%)
Figure 48 E.I. Du Pont De Nemours and Company, Revenue Mix, 2013 (%)
Figure 49 Cargill Incorporated: Revenue Mix, 2013 (%)
Figure 50 Archer Daniels Midland Company (ADM): Revenue Mix, 2013 (%)
The North American food & beverage stabilizers & systems market is projected to grow at a CAGR of 4.3%from 2014 to 2019. In 2014, the North American market was dominated by a large number of small players. Tate & Lyle (U.K.) leads the North American market with a share of 6.66%. It operates through two business segments: specialty food ingredients and bulk ingredients. Cargill Inc., America’s largest private company, is a major competitor of Tate & Lyle in the North American food & beverage stabilizers & systems market. It offers food functional systems that impart stability, texture, and soon to food products.
The food & beverage stabilizers & systems market in the U.S. is expected to grow at the highest CAGR in the next five years. The change in lifestyle has brought about changes in food habits in the U.S., so people prefer convenience food over traditional functional food. Convenience food is any packaged food, dish, or meal that can be prepared quickly and easily by thawing or heating. These products need very little preparation time as they are already pre-prepared and preserved for long-term storage. Convenience foods include ready-to-eat, canned food, frozen food, and beverages.
Dairy and confectionery are promising segments and constitute more than 40.00% of the North American food & beverage stabilizers & systems market. By function, the texture segment is largest, and has a market share of more than 40.00%. It is projected to grow at eh highest CAGR, by function.
Please visit https://www.micromarketmonitor.com/custom-research-services.html to specify your custom Research Requirement


