

North America Enterprise Collaboration Market Research Report
- Publish Date: Upcoming


The North American enterprise collaboration market is estimated to grow from $23.81 billion in 2013 to $33.90 billion by 2018, at a CAGR of 7.32%, for the given period. The North American market is primarily driven by the cloud market.
Enterprise collaboration is a method to communicate with other employees, and includes use of enterprise social networking tools, corporate intranet, public internet, and collaboration platforms. Enterprise collaboration helps employee share information across various geographical locations through the combination of software and network capabilities.
In the current scenario, information sharing is carried out using mobile phones, video conferencing, instant messenger, and various others that deliver information within stipulated time duration. With collaborative communication, the congestion overload is reduced to a significant amount, thus providing ease of communication. For better communication, companies are making every effort to have cloud and collaboration technology mutually available.
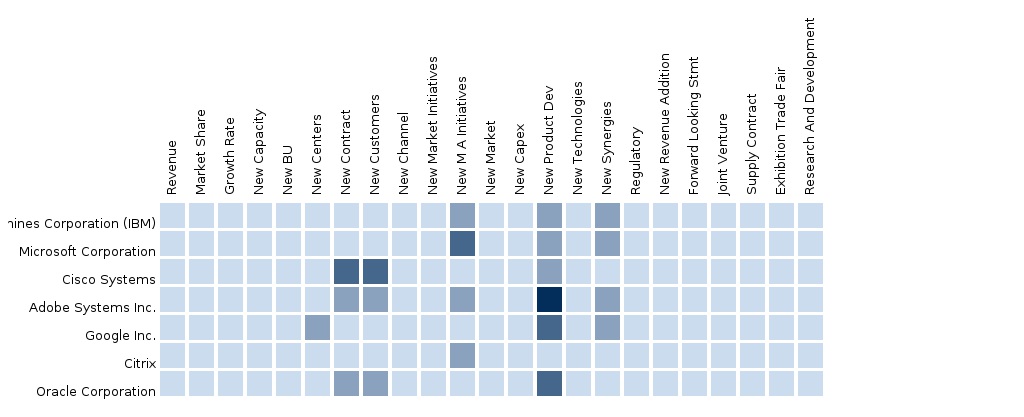
The market report provides a competitive benchmarking of the leading players in this market such as IBM, Cisco, Google, Microsoft, and Adobe. The report gives financial analysis, which includes CAGR and market shares of the different regions, vendors, overall adoption scenario, competitive landscape, key drivers, restraints, and opportunities.
Report Options:
The enterprise collaboration market segmentation covered in this report includes:
- By Solution: Telephony, unified messaging, conferencing, collaborative platforms and applications, and enterprise social networks
- By Services: Professionals and support services, and consulting services
- By Deployment Type: On-Premise and On-Demand
- By Types of End-Users: Small and medium businesses (SMBs) and enterprises
- By Industry verticals: BFSI, business services, IT and telecom, manufacturing, retail and wholesale, healthcare, and government, among others
Customization Options:
Along with the MMM assessment, customize the report in alignment with your company’s specific needs. Customize to obtain a comprehensive summary of the industry standards and a deep dive analysis of the following parameters:
Enterprise Collaboration Market Solutions Matrix and Key Recommendations:
- A comprehensive analysis and benchmarking by solution, by services, by deployment type, by type of users, and by industry verticals
- To evaluate current usage, expected adoption, and preferences surrounding collaboration technologies and services
- Recommendations on which collaborative service to use to drive better business results
- An impact analysis on enterprise social software, mobile, and SaaS/cloud computing on traditional collaborative applications
Enterprise Collaboration Market Competitive Benchmarking:
- Collaboration and social solutions examination strategies, market positioning, and potential path of a number of providers and social software, together with IBM, Cisco, Google, Microsoft, Acitance, and Adobe
- Value-chain evaluation using events, developments, market data for vendors in the market ecosystem, across various industrial verticals, market segmentation, and categorization
- To uncover hidden opportunities by connecting related markets using cascaded value chain analysis
Enterprise Collaboration Market Vendor Landscaping:
- Vendor market watch and predictions, vendor market shares and offerings, categorization of adoption trends and market dominance (leaders, challengers, and followers)
Enterprise Collaboration Market Data Tracker:
- Regional and country-specific market forecast and analysis
- The identification of key end-user segments, by country
Enterprise Collaboration Market Vertical Analysis:
- An analysis of different industrial verticals by solution, by services, by deployment type, by type of users, and by industry verticals
Enterprise Collaboration Market Emerging Vendor Landscape:
- To evaluate Tier-2/3 vendors’ market offerings using a 2X2 framework (realizing leaders, challengers, and followers)
Enterprise Collaboration Market Channel Analysis:
- An analysis of channel/distribution partners/alliances for tier-1 vendors and application-specific products being build towards the customer end of value chain
Enterprise Collaboration Market Client Tracker
- The listing and analysis of deals, case studies, R&D investments, events, discussion forums, campaigns, alliances and partners of tier-1 and tier-2/3 vendors for the last 3 years
1 Introduction
1.1 Key Take-aways
1.2 Report Description
1.3 Markets Covered
1.4 Stakeholders
1.5 Research Methodology
1.5.1 Key Data Points
1.5.2 Data Triangulation and Market Forecasting
1.6 Forecast Assumptions
2 Executive Summary
2.1 Abstract
2.2 Overall Market Size
3 NA Enterprise Collaboration: Market Overview
3.1 Market Definition
3.2 Market Evolution
3.3 Market Segmentation
3.4 Market Dynamics
3.4.1 Drivers
3.4.2 Restraints and Challenges
3.4.3 Opportunities
3.4.4 Impact Analysis of DRO
3.5 Value Chain
3.6 Enterprise Collaboration Elements
3.6.1 Communication
3.6.2 Coordination
3.6.3 Standards and Processes
3.6.4 Technology
3.6.5 Policy and Governance
3.7 Enterprise Collaboration Framework
3.7.1 Structuring Business Process Model
3.7.2 Directions and Guidelines For Enterprise Collaboration
3.7.3 Evaluation
3.8 Enterprise Collaboration Types
3.8.1 Process Oriented Solutions
3.8.2 People Oriented Solutions
3.9 Collaboration As A Service (Caas)
4 NA Enterprise Collaboration: Market Size and Forecast By Solutions
4.1 Introduction
4.2 Telephony
4.2.1 Overview
4.2.2 Market Size and Forecast
4.2.2.1 Market Size and Forecast By Verticals
4.2.2.2 Market Size and Forecast By Users
4.3 Unified Messaging
4.3.1 Overview
4.3.2 Market Size and Forecast
4.3.2.1 Market Size and Forecast By Verticals
4.3.2.2 Market Size and Forecast By Users
4.4 Conferencing
4.4.1 Overview
4.4.2 Market Size and Forecast
4.4.2.1 Market Size and Forecast By Verticals
4.4.2.2 Market Size and Forecast By Users
4.5 Collaborative Platforms and Applications
4.5.1 Overview
4.5.2 Market Size and Forecast
4.5.2.1 Market Size and Forecast By Verticals
4.5.2.2 Market Size and Forecast By Users
4.6 Enterprise Social Networks
4.6.1 Overview
4.6.2 Market Size and Forecast
4.6.2.1 Market Size and Forecast By Verticals
4.6.2.2 Market Size and Forecast By Users
5 NA Enterprise Collaboration: Market Size and Forecast By Services
5.1 Introduction
5.2 Professional and Support Services
5.2.1 Overview
5.2.2 Market Size and Forecast
5.2.2.1 Market Size and Forecast By Verticals
5.2.2.2 Market Size and Forecast By Users
5.3 Consulting Services
5.3.1 Overview
5.3.2 Market Size and Forecast
5.3.2.1 Market Size and Forecast By Verticals
5.3.2.2 Market Size and Forecast By Users
6 NA Enterprise Collaboration: Market Size and Forecast By Deployment Types
6.1 Introduction
6.2 On-Premise
6.2.1 Overview
6.2.2 Market Size and Forecast
6.2.2.1 Market Size and Forecast By Verticals
6.2.2.2 Market Size and Forecast By Countries
6.3 On-Demand
6.3.1 Overview
6.3.2 Market Size and Forecast
6.3.2.1 Market Size and Forecast By Verticals
6.3.2.2 Market Size and Forecast By Countries
7 NA Enterprise Collaboration: Market Size and Forecast By Users
7.1 Introduction
7.2 Small and Medium Enterprises
7.2.1 Overview
7.2.2 Market Size and Forecast
7.2.2.1 Market Size and Forecast By Verticals
7.2.2.2 Market Size and Forecast By Countries
7.3 Large Enterprise
7.3.1 Overview
7.3.2 Market Size and Forecast
7.3.2.1 Market Size and Forecast By Verticals
7.3.2.2 Market Size and Forecast By Countries
8 NA Enterprise Collaboration: Market Size and Forecast By Verticals
8.1 Introduction
8.2 Banking, Financial Services and Insurance (BFSI)
8.2.1 Overview
8.2.2 Market Size and Forecast
8.2.2.1 Market Size and Forecast By Countries
8.3 Business Services
8.3.1 Overview
8.3.2 Market Size and Forecast
8.3.2.1 Market Size and Forecast By Countries
8.4 IT and Telecom
8.4.1 Overview
8.4.2 Market Size and Forecast
8.4.2.1 Market Size and Forecast By Countries
8.5 Manufacturing
8.5.1 Overview
8.5.2 Market Size and Forecast
8.5.2.1 Market Size and Forecast By Countries
8.6 Retail and Wholesale
8.6.1 Overview
8.6.2 Market Size and Forecast
8.6.2.1 Market Size and Forecast By Countries
8.7 Healthcare
8.7.1 Overview
8.7.2 Market Size and Forecast
8.7.2.1 Market Size and Forecast By Countries
8.8 Government
8.8.1 Overview
8.8.2 Market Size and Forecast
8.8.2.1 Market Size and Forecast By Countries
8.9 Others
8.9.1 Overview
8.9.2 Market Size and Forecast
8.9.2.1 Market Size and Forecast By Countries
9 NA Enterprise Collaboration: Market Size and Forecast By Countries
9.1 Introduction
9.1.1 Parfait Charts
9.2 U.S.
9.2.1 Overview
9.2.2 Market Size and Forecast
9.2.2.1 Market Size and Forecast By Solutions
9.2.2.2 Market Size and Forecast By Services
9.3 Canada
9.3.1 Overview
9.3.2 Market Size and Forecast
9.3.2.1 Market Size and Forecast By Solutions
9.3.2.2 Market Size and Forecast By Services
9.4 Mexico
9.4.1 Overview
9.4.2 Market Size and Forecast
9.4.2.1 Market Size and Forecast By Solutions
9.5 Rest of NA
9.5.1 Overview
9.5.2 Market Size and Forecast
9.5.2.1 Market Size and Forecast By Solutions
9.5.2.2 Market Size and Forecast By Services
10 NA Enterprise Collaboration: Market Landscape
10.1 Competitive Landscape
10.1.1 Ecosystem and Roles
10.1.2 Portfolio Comparison
10.1.2.1 Overview
10.1.2.2 Product Category Mapping
10.2 End-User Landscape
10.2.1 Market Opportunity Analysis
10.2.2 End-User Analysis
10.2.2.1 Global Mobile Data Traffic to Grow At A Cagr of 40.31% in the Next Five Years
10.2.2.2 Global Smartphones Are Expected to Hold More Than 70% of the total Handset Market By 2018
10.2.2.3 Global Internet Speed Has Grown By 12 Percent Worldwide
11 Company Profile (MMM View, Overview, Products & Services, Strategy & Analyst Insights, Developments)
11.1 Adobe Systems
11.2 Cisco Systems, Inc.
11.3 Citrix
11.4 Google
11.5 Ibm
11.6 Jive Software
11.7 Microsoft
11.8 Novell
11.9 Open Text Corporation
11.10 Oracle
Appendix
Mergers and Acquisitions (M&A)
Venture Capital
List of Tables
Table 1 NA Enterprise Collaboration: Market Size, 2014–2019 ($Billion)
Table 2 NA Enterprise Collaboration Solution Market Size, 2014-2019 ($Billion)
Table 3 NA Solution Market, By Types, 2014-2019, Y-O-Y (%)
Table 4 NA Enterprise Collaboration Telephony Solutions Market Size, By Verticals, 2014-2019 ($Billion)
Table 5 NA Telephony Solutions Market Size, By Verticals, 2014-2019, Y-O-Y (%)
Table 6 NA Telephony Solutions Market Size, By Users, 2014-2019 ($Billion)
Table 7 NA Telephony Solutions Market Size, By Users, 2014-2019, Y-O-Y (%)
Table 8 NA Unified Messaging Solutions Market, By Verticals, 2014-2019 ($Billion)
Table 9 NA Unified Messaging Solutions Market, By Verticals, 2014 -2019, Y-O-Y (%)
Table 10 NA Unified Messaging Solutions Market, By Users, 2014-2019 ($Billion)
Table 11 NA Unified Messaging Solutions Market, By Users, 2014-2019, Y-O-Y (%)
Table 12 NA Enterprise Collaboration Conferencing Solutions Market, By Verticals, 2014-2019 ($Billion)
Table 13 NA Conferencing Solutions Market, By Verticals, 2014-2019, Y-O-Y (%)
Table 14 NA Conferencing Solutions Market, By Users, 2014-2019 ($Billion)
Table 15 NA Conferencing Solutions Market, By Users, 2014-2019, Y-O-Y (%)
Table 16 NA Enterprise Collaboration Collaborative Platforms and Applications Market, By Verticals, 2014-2019 ($Billion)
Table 17 NA Collaborative Platforms and Applications Market, By Verticals, 2014-2019, Y-O-Y (%)
Table 18 NA Collaborative Platforms and Applications Market, By Users, 2014-2019 ($Billion)
Table 19 NA Collaborative Platforms and Applications Market, By Users, 2014 -2019, Y-O-Y (%)
Table 20 NA Enterprise Social Networks Market, By Verticals, 2014-2019 ($Billion)
Table 21 NA Enterprise Social Networks Market, By Verticals, 2014-2019, Y-O-Y (%)
Table 22 NA Enterprise Social Network Market, By Users, 2014 -2019 ($Billion)
Table 23 NA Enterprise Social Networks Market, By Users, 2014-2019, Y-O-Y (%)
Table 24 NA Enterprise Collaboration Services Market Size, By Types, 2014-2019 ($Billion)
Table 25 NA Services Market Size, 2014-2019, Y-O-Y (%)
Table 26 NA Professional and Support Service Market, By Verticals, 2014-2019 ($Billion)
Table 27 NA Professional and Support Service Market, By Verticals, 2014-2019, Y-O-Y (%)
Table 28 NA Professional and Support Service Market, By Users, 2014-2019 ($Billion)
Table 29 NA Professional and Support Service Market, By Users, 2014-2019, Y-O-Y (%)
Table 30 NA Consulting Service Market, By Verticals, 2014-2019 ($Billion)
Table 31 NA Consulting Service Market, By Verticals, 2014-2019, Y-O-Y (%)
Table 32 NA Consulting Service Market, By Users, 2014-2019 ($Billion)
Table 33 NA Consulting Service Market, By Users, 2014-2019, Y-O-Y (%)
Table 34 NA Enterprise Collaboration Deployment Type Market Size, 2014-2019 ($ Billion)
Table 35 NA Deployment Type Market Size, By Type, 2014-2019, Y-O-Y (%) By Verticals, 2014-2019 ($ Billion)
Table 36 NA On-Premise Deployment Market, By Verticals, 2014-2019, Y-O-Y (%)
Table 37 NA On-Premise Deployment Market, By Countries, 2014-2019 ($Billion)
Table 38 NA On-Premise Deployment Market, By Countries, 2014-2019, Y-O-Y (%)
Table 39 NA On-Demand Deployment Market, By Verticals, 2014-2019 ($Billion)
Table 40 NA On-Demand Deployment Market, By Verticals, 2014-2019, Y-O-Y (%)
Table 41 NA On-Demand Deployment Market, By Countries, 2014-2019 ($Billion)
Table 42 NA On-Demand Deployment Market, By Countries, 2014-2019, Y-O-Y (%)
Table 43 NA Enterprise Collaboration: Market, By End Users, 2014-2019 ($Billion)
Table 44 NA Market, By End Users, 2014-2019, Y-O-Y (%)
Table 45 NA Small and Medium Enterprises Market, By Verticals, 2014-2019 ($Billion)
Table 46 NA Small and Medium Enterprises Market, By Verticals, 2014-2019, Y-O-Y (%)
Table 47 NA Small and Medium Enterprises Market, By Countries, 2014-2019 ($Billion)
Table 48 NA Small and Medium Enterprises Market, By Countries, 2014-2019, Y-O-Y (%)
Table 49 NA Large Enterprise Market, By Verticals, 2014-2019 ($Billion)
Table 50 NA Large Enterprise Market, By Verticals, 2014-2019, Y-O-Y (%)
Table 50 NA Large Enterprise Market, By Countries, 2014-2019 ($Billion)
Table 52 NA Large Enterprise Market, By Countries, 2014-2019, Y-0-Y (%)
Table 53 NA Enterprise Collaboration Market, By Verticals, 2014-2019 ($Billion)
Table 54 NA Market, By Verticals, 2014-2019, Y-O-Y (%)
Table 55 NA BFSI Market, By Countries, 2014-2019 ($Billion)
Table 56 NA BFSI Market, By Countries, 2014-2019, Y-O-Y (%)
Table 57 NA Business Services Market, By Countries, 2014-2019 ($Billion)
Table 58 NA Business Services Market, By Countries, 2014-2019, Y-O-Y (%)
Table 59 NA Enterprise Collaboration IT and Telecom Market, By Countries, 2014-2019 ($Billion)
Table 60 NA IT and Telecom Market, By Countries, 2014-2019, Y-O-Y (%)
Table 61 NA Manufacturing Market, By Countries, 2014-2019 ($Billion)
Table 62 NA Manufacturing Market, By Countries, 2014-2019, Y-O-Y (%)
Table 63 NA Retail and Wholesale Market, By Countries, 2014-2019 ($Billion)
Table 64 NA Retail and Wholesale Market, By Countries, 2014-2019, Y-O-Y (%)
Table 65 NA Healthcare Market, By Countries, 2014-2019 ($Billion)
Table 66 NA Healthcare Market, By Countries, 2014-2019, Y-O-Y (%)
Table 67 NA Government Market, By Countries, 2014-2019 ($Billion)
Table 68 NA Government Market, By Countries, 2014-2019, Y-O-Y (%)
Table 69 NA Enterprise Collaboration Other Verticals Market, By Countries, 2014-2019 ($Billion)
Table 70 NA Other Verticals Market, By Countries, 2014-2019, Y-O-Y (%)
Table 71 NA Enterprise Collaboration: Market, By Countries, 2014-2019 ($Billion)
Table 72 NA Market, By Countries, 2014-2019, Y-O-Y (%)
Table 73 NA Enterprise Collaboration North America Market, By Solutions, 2014-2019 ($Billion)
Table 74 North America Market, By Solutions, 2014-2019, Y-O-Y (%)
Table 75 North America Market, By Services, 2014-2019 ($Billion)
Table 76 North America Market, By Services, 2014-2019, Y-O-Y (%)
List of Figures
Figure 1 Stakeholders
Figure 2 Research Methodology
Figure 3 Enterprise Collaboration: Market Growth, 2014–2019, ($Billion, Y-O-Y %)
Figure 4 Evolution
Figure 5 Market Segmentation
Figure 6 Impact Analysis of DRO
Figure 7 Value Chain
Figure 8 Framework
Figure 9 NA Enterprise Collaboration Solution Market, By Types, 2014-2019, Y-O-Y (%)
Figure 10 NA Telephony Solutions Market Size, 2014-2019 ($Billion, Y-O-Y %)
Figure 11 NA Unified Messaging Solutions Market Size, 2014-2019 ($Billion, Y-O-Y %)
Figure 12 NA Conferencing Solutions Market Size, 2014-2019 ($Billion, Y-O-Y %)
Figure 13 NA Collaborative Platforms and Applications Solutions Market Size, 2014-2019 ($Billion, Y-O-Y %)
Figure 14 NA Enterprise Social Networks Solutions Market Size, 2014 -2019 ($ Billion, Y-O-Y %)
Figure 15 NA Services Market Size, By Types, 2014-2019, Y-O-Y (%)
Figure 16 NA Professional Services Market Size, 2014-2019 ($Billion, Y-O-Y %)
Figure 17 NA Consulting Services Market Size, 2014-2019 ($Billion, Y-O-Y %)
Figure 18 NA Deployment Types Market Size, By Types, 2014-2019, Y-O-Y (%)
Figure 19 NA On-Premise Deployment Type, 2014-2019 ($ Billion, Y-O-Y %)
Figure 20 NA On-Demand Deployment Type, 2014-2019 ($Billion, Y-O-Y %)
Figure 21 NA Enterprise Collaboration Market, By End Users, 2014-2019, Y-O-Y (%)
Figure 22 NA Small and Medium Enterprises Market, 2014-2019 ($ Billion, Y-O-Y %)
Figure 23 NA Large Enterprise Market, 2014-2019 ($Billion, Y-O-Y %)
Figure 24 NA Enterprise Collaboration: Market, By Verticals, 2014-2019, Y-O-Y (%)
Figure 25 NA BFSI Market, 2014-2019 ($Billion, Y-O-Y %)
Figure 26 NA Business Service Market, 2014-2019 ($Billion, Y-O-Y %)
Figure 27 NA IT and Telecom Market, 2014-2019 ($Billion, Y-O-Y %)
Figure 28 NA Manufacturing Market, 2014-2019 ($Billion, Y-O-Y %)
Figure 29 NA Retail and Wholesale Market, 2014-2019 ($Billion, Y-O-Y %)
Figure 30 NA Healthcare Market, 2014-2019 ($Billion, Y-O-Y %)
Figure 31 NA Government Market, 2014-2019 ($Billion, Y-O-Y %)
Figure 32 NA Enterprise Collaboration Other Verticals Market, 2014-2019 ($Billion, Y-O-Y %)
Figure 33 NA Enterprise Collaboration: Market, By Countries, 2014-2019, Y-O-Y (%)
Figure 34 NA Parfait Chart
Figure 35 North America Market, 2014-2019 ($Billion, Y-O-Y %)
Figure 36 NA Ecosystem
Figure 37 NA Product Category Mapping
Figure 38 NA Market Opportunity Plot
Please fill in the form below to receive a free copy of the Summary of this Report
Please visit https://www.micromarketmonitor.com/custom-research-services.html to specify your custom Research Requirement


