

North America Communication Test and Measurement (CT&M) Market
- Publish Date: Upcoming


The North American communication test and measurement market is expected to grow from $1.43 billion in 2013 to $1.91 billion by 2018, at a CAGR of 6.0% during the forecast period. The market is primarily driven by the telecommunication industries and increased subscriptions of 2G, 3G, and 4G networks.
The communication test and measurement market has grown rapidly in the recent years. This growth is mainly attributed to the increased demand for networks, such as 2G, 3G, and 4G by subscribers, along with operators moving towards LTE technology, which is in turn influencing the overall demand of the communication test and measurement market. The communication test and measurement product helps network providers and broadband service providers to deliver high quality voice data and signals over mobile and fixed networks.
The demand for 4G connections in North America is expected to grow from nearly 80 million in 2013 to 667 million by 2018. This surge in this number of 4G connections will act as a driver for the market of wireless test equipment, test performance, and network management solutions.
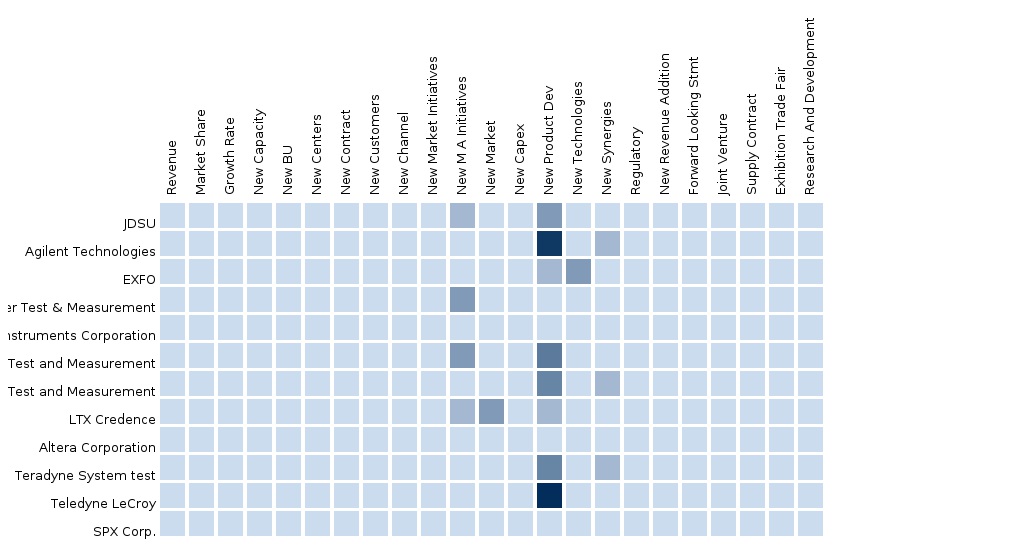
The market report provides a competitive benchmarking of the leading players in this market, such as JDSU, Agile Technologies, EXFO, Danaher, and National Instruments. The CT&M market report offers a comprehensive overview of market share, value chain anlaysis, and market metrics including drivers, restraints, and upcoming opportunities.
Report Options:
The market segmentation detailed in this report is as given below
- By Types of Test Solutions: Wireless test solutions and wireline test solutions
- By Types of Tests: Enterprise test, field network test, lab and manufacturing test, and network assurance test
- By Services: Product support services, professional services, and managed services
- By End-Users: Network equipment manufacturers(NEMs), mobile device manufacturers , telecommunication service providers, and enterprises
Customization Options
Along with the MMM assessment, customize the report in alignment with your company’s specific needs. The following customization options provide a comprehensive summary of the industry standards and a deep dive analysis:
Communication Test and Measurement Market Solutions Matrix
- A comprehensive analysis and benchmarking by types of test solution, by types of test , by services, by end-users, and by regions in the market
Communication Test and Measurement Market Competitive Benchmarking
- Value-chain evaluation using events, developments, market data for vendors in the market ecosystem, across various services, market segmentation, and categorization
- To uncover hidden opportunities by connecting related markets using cascaded value chain analysis
Communication Test and Measurement Market Vendor Landscaping
- Vendor market watch and predictions, vendor market shares and offerings, categorization of adoption trends, and market dominance (leaders, challengers, and followers)
- Network operators or end-users usage pattern analysis and brand preference
Communication Test and Measurement Market Data Tracker
- Country-specific market forecast and analysis
- Identification of key end-user segments by country
Communication Test and Measurement Market Emerging Vendor Landscape
- To evaluate Tier-2/3 vendors’ market offerings using a 2X2 framework (realizing leaders, challengers, and followers)
Communication Test and Measurement Market Channel Analysis
- Channel/distribution partners/alliances for tier-1 vendors and application-specific products being build towards the customer end of value chain
Communication Test and Measurement Market Client Tracker
- Listing and analysis of deals, case studies, R&D investments, events, discussion forums, campaigns, alliances, and partners of tier-1 and tier-2/3 vendors for the last 3 years
Communication Test and Measurement Market Product Analysis
- Usage pattern (in-depth trend analysis) of products (segment-wise)
- Product matrix, which gives a detailed comparison of product portfolio of each company, mapped at country and sub-segment levels
- Application of products (segment-wise and country-wise)
- Comprehensive coverage of product portfolio comparison for specified parameters (price and features)
1 Introduction
1.1 Key Take-aways
1.2 Report Description
1.3 Markets Covered
1.4 Stakeholders
1.5 Research Methodology
1.5.1 Key Data Points
1.5.2 Data Triangulation and Market Forecasting
1.6 Forecast Assumptions
2 Executive Summary
2.1 Abstract
2.2 Overall Market Size
3 Market Overview
3.1 Market Definition
3.2 Market Evolution
3.3 Market Segmentation
3.4 Market Dynamics
3.4.1 Impact Analysis of DRO
3.4.2 Drivers
3.4.3 Challenges
3.4.4 Opportunities
3.5 Value Chain
4 NA CT&M: Market Size and Forecast By Type of Test Solutions
4.1 Introduction
4.2 Wireless Test Solutions
4.2.1 Overview
4.2.2 Market Size and Forecast
4.3 Wireline Test Solutions
4.3.1 Overview
4.3.2 Market Size and Forecast
5 NA CT&M: Market Size and Forecast Products By Type of Tests
5.1 Introduction
5.2 Enterprise Test
5.2.1 Overview
5.2.2 Market Size and Forecast
5.3 Field Network Test
5.3.1 Overview
5.3.2 Market Size and Forecast
5.4 Lab and Manufacturing Test
5.4.1 Overview
5.4.2 Market Size and Forecast
5.5 Network Assurance Test
5.5.1 Overview
5.5.2 Market Size and Forecast
6 NA CT&M: Market Size and Forecast By Services
6.1 Introduction
6.2 Product Support Services
6.2.1 Overview
6.2.2 Market Size and Forecast
6.3 Professional Services
6.3.1 Overview
6.3.2 Market Size and Forecast
6.4 Managed Services
6.4.1 Overview
6.4.2 Market Size and Forecast
7 NA CT&M: Market Size and Forecast By End-Users
7.1 Introduction
7.2 Network Equipment Manufacturers (NEM)
7.2.1 Overview
7.2.2 Market Size and Forecast
7.3 Mobile Device Manufacturers
7.3.1 Overview
7.3.2 Market Size and Forecast
7.4 Telecommunication Service Providers
7.4.1 Overview
7.4.2 Market Size and Forecast
7.5 Enterprises
7.5.1 Overview
7.5.2 Market Size and Forecast
8 NA CT&M: Market Size and Forecast By Countries
8.1 Introduction
8.2 Parfait Chart
8.3 U.S.
8.3.1 Overview
8.3.2 Market Size and Forecast By Type of Test Solution
8.3.3 Market Size and Forecast By Type of Test
8.3.4 Market Size and Forecast By Services
8.4 Canada
8.4.1 Overview
8.4.2 Market Size and Forecast By Type of Test Solution
8.4.3 Market Size and Forecast By Type of Test
8.4.4 Market Size and Forecast By Services
8.5 Rest of NA
8.5.1 Overview
8.5.2 Market Size and Forecast By Type of Test Solution
8.5.3 Market Size and Forecast By Type of Test
8.5.4 Market Size and Forecast By Services
9 NA CT&M: Competitive Landscape
9.1 Competitive Landscape
9.1.1 Ecosystem and Roles
9.1.2 Portfolio Comparison
9.1.3 Market Opportunity Analysis
9.1.4 End-User Analysis
9.1.4.1 The Software-Defined Testing Market is Expected To Surpass $1 Billion By 2019
9.1.4.2 244 Commercial LTE Deployments Across 92 Countries Worldwide
9.1.4.3 Global Smartphone Sales is Expected To Reach 1.6 Billion Units By 2019
10 Company Profiles (MMM View, Overview, Products & Services, Financials, Swot Analysis, Strategy & Analyst Insights)
10.1 Anritsu
10.2 Agilent Technologies
10.3 Danaher Corporation
10.4 Exfo
10.5 Ixia
10.6 Jds Uniphase Corporation
10.7 National Instruments Corporation
10.8 Rohde & Schwarz
10.9 Spirent Communications
10.10 Yokogawa
10.11 F5 Networks
10.12 Citrix Systems
10.13 Cisco
10.14 Juniper
10.15 Brocade
List of Tables
Table 1 Communications Test and Measurement (CT&M) Market, 2013-2019 ($Billion, Y-O-Y %)
Table 2 NA CT&M Market, By Type of Test Solution, 2013-2019 ($Billion)
Table 3 NA Communications Test and Measurement (CT&M) Market, By Type of Test Solution, 2013-2019 (Y-O-Y %)
Table 4 NA Wireless Test Solutions Market, By Equipment and Services, 2013-2019 ($Million)
Table 5 NA Wireless Test Solutions Market, By Equipment and Services, 2013-2019 (Y-O-Y %)
Table 6 NA Wireless Test Solutions Market, By Region, 2013-2019 ($Million)
Table 7 NA Wireless Test Solutions Market, By Region, 2013-2019 (Y-O-Y %)
Table 8 NA Wireline Test Solutions Market, By Equipment and Services, 2013-2019 ($Million)
Table 9 NA Wireline Test Solutions Market, By Equipment and Services, 2013-2019 (Y-O-Y %)
Table 10 NA Wireline Test Solutions Market, By Region, 2013-2019 ($Million)
Table 11 NA Wireline Test Solutions Market, By Region, 2013-2019 (Y-O-Y %)
Table 12 NA Communications Test and Measurement (CT&M) Market, By Type of Test, 2013-2019 ($Million)
Table 13 NA CT&M Market, By Type of Test, 2013-2019 (Y-O-Y %)
Table 14 NA Enterprise Test Market, By Type of Test Solutions, 2013-2019 ($Million)
Table 15 NA Enterprise Test Market, By Type of Test Solutions, 2013-2019 (Y-O-Y %)
Table 16 NA Enterprise Test Market, By Region, 2013-2019 ($Million)
Table 17 NA Enterprise Test Market, By Region, 2013-2019 (Y-O-Y %)
Table 18 NA Field Network Test Market, By Type of Test Solutions, 2013-2019 ($Million)
Table 19 NA Field Network Test Market, By Type of Test Solutions, 2013-2019 (Y-O-Y %)
Table 20 NA Field Network Test Market, By Region, 2013-2019 ($Million)
Table 21 NA Field Network Test Market, By Region, 2013-2019 (Y-O-Y %)
Table 22 NA Lab and Manufacturing Test Market, By Type of Test Solution, 2013-2019 ($Million)
Table 23 NA Lab and Manufacturing Test Market, By Type of Test Solutions, 2013-2019 (Y-O-Y %)
Table 24 NA Lab and Manufacturing Test Market, By Region, 2013-2019 ($Million)
Table 25 NA Lab and Manufacturing Test Market, By Region, 2013-2019 (Y-O-Y %)
Table 26 NA Network Assurance Test Market, By Type of Test Solution, 2013-2019 ($Million)
Table 27 NA Network Assurance Test Market, By Type of Test Solution, 2013-2019 (Y-O-Y %)
Table 28 NA Network Assurance Test Market, By Region, 2013-2019 ($Million)
Table 29 NA Network Assurance Test Market, By Region, 2013-2019 (Y-O-Y %)
Table 30 NA Communications Test and Measurement (CT&M) Market, By Services, 2013-2019 ($Million)
Table 31 NA CT&M Market, By Services, 2013-2019 (Y-O-Y %)
Table 32 NA Product Support Services Market, By Type of Test Solution, 2013-2019 ($Million)
Table 33 NA Product Support Services Market, By Type of Test Solution, 2013-2019 ($Million)
Table 34 NA Product Support Services Market, By Region, 2013-2019 ($Million)
Table 35 NA Product Support Services Market, By Region, 2013-2019 (Y-O-Y %)
Table 36 NA Professional Services Market, By Type of Test Solution, 2013-2019 ($Million)
Table 37 NA Professional Services Market, By Type of Test Solution, 2013-2019 (Y-O-Y %)
Table 38 NA Professional Services Market, By Region, 2013-2019 ($Million)
Table 39 NA Professional Services Market, By Region, 2013-2019 (Y-O-Y %)
Table 40 NA Managed Services Market, By Type of Test Solution, 2013-2019 ($Million)
Table 41 NA Managed Services Market, By Type of Test Solution, 2013-2019 (Y-O-Y %)
Table 42 NA Managed Services Market, By Region, 2013-2019 ($Million)
Table 43 NA Managed Services Market, By Region, 2013-2019 (Y-O-Y %)
Table 44 NA Communications Test and Measurement (CT&M) Market, By End-Users, 2013-2019 ($Million)
Table 45 NA CT&M Market, By End-Users, 2013-2019 (Y-O-Y %)
Table 46 NA NEMs Market, By Type of Test Solution, 2013-2019 ($Million)
Table 47 NA NEMs Market, By Type of Test Solution, 2013-2019 (Y-O-Y %)
Table 48 NA NEMs Market, By Equipment and Services, 2013-2019 ($Million)
Table 49 NA NEMs Market, By Equipment and Services, 2013-2019 (Y-O-Y %)
Table 50 NA Mobile Device Manufacturers Market, By Type of Test Solution, 2013-2019 ($Million)
Table 51 NA Mobile Device Manufacturers Market, By Type of Test Solution, 2013-2019 (Y-O-Y %)
Table 52 NA Mobile Device Manufacturers Market, By Equipment and Services, 2013-2019 ($Million)
Table 53 NA Mobile Device Manufacturers Market, By Equipment and Services, 2013-2019 (Y-O-Y %)
Table 54 NA Telecommunication Service Provider Market, By Type of Test Solution, 2013-2019 ($Million)
Table 55 NA Telecommunication Service Provider Market, By Type of Test Solution, 2013-2019 (Y-O-Y %)
Table 56 NA Telecommunication Service Provider Market, By Equipment and Services, 2013-2019 ($Million)
Table 57 NA Telecommunication Service Provider Market, By Equipment and Services, 2013-2019 (Y-O-Y %)
Table 58 NA Enterprise Market, By Type of Test Solution, 2013-2019 ($Million)
Table 59 NA Enterprise Market, By Type of Test Solution, 2013-2019 (Y-O-Y %)
Table 60 NA Enterprise Market, By Equipment and Services, 2013-2019 ($Million)
Table 61 NA Enterprise Market, By Equipment and Services, 2013-2019 (Y-O-Y %)
Table 62 NA Communications Test and Measurement (CT&M) Market, By Region, 2013-2019 ($Million)
Table 63 NA CT&M Market, By Region, 2013-2019 (Y-O-Y %)
Table 64 North America Market, By Type of Test Solution, 2013-2019 ($Million)
Table 65 North America Market, By Type of Test Solution, 2013-2019 (Y-O-Y %)
Table 66 North America Market, By Type of Test, 2013-2019 ($Million)
Table 67 North America Market, By Type of Test, 2013-2019 (Y-O-Y %)
Table 68 North America Market, By Services, 2013-2019 ($Million)
Table 69 North America Market, By Services, 2013-2019 (Y-O-Y %)
List of Figures
Figure 1 Secondary and Primary Research
Figure 2 Data Triangulation and Market Forecasting
Figure 3 NA Communications Test and Measurement (CT&M) Market, 2013-2019 (Y-O-Y %)
Figure 4 Impact Analysis of DRO
Figure 5 Value Chain
Figure 6 NA CT&M Market, By Type of Test Solution, 2013-2019 (Y-O-Y %)
Figure 7 NA Wireless Test Solutions Market, By Equipment and Services, 2013-2019 (Y-O-Y %)
Figure 8 NA Wireline Test Solutions Market, By Equipment and Services, 2013-2019 (Y-O-Y %)
Figure 9 NA Communications Test and Measurement (CT&M) Market, By Type of Test, 2013-2019 (Y-O-Y %)
Figure 10 NA Enterprise Test Market, By Type of Test Solutions, 2013-2019 (Y-O-Y %)
Figure 11 NA Field Network Test Market, By Type of Test Solutions, 2013-2019 (Y-O-Y %)
Figure 12 NA Lab and Manufacturing Test Market, By Type of Test Solutions, 2013-2019 (Y-O-Y %)
Figure 13 NA Network Assurance Test Market, By Type of Test Solution, 2013-2019 (Y-O-Y %)
Figure 14 NA CT&M Market, By Services, 2013-2019 (Y-O-Y %)
Figure 15 NA Product Support Services Market, By Type of Test Solution, 2013-2019 ($Million)
Figure 16 NA Professional Services Market, By Type of Test Solution, 2013-2019 (Y-O-Y %)
Figure 17 NA Managed Services Market, By Type of Test Solution, 2013-2019 (Y-O-Y %)
Figure 18 NA Communications Test and Measurement (CT&M) Market, By End-Users, 2013-2019 (Y-O-Y %)
Figure 19 NA NEMs Market, By Type of Test Solution, 2013-2019 (Y-O-Y %)
Figure 20 NA NEMs Market, By Equipment and Services, 2013-2019 (Y-O-Y %)
Figure 21 NA Mobile Device Manufacturers Market, By Type of Test Solution, 2013-2019 (Y-O-Y %)
Figure 22 NA Mobile Device Manufacturers Market, By Equipment and Services, 2013-2019 (Y-O-Y %)
Figure 23 NA Telecommunication Service Provider Market, By Type of Test Solution, 2013-2019 (Y-O-Y %)
Figure 24 NA Telecommunication Service Provider Market, By Equipment and Services, 2013-2019 (Y-O-Y %)
Figure 25 NA Enterprise Market, By Type of Test Solution, 2013-2019 (Y-O-Y %)
Figure 26 NA Enterprise Market, By Equipment and Services, 2013-2019 (Y-O-Y %)
Figure 27 NA Communications Test and Measurement (CT&M) Market, By Region, 2013-2019 (Y-O-Y %)
Figure 28 NA CT&M Market: Parfait Chart
Figure 29 North America Market, By Type of Test Solution, 2013-2019 (Y-O-Y %)
Figure 30 North America Market, By Type of Test, 2013-2019 (Y-O-Y %)
Figure 31 North America Market, By Services, 2013-2019 (Y-O-Y %)
Figure 32 NA Ecosystem and Market Players
Figure 33 NA Product Portfolio Comparison
Figure 34 NA Communications Test and Measurement (CT&M) Market Opportunity Analysis
Please fill in the form below to receive a free copy of the Summary of this Report
Please visit https://www.micromarketmonitor.com/custom-research-services.html to specify your custom Research Requirement


