

North America Biofertilizer Market By Application (Cereals & Grains, Fruits & Vegetables, Pulses & Oilseeds), By Type (Nitrogen Fixing Biofertilizers, Phosphate Solubilizing Biofertilizers, Potash Mobilizing Biofertilizers), By Source, By Geography - Analysis and Forecast to 2019
- Publish Date: Apr 2015


The North American biofertilizer market is estimated to grow at CAGR of 12.7% from 2014 to 2019. Biofertilizers play a vital role in optimizing organic content in soil, which provides necessary nutrition to plants. They are cost-effective as compared to chemical fertilizers, as biofertilizers increase soil fertility in the long run by restoring the natural nutrient generation cycle of soil.
Biofertilizers provide various benefits to the fertility and productivity of soil, by naturally boosting the nutrient uptake that is essential for the growth and development of plants. Nitrogen fixing biofertilizers, phosphate solubilizing biofertilizers, and potash mobilizing biofertilizers are different types of commonly used biofertilizers. The cost of producing biofertilizers depends upon the fermentation technology. The costs vary according to the relative ease of production and downstream processing.
The North American biofertilizer market is dominated by the U.S., followed by Canada. In the U.S., the biofertilizer business is relatively new, highly fragmented, under-capitalized, and growing rapidly. The U.S. is an important fertilizer importer. Though representing a tiny share of the fertilizer market in the U.S., demand for organic products is steadily progressing along with the demand for biofertilizers. The rapid development of biofertilizer use in agriculture, in addition to the increasing demand for organic food and other organic goods in the country has resulted in propelling the growth of the bio-fertilizer market. Canada, Peru, and Mexico are the main exporters of biofertilizers to the U.S. The increase in the cost of synthetic fertilizers and awareness towards the requirement of balanced nutrition for plants may have a positive impact on the U.S. biofertilizer market.
The North America biofertilizer market is a competitive market, and is dominated by leading market players such as Novozymes A/S (Denmark), Rhizobacter Argentian SA (Argentina), and Antibotice SA.
Scope of the Report
This research report categorizes the North American biofertilizer market into the following segments and sub-segments:
North American Biofertilizer Market, By Type
- Nitrogen Fixing Biofertilizers
- Phosphate Solubilizing Bio-fertilizers
- Potash Mobilizing Bio-fertilizers
- Others
North American Biofertilizer Market, By Application
- Cereals and Grains
- Pulses and Oilseeds
- Fruits and vegetables
- Others
North American Biofertilizer Market, By Geography
- U.S.
- Canada
- Mexico
Table of Contents
1 Introduction (Page No. - 11)
1.1 Objectives of the Study
1.2 Market Segmentation & Coverage
1.3 Stakeholders
2 Research Methodology (Page No. - 13)
2.1 Integrated Ecosystem of Biofertilizers Market
2.2 Arriving at the Bio-Fertilizers Market Size
2.2.1 Top-Down Approach
2.2.2 Bottom-Up Approach
2.2.3 Demand Side Approach
2.2.4 Macroindicator-Based Approach
2.3 Assumptions
3 Executive Summary (Page No. - 20)
4 Market Overview (Page No. - 22)
4.1 Introduction
4.2 Biofertilizers Market: Comparison With Parent Market
4.3 Market Drivers and Inhibitors
4.4 Key Market Dynamics
4.5 Demand Side Analysis
4.6 Vendor Side Analysis
5 North America Biofertilizers Market, By Application (Page No. - 32)
5.1 Introduction
5.2 Demand Side Analysis
5.3 Biofertilizers in Cereals & Grains, By Geography
5.4 Biofertilizers in Fruits & Vegetables, By Geography
5.5 Biofertilizers in Pulses & Oilseeds, By Geography
6 North America Biofertilizers Market, By Type (Page No. - 40)
6.1 Introduction
6.2 North America Biofertilizers Market, Type Comparison With Agricultural Biologicals Market
6.3 North America Nitrogen Fixing Biofertilizers Market, By Geography
6.4 North America Phosphate Solubilizing Biofertilizers Market, By Geography
6.5 North America Potash Mobilizing Biofertilizers Market, By Geography
6.6 Sneak View: North America Bio-Fertilizers Market, By Type, 2014
7 Biofertilizers Market, By Source (Page No. - 49)
7.1 Introduction
7.2 North America Biofertilizers Market, By Source (Microorganisms): Comparison With Agriculture
Biologicals Market
7.3 North America Cyanobacteria Market, By Geography
7.4 North America Azotobacter Market, By Geography
7.5 North America Phosphate Solubilizing Bacteria Market, By Geography
7.6 North America Azospirillum Market, By Geography
7.7 North America Rhizobia Market, By Geography
7.8 Sneak View: North America Biofertilizers Market, By Source, 2014
8 Biofertilizers Market, By Geography (Page No. - 62)
8.1 Introduction
8.2 Vendor Side Analysis
8.3 U.S. Biofertilizers Market
8.3.1 U.S. Biofertilizers Market, By Application
8.3.2 U.S. Biofertilizers Market, By Type
8.3.3 U.S. Biofertilizers Market, By Source
8.4 Canada Biofertilizers Market
8.4.1 Canada Biofertilizers Market, By Application
8.4.2 Canada Biofertilizers Market, By Type
8.4.3 Canada Biofertilizers Market, By Source
8.5 Mexico Biofertilizers Market
8.5.1 Mexico Biofertilizers Market, By Application
8.5.2 Mexico Biofertilizers Market, By Type
8.5.3 Mexico Biofertilizers Market, By Source
9 North America Biofertilizers Market: Competitive Landscape (Page No. - 85)
9.1 Biofertilizers Market: Market Share Analysis
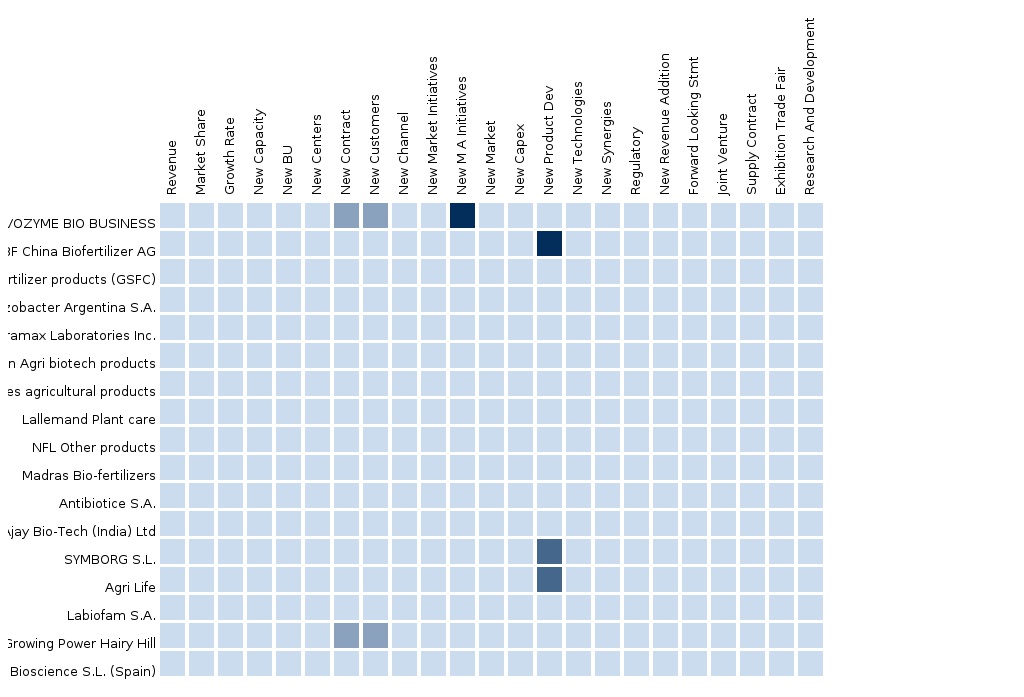
9.2 Company Presence in Biofertilizers Market, By Type
9.3 Mergers & Acquisitions
9.4 Expansions
9.5 Agreements & Strategic Alliance
9.6 New Product Developments
10 North America Biofertilizers Market, By Company (Page No. - 89)
(Overview, Financials, Products & Services, Strategy, and Developments)*
10.1 Novozymes A/S
10.2 Rizobacter Argentina S.A.
10.3 Antibiotice SA
*Details on Overview, Financials, Product & Services, Strategy, and Developments Might Not be Captured in Case of Unlisted Companies.
11 Appendix (Page No. - 96)
11.1 Customization Options
11.1.1 Technical Analysis
11.1.2 Low-Cost Sourcing Locations
11.1.3 Regulatory Framework
11.1.4 Crop-Bio-Fertilizer Usage Data
11.1.5 Impact Analysis
11.1.6 Trade Analysis
11.1.7 Historical Data and Trends
11.2 Related Reports
11.3 Introducing RT: Real Time Market Intelligence
11.3.1 RT Snapshots
List of Tables (67 Tables)
Table 1 Global Bio-Fertilizers Peer Market Size, 2014 (USD MN)
Table 2 North America Bio-Fertilizers Application Market, 2014 (KT)
Table 3 North America Bio-Fertilizers Market: Macro Indicators, By Geography, 2014 (Mn HA)
Table 4 North America Bio-Fertilizers Market: Comparison With Parent Market, 2013 – 2019 (USD MN)
Table 5 North America Bio-Fertilizers Market: Comparison With Parent Market, 2013 – 2019 (Thousand Hectares)
Table 6 North America Bio-Fertilizers Market: Drivers and Inhibitors
Table 7 North America Bio-Fertilizers Market, By Application, 2013-2019(USD MN)
Table 8 North America Bio-Fertilizers Market, By Application, 2013-2019(Thousand Hectares)
Table 9 North America Bio-Fertilizers Market, By Type, 2013-2019(USD MN)
Table 10 North America Bio-Fertilizers Market, By Type, 2013-2019(Thousand Hectares)
Table 11 North America Bio-Fertilizers Market, By Geography, 2013-2019 (USD MN)
Table 12 North America Bio-Fertilizers Market, By Geography, 2013-2019 (Thousand Hectares)
Table 13 North America Bio-Fertilizers Market: Comparison With Application Markets, 2013-2019 (USD MN)
Table 14 North America Bio-Fertilizers Market, By Application, 2013-2019 (USD MN)
Table 15 North America Bio-Fertilizers: Market, By Application, 2013-2019 (Thousand Hectares)
Table 16 North America Bio-Fertilizers in Cereals & Grains , By Geography, 2013-2019 (USD Mn )
Table 17 North America Bio- Fertilizers in Fruits & Vegetables, By Geography, 2013-2019 (USD MN)
Table 18 North America Bio- Fertilizers in Pulses & Oilseeds, By Geography, 2013-2019 (USD MN)
Table 19 North America Bio-Fertilizers Market, By Type, 2013-2019 (USD MN)
Table 20 North America Bio- Fertilizers Market, By Type, 2013-2019 (Thousand Hectares)
Table 21 North America Bio- Fertilizers Market: Type Comparison With Parent Market, 2013–2019 (USD MN)
Table 22 North America Nitrogen Fixing Bio-Fertilizers Market, By Geography, 2013–2019 (USD MN)
Table 23 North America Nitrogen Fixing Bio-Fertilizers Market, By Geography, 2013–2019 (Thousand Hectares)
Table 24 North America Phosphate Solubilizing Bio-Fertilizers Market, By Geography, 2013-2019 (USD MN)
Table 25 North America Phosphate Solubilizing Bio-Fertilizers Market, By Geography, 2013-2019 (Thousand Hectares)
Table 26 North America Potash Mobilizing Bio-Fertilizers Market, By Geography, 2013-2019 (USD MN)
Table 27 North America Potash Mobilizing Bio-Fertilizers Market, By Geography, 2013-2019 (Thousand Hectares)
Table 28 North America Bio-Fertilizers Market, By Source, 2013-2019 (USD MN)
Table 29 North America Bio- Fertilizers Market, By Source, 2013-2019 (Thousand Hectares)
Table 30 North America Bio- Fertilizers Market: Microorganisms Comparison With Parent Market, 2013–2019 (USD MN)
Table 31 North America Cyanobacteria Market, By Geography, 2013–2019 (USD MN)
Table 32 North America Cyanobacteria Market, By Geography, 2013–2019 (Thousand Hectares)
Table 33 North America Azotobacter Market, By Geography, 2013-2019 (USD MN)
Table 34 North America Azotobacter Market, By Geography, 2013-2019 (Thousand Hectares)
Table 35 North America Phosphate Solubilizing Bacteria Market, By Geography, 2013-2019 (USD MN)
Table 36 North America Phosphate Solubilizing Bacteria Market, By Geography, 2013-2019 (Thousand Hectares)
Table 37 North America Azospirillum Market, By Geography, 2013-2019 (USD MN)
Table 38 North America Azospirillum Market, By Geography, 2013-2019 (Thousand Hectares)
Table 39 North America Rhizobia Market, By Geography, 2013-2019 (USD MN)
Table 40 North America Rhizobia Market, By Geography, 2013-2019 (Thousand Hectares)
Table 41 North America Bio-Fertilizers Market, By Geography, 2013-2019 (USD MN)
Table 42 North America Bio-Fertilizers Market, By Geography, 2013-2019 (Thousand Hectares)
Table 43 U.S. Bio-Fertilizers Market, By Application, 2013-2019 (USD MN)
Table 44 U.S. Bio-Fertilizers Market, By Application, 2013-2019 (Thousand Hectares)
Table 45 U.S. Bio-Fertilizer Market, By Type, 2013-2019 (USD MN)
Table 46 U.S. Bio-Fertilizers Market, By Type, 2013-2019 (Thousand Hectares)
Table 47 U.S. Bio-Fertilizer Market, By Source, 2013-2019 (USD MN)
Table 48 U.S. Bio-Fertilizers Market, By Source, 2013-2019 (Thousand Hectares)
Table 49 Canada Bio-Fertilizers Market, Market, By Application, 2013-2019 (USD MN)
Table 50 Canada Bio-Fertilizers Market, Market, By Application, 2013-2019(Thousand Hectares)
Table 51 Canada Bio-Fertilizers Market, By Type, 2013-2019 (USD MN)
Table 52 Canada Bio-Fertilizers Market, By Type, 2013-2019 (Thousand Hectares)
Table 53 Canada Bio-Fertilizer Market, By Source, 2013-2019 (USD MN)
Table 54 Canada Bio-Fertilizers Market, By Source, 2013-2019 (Thousand Hectares)
Table 55 Mexico Bio-Fertilizers Market, By Application, 2013-2019 (USD MN)
Table 56 Mexico Bio-Fertilizers Market, By Application, 2013-2019 (Thousand Hectares)
Table 57 Mexico Bio-Fertilizers Market, By Type, 2013-2019 (USD MN)
Table 58 Mexico Bio-Fertilizers Market, By Type, 2013-2019 (Thousand Hectares)
Table 59 Mexico Bio-Fertilizer Market, By Source, 2013-2019(USD MN)
Table 60 Mexico Bio-Fertilizers Market, By Source, 2013-2019 (Thousand Hectares)
Table 61 Bio-Fertilizers Market: Market Share Analysis, 2014 (%)
Table 62 North America Bio-Fertilizers Market: Mergers & Acquisitions
Table 63 North America Bio-Fertilizers Market: Expansions
Table 64 North America Bio-Fertilizers Market: Agreements & Strategic Alliance
Table 65 North America Bio-Fertilizers Market: New Product Developments
Table 66 Novozymes A/S, Key Operational Data, 2009 - 2013 (USD MN)
Table 67 Antibiotice SA, Key Operations Data, 2009 - 2013 (USD MN)
List of Figures (58 Figures)
Figure 1 North America Bio-Fertilizers Market: Segmentation & Coverage
Figure 2 Bio-Fertilizers Market: Integrated Ecosystem
Figure 3 Research Methodology
Figure 4 Top-Down Approach
Figure 5 Bottom-Up Approach
Figure 6 Demand Side Approach
Figure 7 Macroindicator-Based Approach
Figure 8 North America Bio-Fertilizers Market Snapshot
Figure 9 Bio-Fertilizers Market: Growth Aspects
Figure 10 North America Bio-Fertilizers Market, By Application, 2014 vs. 2019
Figure 11 North America Bio-Fertilizers Types, By Geography, 2014 (USD MN)
Figure 12 North America Bio-Fertilizers Market: Growth Analysis, By Type, 2014–2019 (%)
Figure 13 Bio-Fertilizers: Application Market Scenario
Figure 14 North America Bio-Fertilizers Market, By Application, 2014 - 2019 (USD MN)
Figure 15 North America Bio-Fertilizers Market, By Application, 2014 - 2019 (Thousand Hectares)
Figure 16 North America Bio-Fertilizers Market in Cereals & Grains, By Geography, 2013-2019 (USD MN)
Figure 17 North America Bio-Fertilizers Market in Fruits & Vegetables, By Geography, 2013-2019(USD MN)
Figure 18 North America Bio-Fertilizers Market in Pulses & Oilseeds, By Geography, 2013-2019 (USD MN)
Figure 19 North America Bio-Fertilizers Market, By Type, 2014-2019(USD MN)
Figure 20 North America Bio-Fertilizers Market, By Type, 2014-2019 ( Thousand Hectares)
Figure 21 North America Bio- Fertilizers Market: Type Comparison With Agricultural Biologicals Market, 2013–2019 (USD MN)
Figure 22 North America Nitrogen Fixing Bio-Fertilizers Market, By Geography, 2013–2019 (USD MN)
Figure 23 North America Phosphate Solubilizing Bio-Fertilizers Market, By Geography, 2013-2019 (USD MN)
Figure 24 North America Potash Mobilizing Bio-Fertilizers Market, By Geography, 2013-2019 (USD MN)
Figure 25 North America Bio-Fertilizers Market, By Source, 2014-2019(USD MN)
Figure 26 North America Bio-Fertilizers Market, By Source, 2014-2019 (Thousand Hectares)
Figure 27 North America Bio- Fertilizers Market, By Source (Microorganisms): Comparison With Agriculture Biologicals Market
Figure 28 North America Cyanobacteria Market, By Geography, 2013–2019 (USD MN)
Figure 29 North America Azotobacter Market, By Geography, 2013-2019 (USD MN)
Figure 30 North America Phosphate Solubilizing Bacteria Market, By Geography, 2013-2019 (USD MN)
Figure 31 North America Azospirillum Market, By Geography, 2013-2019(USD MN)
Figure 32 North America Rhizobia Market, By Geography, 2013-2019(USD MN)
Figure 33 North America Bio-Fertilizers Market: Growth Analysis, By Geography, 2013-2019 (USD MN)
Figure 34 North America Bio-Fertilizers Market: Growth Analysis, By Geography, 2013-2019 (Thousand Hectares)
Figure 35 U.S. Bio-Fertilizers Market Overview, 2014 & 2019 (%)
Figure 36 U.S. Bio-Fertilizers Market, By Application, 2013-2019 (USD MN)
Figure 37 U.S. Bio- Fertilizers Market: Application Snapshot
Figure 38 U.S. Bio-Fertilizers Market, By Type, 2013-2019 (USD MN)
Figure 39 U.S. Bio-Fertilizers Market Share, By Type, 2014-2019 (%)
Figure 40 U.S. Bio-Fertilizers Market, By Source, 2013-2019 (USD MN)
Figure 41 U.S. Bio-Fertilizers Market Share, By Source, 2014-2019 (%)
Figure 42 Canada Bio-Fertilizers Market Overview, 2014 & 2019 (%)
Figure 43 Canada Bio-Fertilizers Market, By Application, 2013-2019 (USD MN)
Figure 44 Canada Bio-Fertilizers Market: Application Snapshot
Figure 45 Canada Bio- Fertilizers Market, By Type, 2013-2019 (USD MN)
Figure 46 Canada Bio- Fertilizers Market Share, By Type, 2014-2019 (%)
Figure 47 Canada Bio-Fertilizers Market, By Source, 2013-2019 (USD MN)
Figure 48 Canada Bio-Fertilizers Market Share, By Source, 2014-2019 (%)
Figure 49 Mexico Bio-Fertilizers Market Overview, 2014 & 2019 (%)
Figure 50 Mexico Bio- Fertilizers Market, By Application, 2013-2019 (USD MN)
Figure 51 Mexico Bio-Fertilizers Market: Application Snapshot
Figure 52 Mexico Bio-Fertilizers Market, By Type, 2013-2019 (USD MN)
Figure 53 Mexico Bio- Fertilizers Market: Type Snapshot
Figure 54 Mexico Bio-Fertilizers Market, By Source, 2013-2019(USD MN)
Figure 55 Mexico Bio-Fertilizers Market Share, By Source, 2014-2019 (%)
Figure 56 Bio-Fertilizers Market: Market Share Analysis, 2014 (%)
Figure 57 Bio-Fertilizers: Company Product Coverage, By Type, 2014
Figure 58 Novozymes A/S.: Revenue Mix, 2013 (%)
The North American bio-fertilizers market has grown exponentially in the last few years, and this growth is expected to continue in the future. The nitrogen-fixing bio-fertilizer segment is the largest among all its types. North America is the biggest market for bio-fertilizers, while the Asia-Pacific bio-fertilizers market is expected to grow at a faster pace in comparison to all other regions. The market is highly fragmented at the regional level due to the presence of various small-scale players.
The bio-fertilizer market is primarily driven by the growth in the organic food industry. Another market driver triggering the growth of this market is the promotion of bio-fertilizers by the governmental agencies. Even after extensive government efforts to promote bio-fertilizers, lack of awareness about the concept has become a major restraining factor hampering the growth of this market. According to a report published by FAO in 2012, the booming economies in several Asian countries have increased the bargaining power of consumers, which has further resulted in the increase in the overall demand for organic products. Thus, the Asia-Pacific region is an emerging market in the global bio-fertilizer industry.
The purpose of this study is to analyze the North American market for bio-fertilizers. This report includes revenue forecast, market trends, and opportunities for the period 2014 to 2019.
The North American bio-fertilizer market was valued at $272.3 million in 2014, and is projected to reach $495.0 million by 2019, at a CAGR of 12.7% from 2014 to 2019. The cereals and grains application segment accounted for a market share of 30.8% in 2014.
Please visit https://www.micromarketmonitor.com/custom-research-services.html to specify your custom Research Requirement
| PRODUCT TITLE | PUBLISHED | |
|---|---|---|
|
|
Europe Agriculture Biologicals Market Biologicals-Europe and Agriculture Biopesticides Market, Bio... |
Upcoming |
|
|
Asia-Pacific Agriculture Biologicals Market Biologicals-Asia and Agriculture Biopesticides Market, Bio... |
Upcoming |
|
|
Latin America Agriculture Biologicals Market Biologicals-Latin America and Agriculture Biopesticides Market, Bio... |
Apr 2015 |
|
|
North America Agriculture Biologicals Market The North America agriculture biologicals market was valued at $1,409.07 million in 2014 and is projected to reach $2,758.24 million by 2019 at a CAGR of 14.4% during the forecast period. The market, by application is led by cereals and grains in 2014. In North America, U.S. has the largest share in the agriculture biologicals market. It constitutes of 72.47% of North America agriculture biologicals market. The biopesticides are mostly consumed in North America than other biological types. |
May 2015 |


