

North America Commercial Aviation Aircraft Seating Market by Aircraft Type (NBA, WBA, VLA, BGA), by Seat Type (Suite, First, Business, Premium Economy, Economy), by Fit (Line Fit, Retro Fit) - Analysis And Forecast (2014-2019)
- Publish Date: Apr 2015


In this report, the North American commercial aviation aircraft seating market has been broadly classified on the basis of aircraft type, seat type, fit, and country. The major aircraft types include narrow body aircraft, wide body aircraft, large aircraft, and business general aviation aircraft.
Seating in very large aircraft market is expected to be the fastest-growing segment in the North American aircraft type market, which is projected to grow at the fastest CAGR of 7.8% from 2014 to 2019. Factors such as increase in passenger traffic, rise in aircraft deliveries, and the need for fuel efficiency further drives the market at a significant pace.
The North American market is a competitive market with a number of market players. As of 2014, the North American seating market was majorly dominated by B/E Aerospace, Zodiac Aerospace, and Recaro Aircraft Seating GmbH. The expansion of plant capacities, agreements, contracts, and joint ventures are the major strategies adopted by these players to achieve growth in the North American aircraft seating market.
Reasons to Buy the Report:
From an insight perspective, this research report has focused on various levels of analysis—industry analysis (industry trends and PEST analysis), market share analysis of top players, supply chain analysis, and company profiles, which together provide basic views on the competitive landscape, emerging and high-growth segments of the aircraft seating market, high-growth countries & their respective regulatory policies, government initiatives, and market metrics such as drivers, restraints, and opportunities.
The report will enrich both the established firms as well as new entrants/smaller firms to gauge the pulse of the market, which in turn will help the firms garner a greater share of the North American aircraft seating market. Firms that purchase the report could use any one or a combination of five strategies that include market penetration, product development/innovation, market development, market diversification, and competitive assessment to strengthen their market share.
The report provides insights on the following pointers:
- Market Penetration: Comprehensive information on aircraft seating offered by top players in the aircraft seating market
- Product Development/Innovation: Detailed insights on upcoming technologies, research & development activities, and new product launches in the aircraft seating market
- Market Development: Comprehensive information of lucrative emerging markets. The report analyzes the markets for various aircraft seating technologies at the regional and country levels
- Market Diversification: Exhaustive information of new products, untapped geographies, recent developments, and investments in the aircraft seating market
Competitive Assessment: In-depth assessment of the market shares, strategies, products, and manufacturing capabilities of leading players in the aircraft seating market
Table of Contents
1 Introduction (Page No. - 13)
1.1 Objectives of the Study
1.2 Market Segmentation & Coverage
1.3 Stakeholders
2 Research Methodology (Page No. - 15)
2.1 Integrated Ecosystem of the Commercial Aviation Aircraft Seating Market
2.2 Arriving at the Aircraft Seating Market Size
2.2.1 Top-Down Approach
2.2.2 Bottom-Up Approach
2.2.3 Macro Indicator-Based Approach
2.3 Assumptions
3 Executive Summary (Page No. - 23)
4 Market Overview (Page No. - 25)
4.1 Introduction
4.2 North America Commercial Aviation Aircraft Seating Market: Comparison With the Parent Market
4.3 Market Drivers and Inhibitors
4.4 Key Market Dynamics
4.5 Demand Side Analysis
4.6 Vendor Side Analysis
5 North America Commercial Aviation Aircraft Seating Market, By Aircraft Type (Page No. - 32)
5.1 Introduction
5.2 Demand Side Analysis
5.3 Vendor Side Analysis
5.4 North America Commercial Aviation Aircraft Seating in Narrow Body Aircraft
5.5 North America Commercial Aviation Aircraft Seating in Wide Body Aircraft
5.6 North America Commercial Aviation Aircraft Seating in Very Large Aircraft
5.7 North America Commercial Aviation Aircraft Seating in BGA & RTA
5.8 Sneak View: North American Commercial Aircraft Seating Market, By Aircraft Type
6 North American Commercial Aircraft Seating Market, By Seat Type (Page No. - 46)
6.1 Introduction
6.2 North America Commercial Aviation Aircraft Seating, By Seat Type
6.3 North American Aviation Aircraft Seating Market, Type Comparison With Cabin Interior Market
6.4 North America Suite Class Seat Market, By Geography
6.5 North America First Class Seat Market, By Geography
6.6 North America Business Class Seat Market, By Geography
6.7 North America Premium Economy Class Seat Market, By Geography
6.8 North America Economy Class Seat Market, By Geography
6.9 Sneak View: North America Commercial Aviation Aircraft Seat Market, By Type
7 North America Commercial Aviation Aircraft Seating Market, By Fit (Page No. - 56)
7.1 Introduction
7.2 Commercial Aviation Aircraft Seating, By Fit
8 North America Commercial Aviation Aircraft Seating Market, By Geography (Page No. - 61)
8.1 Introduction
8.2 Vendor Side Analysis
8.3 U.S. Commercial Aviation Aircraft Seating Market
8.3.1 U.S. Commercial Aviation Aircraft Seating Market, By Aircraft Type
8.3.2 U.S. Commercial Aviation Aircraft Seating Market, By Seat Type
8.3.3 U.S. Commercial Aviation Aircraft Seating Market, By Fit
8.4 Canada Commercial Aviation Aircraft Seating Market
8.4.1 Canada Commercial Aviation Aircraft Seating Market, By Aircraft Type
8.4.2 Canada Commercial Aviation Aircraft Seating Market, By Seat Type
8.4.3 Canada Commercial Aviation Aircraft Seating Market, By Fit
9 North America Commercial Aviation Aircraft Seating Market: Competitive Landscape (Page No. - 75)
9.1 North American Commercial Aviation Aircraft Seating Market: Company Share Analysis
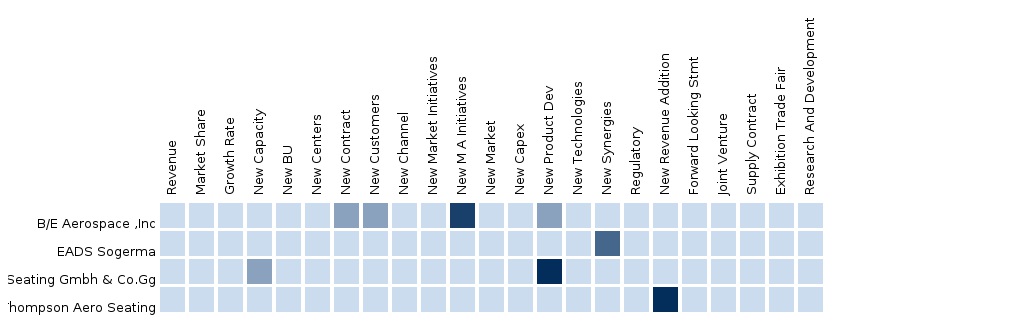
9.2 Company Presence in North American Commercial Aviation Aircraft Seating Market, By Type
9.3 Mergers & Acquisitions
9.4 Expansions
9.5 Contracts
9.6 Joint Ventures
10 North America Commercial Aviation Aircraft Seating Market, By Company (Page No. - 80)
(Overview, Financials, Products & Services, Strategy, and Developments)*
10.1 B/E Aerospace, Inc.
10.2 Haeco Americas
10.3 Zodiac Aerospace S.A.
10.4 Recaro Aircraft Seating GMBH & Co. Kg
10.5 Aviointeriors S.P.A.
10.6 Thompson Aero Seating Ltd.
10.7 Zim Flugsitz GMBH
10.8 Geven S.P.A.
*Details on Overview, Financials, Product & Services, Strategy, and Developments Might Not be Captured in Case of Unlisted Company
11 Appendix (Page No. - 98)
11.1 Customization Options
11.1.1 Technical Analysis
11.1.2 Low-Cost Sourcing Locations
11.1.3 Regulatory Framework
11.1.4 Impact Analysis
11.1.5 Historical Data and Trends
11.2 Related Reports
11.3 Introducing RT: Real Time Market Intelligence
11.3.1 RT Snapshots
List of Tables (54 Tables)
Table 1 Global Commercial Aviation Aircraft Seating Peer Market Size, 2014 (USD MN)
Table 2 Global Aircraft Deliveries, 2014 - 2019 (Units)
Table 3 North America Macro Indicators (%), By Geography, 2014
Table 4 North America Commercial Aircraft Seating Market: Comparison With the Parent Market, 2013 – 2019 (USD MN)
Table 5 North America Commercial Aircraft Seating Market: Drivers and Inhibitors
Table 6 North America Commercial Aircraft Seating Market, By Aircraft Type, 2013 - 2019 (USD MN)
Table 7 North America Commercial Aircraft Seating Market, By Geography, 2013 - 2019 (USD MN)
Table 8 North America Commercial Aircraft Seating Market, By Seat Type, 2013 - 2019 (USD MN)
Table 9 North America Commercial Aircraft Seating Market: Comparison With Aircraft Deliveries, 2014 - 2019 (Units)
Table 10 North America Revenue Passenger Kilometers, 2013 (%)
Table 11 North America Commercial Aircraft Seating Market, By Aircraft Type, 2013 - 2019 (USD MN)
Table 12 Characteristics of Aircraft Types
Table 13 North America New Aircraft Deliveries, By Aircraft Type, 2013-2033
Table 14 North America Commercial Aviation Aircraft Seating in Narrow Body Aircraft, By Geography, 2013-2019 (USD MN)
Table 15 North America Commercial Aviation Aircraft Seating in Narrow Body Aircraft, By Seat Type, 2013-2019 (USD MN)
Table 16 North America Commercial Aviation Aircraft Seating in Wide Body Aircraft, By Geography, 2013-2019 (USD MN)
Table 17 North America Commercial Aviation Aircraft Seating in Wide Body Aircraft,By Seat Type, 2013-2019 (USD MN)
Table 18 North America Commercial Aviation Aircraft Seating in Very Large Aircraft, By Geography, 2013-2019 (USD MN)
Table 19 North America Commercial Aviation Aircraft Seating in Very Large Aircraft, By Seat Type, 2013-2019 (USD MN)
Table 20 North America Commercial Aviation Aircraft Seating in BGA & RTA, By Geography, 2013-2019 (USD MN)
Table 21 North America Commercial Aviation Aircraft Seating in BGA & RTA, By Seat Type, 2013-2019 (USD MN)
Table 22 North America Commercial Aviation Aircraft Seating in Very Large Aircraft, By Geography, 2013-2019 (USD MN)
Table 23 North America Commercial Aviation Aircraft Seating Market, By Seat Type, 2013-2019 (USD MN)
Table 24 North America Aircraft Seating Market: Type Comparison With Parent Market, 2013–2019 (USD MN)
Table 25 North America Suite Class Seat Market, By Geography, 2013–2019 (USD MN)
Table 26 North America First Class Seat Market, By Geography, 2013-2019 (USD MN)
Table 27 North America Business Class Seat Market, By Geography, 2013-2019 (USD MN)
Table 28 North America Premium Economy Class Seat Market, By Geography, 2013-2019 (USD MN)
Table 29 North America Economy Class Seat Market, By Geography, 2012–2018 (USD MN)
Table 30 North America Aircraft Seating Market, By Fit, 2013-2019 (USD MN)
Table 31 North America Commercial Aviation Aircraft Seating Line Fit Market, By Seat Type, 2013-2019 (USD MN)
Table 32 North America Commercial Aviation Aircraft Seating Retro Fit Market, By Seat Type, 2013-2019 (USD MN)
Table 33 North America Growth Measures, 2014
Table 34 North America Seating Market,By Geography, 2013-2019 (USD MN)
Table 35 U.S. Commercial Aviation Aircraft Seating Market, By Aircraft Type, 2013-2019 (USD MN)
Table 36 U.S. Commercial Aviation Aircraft Seating Market, By Seat Type, 2013-2019 (USD MN)
Table 37 U.S. Commercial Aviation Aircraft Seating Market, By Fit, 2013-2019 (USD MN)
Table 38 Canada Commercial Aviation Aircraft Seating Market, By Aircraft Type, 2013-2019 (USD MN)
Table 39 Canada Commercial Aviation Aircraft Seating Market, By Seat Type, 2013-2019 (USD MN)
Table 40 Canada Commercial Aviation Aircraft Seating Market, By Fit, 2013-2019 (USD MN)
Table 41 North America Commercial Aviation Aircraft Seating Market: Company Share Analysis, 2013 (%)
Table 42 North America Aircraft Seating Market: Mergers & Acquisitions
Table 43 North American Commercial Aviation Aircraft Seating Market: Expansions
Table 44 North American Commercial Aviation Aircraft Seating Market: Contracts
Table 45 North American Commercial Aviation Aircraft Seating Market: Joint Ventures
Table 46 B/E Aerospace, Inc.: Key Financials, 2009 - 2013 (USD MN)
Table 47 B/E Aerospace, Inc.: Key Operations Data, 2009-2013 (USD MN)
Table 48 Haeco Americas: Key Operations Data, 2009-2013 (USD MN)
Table 49 Zodiac Aerospace S.A.: Key Operations Data, 2009-2013 (USD MN)
Table 50 Zodiac Aerospace S.A.: Key Financials, 2009-2013 (USD MN)
Table 51 Recaro Aircraft Seating GMBH & Co. Kg: Key Operations Data, 2009-2013 (USD MN)
Table 52 Aviointeriors S.P.A.: Key Operations Data, 2009-2013 (USD MN)
Table 53 Zim Flugsitz GMBH: Key Operations Data, 2009-2013 (USD MN)
Table 54 Geven S.P.A.: Key Operations Data, 2009-2013 (USD MN)
List of Figures (55 Figures)
Figure 1 North America Aircraft Seating Market: Segmentation & Coverage
Figure 2 Commercial Aviation Aircraft Seating Market: Integrated Ecosystem
Figure 3 Research Methodology
Figure 4 Top-Down Approach
Figure 5 Bottom-Up Approach
Figure 6 Global Aircraft Deliveries Forecast (2014-2019)
Figure 7 Macro Indicator-Based Approach: (%)
Figure 8 North American Commercial Aviation Aircraft Seating Market Snapshot, 2014
Figure 9 Global Commercial Aviation Aircraft Seating Market: Growth Aspects
Figure 10 North America Aircraft Seating Market, By Aircraft Type, 2014 Vs. 2019
Figure 11 North America Commercial Aviation Aircraft Seating Types, By Geography, 2014 (USD MN)
Figure 12 North American Commercial Aviation Aircraft Seating Market, By Aircraft Type, 2014 Vs 2019 (USD MN)
Figure 13 Aircraft Deliveries
Figure 14 North American Commercial Aviation Aircraft Seating Market: Vendor Side Analysis, 2014
Figure 15 North American Commercial Aviation Aircraft Seating Market in Narrow Body Aircraft, By Geography, 2013 - 2019 (USD MN)
Figure 16 North America Commercial Aviation Aircraft Seating in Narrow Body Aircraft, By Seat Type, 2013-2019 (USD MN)
Figure 17 North America Commercial Aviation Aircraft Seating Market in Wide Body Aircraft, By Geography, 2013-2019 (USD MN)
Figure 18 North America Commercial Aviation Aircraft Seating in Wide Body Aircraft, By Seat Type, 2013-2019 (USD MN)
Figure 19 North America Aircraft Seating Market in Very Large Aircraft, By Geography, 2013-2019 (USD MN)
Figure 20 North America Commercial Aviation Aircraft Seating in Very Large Aircraft, By Seat Type, 2013-2019 (USD MN)
Figure 21 North American Commercial Aviation Aircraft Seating Market in BGA & RTA, By Geography, 2013-2019 (USD MN)
Figure 22 North America Commercial Aviation Aircraft Seating in BGA & RTA, By Seat Type, 2013-2019 (USD MN)
Figure 23 Sneak View: North America Aircraft Seating Market
Figure 24 North America Aircraft Seating Market, By Seat Type, 2014 Vs. 2019 (USD MN)
Figure 25 North America Commercial Aviation Aircraft Seating Market, By Seat Type, 2013-2019 (USD MN)
Figure 26 North American Commercial Aviation Aircraft Seating Market: Type Comparison With Cabin Interior Market, 2013–2019 (USD MN)
Figure 27 North America Suite Class Seat Market, By Geography, 2013–2019 (USD MN)
Figure 28 North America First Class Seat Market, By Geography, 2013-2019 (USD MN)
Figure 29 North America Business Class Seat Market, By Geography, 2013-2019 (USD MN)
Figure 30 North America Premium Economy Class Seat Market, By Geography, 2013-2019 (USD MN)
Figure 31 North America Economy Class Seat Market, By Geography, 2013–2019 (USD MN)
Figure 32 North American Aviation Aircraft Seating Market, By Fit, 2014 V/S 2019 (USD MN)
Figure 33 North American Aviation Aircraft Seating Market, By Line Fit, 2013-2019 (USD MN)
Figure 34 North American Aviation Aircraft Seating Market, By Retro Fit, 2013-2019 (USD MN)
Figure 35 North American Aviation Aircraft Seating Market: Growth Analysis, By Geography, 2014-2019 (USD MN)
Figure 36 Vendor Side Analysis
Figure 37 U.S. Commercial Aviation Aircraft Seating Market Overview, 2014 Vs. 2019 (%)
Figure 38 U.S. Commercial Aviation Aircraft Seating Market, By Aircraft Type, 2013-2019 (USD MN)
Figure 39 U.S. Commercial Aviation Aircraft Seating Market: Aircraft Type Snapshot
Figure 40 U.S. Commercial Aviation Aircraft Seating Market, By Seat Type, 2013-2019 (USD MN)
Figure 41 U.S. Commercial Aviation Aircraft Seating Market Share, By Seat Type, 2013-2019 (%)
Figure 42 U.S. Commercial Aviation Aircraft Seating Market, By Fit, 2013-2019 (USD MN)
Figure 43 U.S. Commercial Aviation Aircraft Seating Market: Fit Snapshot
Figure 44 Canada Commercial Aviation Aircraft Seating Market Overview, 2014 vs. 2019 (USD MN)
Figure 45 Canada Commercial Aviation Aircraft Seating Market, By Aircraft Type, 2013-2019 (USD MN)
Figure 46 Canada Commercial Aviation Aircraft Seating Market: Aircraft Type Snapshot
Figure 47 Canada Commercial Aviation Aircraft Seating Market, By Seat Type, 2013-2019 (USD MN)
Figure 48 Canada Commercial Aviation Aircraft Seating Market Share, By Seat Type, 2013-2019 (%)
Figure 49 Canada Commercial Aviation Aircraft Seating Market, By Fit, 2013-2019 (USD MN)
Figure 50 North America Commercial Aviation Aircraft Seating Market: Company Share Analysis, 2013 (%)
Figure 51 North American Aviation Aircraft Seating Market: Company Product Coverage, By Type, 2013
Figure 52 B/E Aerospace, Inc.: Revenue Mix, 2013 (%)
Figure 53 Contribution of Commercial Aircraft & Business Jet Segment Towards Company Revenues, 2009-2013 (USD MN)
Figure 54 Zodiac Aerospace S.A. Revenue Mix, 2013 (%)
Figure 55 Contribution of Aircraft Interiors Activities Segment Towards Company Revenues, 2009-2013 (USD MN)
The recovery of the aviation sector from 2007 to 2008 from the global economic crisis has helped the commercial aircraft manufacturers garner new orders. The manufacturers are increasing their aircraft production capacity along with innovative aircraft that is aimed at fuel efficiency. The industry is witnessing new entrants from emerging economies in the narrow body segment. These in turn act as a boon for the aircraft component manufacturers. An increase in orders for the existing models and new models are expected to enter the market. The global commercial aviation aircraft seating industry is expected to grow at a CAGR of 5.7% from 2014 to 2019.
The airlines are currently trying to tackle a major challenge-the rising fuel prices, which have forced the airlines to enhance their passenger carrying capacity in their seating configurations. There has been immense research and development in the areas of slimmer and lighter seats.
The North American commercial aviation aircraft seating market is currently valued at $3,038.6 million. The market is expected to grow in tandem with growth in the aviation sector. Existing delivery backlogs, rising demand for aircraft in the region, new aircraft models, and emerging aircraft manufacturers are the key drivers for the commercial aircraft seating manufacturing industry.
The North American commercial aviation aircraft seating market was valued at $3,038.6 million in 2014 and is projected to reach $3,546.8 million by the end of 2019 at a CAGR of 3.1% during the forecast period. The market, by aircraft type, was led by wide body aircraft (WBA) in 2014, with a share of 50.0%. The market for aircraft seats in WBA is projected to reach 1,773.4 million at a CAGR of 3.2% through the forecasted period. The suite class seating market is estimated to grow at the highest CAGR of 14.1% by 2019. The U.S. is a key market for commercial aviation aircraft seats in the North American region. The line fit segment held a greater share of the commercial aviation aircraft seats in the North American market in 2014.
Key players in the North American market include B/E Aerospace (U.S.), Zodiac Aerospace (France), and HAECO Americas (U.S.), among others.
Please visit https://www.micromarketmonitor.com/custom-research-services.html to specify your custom Research Requirement


