

North America Biopesticides Market by Submarket (Biofungicide, Bioherbicide, Bioinsecticide, Bionematicide), by Active Ingredient (Microbial, Biorational, Others), by Crop Type, by End-use, by Formulation, By Geography - Analysis and Forecast to 2019
- Publish Date: Apr 2015


The North America agriculture biopesticides market is estimated to grow at CAGR of 15.0% during the period of 2014 to 2019. Biopesticides include various types of crop protection products that are used on crops and plants to prevent the damage caused by pests and increase the crop yield. Biopesticides are eco-friendly products that include organic ingredients (microbes) for combating pests so as to prevent crop damage. Extensive damage caused by pests and the increasing population in both the developed and developing nations are the key drivers for the growth of this market.
Biopesticides provide various health benefits as they have minimal residual effect. Microbials, biorationals, and caramel are different types of commonly used active ingredients. Bioinsecticides, biofungicides, bioherbicides, and bionematicides are the major types of biopesticdes commercially available. The production cost of biopesticides depends on the economy of scale as well as the complexities in the production system.
North America agriculture biopesticides market is dominated by the U.S., followed by Mexico. The U.S.is considered as a saturated market for crop protection chemicals; however, the biopesticides market in this country is expected to witness growth in coming years. The demand for organic products is also increasing in this country, which will further drive the demand for biopesticides in crop production in coming years.
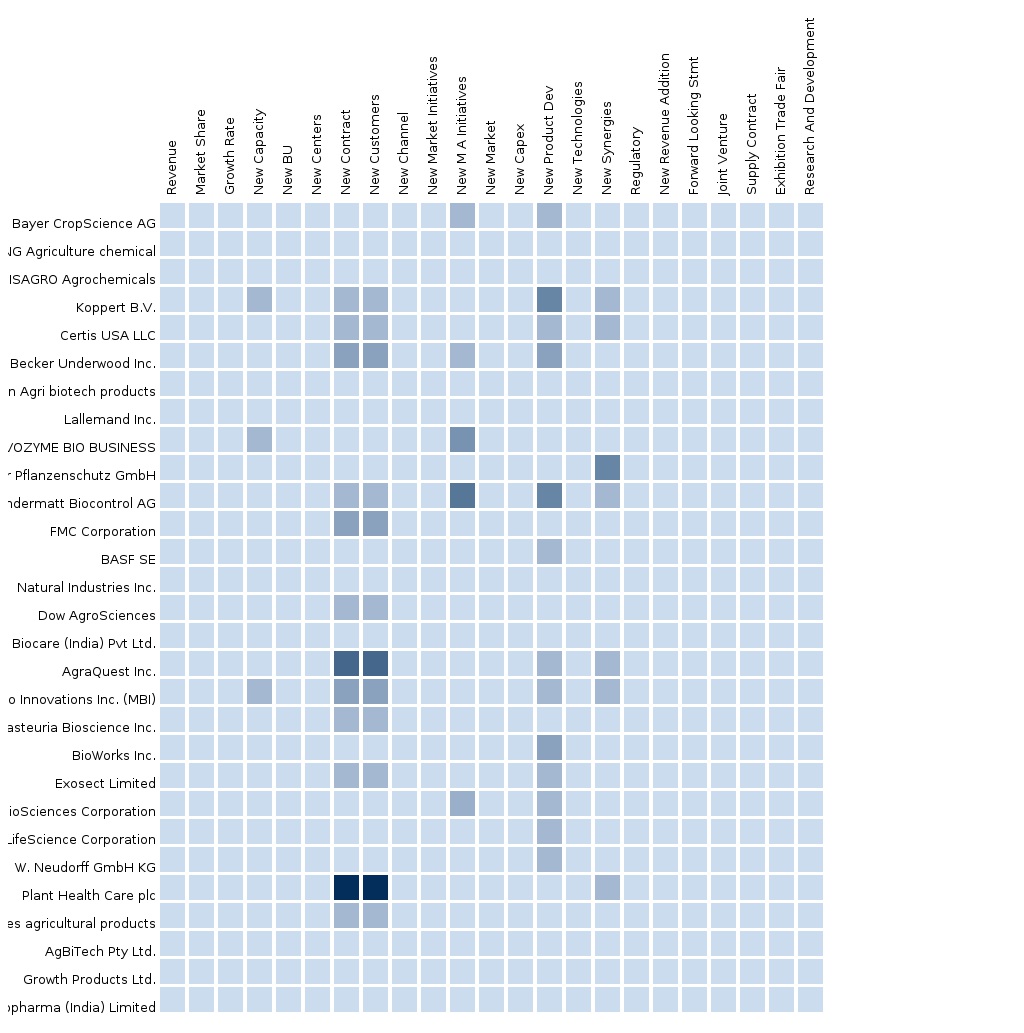
The North American biopesticides market is a competitive market, with various firms, such as Bayer AgroSciences AG (Switzerland), Novozymes A/S (Denmark), Koppert BV (Netherlands), and Plant Health Care PLC (U.S.) serving the market. Apart from these companies, there are a large numbers of small firms present in the North American market. These companies are expanding their market share in North America through new product development, partnerships, mergers & acquisitions, and facility expansion.
Scope of the Report
This research report categorizes the North America agriculture biopesticides market into the following segments and sub segments:
By Submarket
- Bioinsecticides
- Biofungicides
- Bioherbicides
- Bionematicides
- Others
By Active Ingredient
- Microbials
- Biorationals
- Others
By Crop Type
- Permanent Crops
- Arable crops
- Others
By End-use
- Seed Treatment
- On-farm
- Postharvest
By Formulation
- Liquid-based Formulations
- Water Dispersible Granules
- Wettable Powder
- Pellets
- Others
By Geography
- U.S.
- Canada
- Mexico
Table of Contents
1 Introduction (Page No. - 13)
1.1 Objectives of the Study
1.2 Market Segmentation & Coverage
1.3 Stakeholders
2 Research Methodology (Page No. - 16)
2.1 Integrated Ecosystem of Biopesticides Market
2.2 Arriving at the Biopesticides Market Size
2.2.1 Top-Down Approach
2.2.2 Bottom-Up Approach
2.2.3 Demand Side Approach
2.2.4 Macro Indicator-Based Approach
2.3 Assumptions
3 Executive Summary (Page No. - 24)
4 Market Overview (Page No. - 26)
4.1 Introduction
4.2 Biopesticides Market: Comparison With Parent Market
4.3 Market Drivers and Inhibitors
4.4 Key Market Dynamics
4.5 Demand Side Analysis
4.6 Vendor Side Analysis
5 North America Agriculture Boipesticides Market, By Source (Page No. - 35)
5.1 Introduction
5.2 North America Biopesticides Market, Source Comparison With Biologicals Market
5.3 North America Microbials Biopesticides Market, By Geography
5.4 North America Biorational Biopesticides Market, By Geography
6 North America Agriculture Biospesticides Market, By Application (Page No. - 42)
6.1 Introduction
6.2 Demand Side Analysis
6.3 Biopesticides in Permanent Crops, By Geography
6.4 Boipesticides in Arable Crops, By Geography
7 North America Agriculture Biopesticides Market, By End-Use (Page No. - 49)
7.1 Introduction
7.2 Biopesticides in On-Farm, By Geography
7.3 Biopesticides in Seed Treatment, By Geography
7.4 Biopesticides in Postharvest, By Geography
8 North America Agriculture Biopesticides Market, By Submarket (Page No. - 57)
8.1 Introduction
8.2 North America Biopesticides Market, Submarket Comparison With Agricultural Biologicals Market
8.3 North America Bioinsecticide Market, By Geography
8.4 North America Biofungicide Market, By Geography
8.5 North America Bioherbicide Market, By Geography
8.6 North America Bionematicide Market, By Geography
8.7 Sneak View: North America Biopesticides Market, By Submarket
9 North America Agriculture Biopesticides Market, By Formulation (Page No. - 68)
9.1 Introduction
9.2 North America Biopesticides Market, Formulation Comparison With Agricultural Biologicals Market
9.3 North America Liquid-Based Formulation Market, By Geography
9.4 North America Water Dispersible Granules Market, By Geography
9.5 North America Wettable Powder Market, By Geography
9.6 North America Pellets Market, By Geography
10 North America Agriculture Biopesticides Market, By Geography (Page No. - 79)
10.1 Introduction
10.2 U.S. Biopesticides Market
10.2.1 U.S. Biopesticides Market, By Source
10.2.2 U.S. Biopesticides Market, By Application
10.2.3 U.S. Biopesticides Market, By End-Use
10.2.4 U.S. Biopesticides Market, By Submarket
10.2.5 U.S. Biopesticides Market, By Formulation
10.3 Canada Biopesticides Market
10.3.1 Canada Biopesticides Market, By Source
10.3.2 Canada Biopesticides Market, By Application
10.3.3 Canada Biopesticides Market, By End-Use
10.3.4 Canada Biopesticides Market, By Submarket
10.3.5 Canada Biopesticides Market, By Formulation
10.4 Mexico Biopesticides Market
10.4.1 Mexico Biopesticides Market, By Source
10.4.2 Mexico Biopesticides Market, By Application
10.4.3 Mexico Biopesticides Market, By End-Use
10.4.4 Mexico Biopesticides Market, By Submarket
10.4.5 Mexico Biopesticides Market, By Formulation
11 Biopesticides Market: Competitive Landscape (Page No. - 115)
11.1 North America Biopesticides Market: Company Share Analysis
11.2 Mergers & Acquisitions
11.3 Expansions
11.4 Investments/New Product Development
11.5 Joint Ventures/Agreements/Strategic Alliances/Approvals
12 North America Agriculture Biopesticides Market, By Company (Page No. - 120)
(Overview, Financials, Products & Services, Strategy, and Developments)*
12.1 Isagro S.P.A
12.2 Bayer Cropscience AG
12.3 Novozymes A/S
12.4 Koppert B.V.
12.5 Marrone Bio Innovation Inc.
*Details on Overview, Financials, Product & Services, Strategy, and Developments Might Not be Captured in Case of Unlisted Company
13 Appendix (Page No. - 134)
13.1 Customization Options
13.1.1 Technical Analysis
13.1.2 Low-Cost Sourcing Locations
13.1.3 Regulatory Framework
13.1.4 Biopesticides Usage Data
13.1.5 Impact Analysis
13.1.6 Trade Analysis
13.1.7 Historical Data and Trends
13.2 Related Reports
13.3 Introducing RT: Real Time Market Intelligence
13.3.1 RT Snapshots
List of Tables (94 Tables)
Table 1 Global Biopesticides Peer Market Size, 2014 (USD MN)
Table 2 North America Biopesticides Application Market, 2014 (USD MN)
Table 3 North America Biopesticides Market: Macro Indicators, By Geography, 2014 (HA)
Table 4 North America Biopesticides Market: Comparison With Parent Market, 2013-2019 (USD MN)
Table 5 North America Boipesticides Market: Comparison With Parent Market, 2013-2019 (000’ HA)
Table 6 North America Biopesticides Market: Drivers and Inhibitors
Table 7 North America Biopesticides Market, By Application, 2013-2019 (USD MN)
Table 8 North America Biopesticides Market, By End-Use, 2013-2019 (000’ HA)
Table 9 North America Biopesticides Market, By Submarket, 2013-2019 (USD MN)
Table 10 North America Biopesticides Market, By Geography, 2013-2019 (USD MN)
Table 11 North America Biopesticides Market, By Geography, 2013-2019 (000’ HA)
Table 12 North America Biopesticides Market: Comparison With Application Markets, 2013-2019 (USD MN)
Table 13 North America Biopesticides Market, By Source, 2013-2019 (USD MN)
Table 14 North America Biopesticides Market, By Source, 2013-2019 (000’ HA)
Table 15 North America Biopesticides Market: Source Comparison With Parent Market, 2013-2019 (USD MN)
Table 16 North America Microbials Biopesticides Market, By Geography, 2013-2019 (USD MN)
Table 17 North America Microbials Biopesticides Market, By Geography, 2013-2019 (000’ HA)
Table 18 North America Biorational Biopesticides Market, By Geography, 2013-2019 (USD MN)
Table 19 North America Biorational Biopesticides Market, By Geography, 2013-2019 (000’ HA)
Table 20 North America Biopesticides Market, By Application, 2013-2019 (USD MN)
Table 21 North America Biopesticides Market, By Application, 2013-2019 (000’ HA)
Table 22 North America Biopesticides in Permanent Crops, By Geography, 2013-2019 (USD MN)
Table 23 North America Biopesticides in Permanent Crops, By Geography, 2013-2019 (000’ HA)
Table 24 North America Biopesticides Market in Arable Crops, By Geography, 2013-2019 (USD MN)
Table 25 North America Biopesticides Market in Arable Crops, By Geography, 2013-2019 (000’ HA)
Table 26 North America Biopesticides Market, By End-Use, 2013-2019 (USD MN)
Table 27 North America Biopesticides Market, By End-Use, 2013-2019 (000’ HA)
Table 28 North America Biopesticides Market in On-Farm, By Geography, 2013-2019 (USD MN)
Table 29 North America Biopesticides Market in On-Farm, By Geography, 2013-2019 (000’ HA)
Table 30 North America Biopesticides Market in Seed Treatment, By Geography, 2013-2019 (USD MN)
Table 31 North America Biopesticides Market in Seed Treatment, By Geography, 2013-2019 (000’ HA)
Table 32 North America Biopesticides Market in Postharvest, By Geography, 2013-2019 (USD MN)
Table 33 North America Biopesticides Market in Postharvest, By Geography, 2013-2019 (000’ HA)
Table 34 North America Boipesticides Market, By Submarket, 2013-2019 (USD MN)
Table 35 North America Biopesticides Market, By Submarket, 2013-2019 (000’ HA)
Table 36 North America Biopesticides Market: Submarket Comparison With Parent Market, 2013-2019 (USD MN)
Table 37 North America Bioinsecticide Market, By Geography, 2013-2019 (USD MN)
Table 38 North America Bioinsecticide Market, By Geography, 2013-2019 (000’ HA)
Table 39 North America Biofungicide Market, By Geography, 2013-2019 (USD MN)
Table 40 North America Biofungicide Market, By Geography, 2013-2019 (000’ HA)
Table 41 North America Bioherbicide Market, By Geography, 2013-2019 (USD MN)
Table 42 North America Bioherbicide Market, By Geography, 2013-2019 (000’ HA)
Table 43 North America Bionematicide Market, By Geography, 2013-2019 (USD MN)
Table 44 North America Bionematicide Market, By Geography, 2013-2019 (000’ HA)
Table 45 North America Boipesticides Market, By Formulation, 2013-2019 (USD MN)
Table 46 North America Biopesticides Market, By Formulation, 2013-2019 (000’ HA)
Table 47 North America Biopesticides Market: Submarket Comparison With Parent Market, 2013-2019 (USD MN)
Table 48 North America Liquid Based Formulation Market, By Geography, 2013-2019 (USD MN)
Table 49 North America Liquid-Based Formulation Market, By Geography, 2013-2019 (000’ HA)
Table 50 North America Water Dispersible Granules Market, By Geography, 2013-2019 (USD MN)
Table 51 North America Water Dispersible Granules Market, By Geography, 2013-2019 (000’ HA)
Table 52 North America Wettable Powder Market, By Geography, 2013-2019 (USD MN)
Table 53 North America Wettable Powder Market, By Geography, 2013-2019 (000’ HA)
Table 54 North America Pellets Market, By Geography, 2013-2019 (USD MN)
Table 55 North America Pellets Market, By Geography, 2013-2019 (000’ HA)
Table 56 North America Biopesticides Market, By Geography, 2013-2019 (USD MN)
Table 57 North America Biopesticides Market, By Geography, 2013-2019 (000’ HA)
Table 58 U.S. Biopesticides Market, By Source, 2013-2019 (USD MN)
Table 59 U.S. Biopesticides Market, By Source, 2013-2019, (000’ HA)
Table 60 U.S. Biopesticides Market, By Application, 2013-2019 (USD MN)
Table 61 U.S. Biopesticides Market, By Application, 2013-2019 (000’ HA)
Table 62 U.S. Biopesticides Market, By End-Use, 2013-2019 (USD MN)
Table 63 U.S. Biopesticides Market, By Submarket, 2013-2019 (USD MN)
Table 64 U.S. Biopesticides Market, By Submarket, 2013-2019 (000’ HA)
Table 65 U.S. Biopesticides Market, By Formulation, 2013-2019 (USD MN)
Table 66 U.S. Biopesticides Market, By Formulation, 2013-2019 (000’ HA)
Table 67 Canada Biopesticides Market, By Source, 2013-2019 (USD MN)
Table 68 Canada Biopesticides Market, By Source, 2013-2019 (000’ HA)
Table 69 Canada Biopesticides Market, By Application, 2013-2019 (USD MN)
Table 70 Canada Biopesticides Market, By Application, 2013-2019 (000’ HA)
Table 71 Canada Biopesticides Market, By End-Use, 2013-2019 (USD MN)
Table 72 Canada Biopesticides Market, By Submarket, 2013-2019 (USD MN)
Table 73 Canada Biopesticides Market, By Submarket, 2013-2019 (000’ HA)
Table 74 Canada Biopesticides Market, By Formulation, 2013-2019 (USD MN)
Table 75 Canada Biopesticides Market, By Formulation, 2013-2019 (000’ HA)
Table 76 Mexico Biopesticides Market, By Source, 2013-2019 (USD MN)
Table 77 Mexico Biopesticides Market, By Source, 2013-2019 (000’ HA)
Table 78 Mexico Biopesticides Market, By Application, 2013-2019 (USD MN)
Table 79 Mexico Biopesticides Market, By Application, 2013-2019 (000’ HA)
Table 80 Mexico Biopesticides Market, By End-Use, 2013-2019 (USD MN)
Table 81 Mexico Biopesticides Market, By Submarket, 2013-2019 (USD MN)
Table 82 Mexico Biopesticides Market, By Submarket, 2013-2019 (000’ HA)
Table 83 Mexico Biopesticides Market, By Formulation, 2013-2019 (USD MN)
Table 84 Mexico Biopesticides Market, By Formulation, 2013-2019 (000’ HA)
Table 85 North America Biopesticides Market: Company Share Analysis, 2014 (%)
Table 86 North America Biopesticides Market: Mergers & Acquisitions
Table 87 North America Biopesticides Market: Expansions
Table 88 North America Biopesticides Market: Investments and New Product Development
Table 89 North America Biopesticides Market: Joint Ventures/Agreements/Strategic Alliances/Approvals
Table 90 Isagro S.P.A: Annual Revenue, By Geography, 2019-2013 (USD MN)
Table 91 Isagro S.P.A: Annual Revenue, 2009-2013 (USD MN)
Table 92 Novozymes A/S: Annual Revenue, By Business Segment, 2009-2011 (USD MN)
Table 93 Novozymes A/S: Annual Revenue, By Business Geography, 2012-2013 (USD MN)
Table 94 Novozymes A/S: Annual Revenue, 2012-2013 (USD MN)
List of Figures (78 Figures)
Figure 1 North America Biopesticides Market: Segmentation & Coverage
Figure 2 Biopesticides Market: Integrated Ecosystem
Figure 3 Research Methodology
Figure 4 Top-Down Approach
Figure 5 Bottom-Up Approach
Figure 6 Demand Side Approach
Figure 7 Macro Indicator-Based Approach
Figure 8 North America Biopesticides Market Snapshot
Figure 9 Biopesticides Market: Growth Aspects
Figure 10 North America Biopesticides Market, By Application, 2014 vs. 2019
Figure 11 North America Boipesticides Submarkets, By Geography, 2014 (USD MN)
Figure 12 North America Biopesticides Market: Growth Analysis, By Formulation, 2014-2019 (%)
Figure 13 North America Biopesticides Market, By Source, 2013 & 2019 (USD MN)
Figure 14 North America Biopesticides Market, By Source, 2014 & 2019 (000’ HA)
Figure 15 North America Biopesticides Market: Source Comparison With Biologicals Market, 2013-2019 (USD MN)
Figure 16 North America Microbial Biopesticides Market, By Geography, 2013-2019 (USD MN)
Figure 17 North America Biorational Biopesticides, By Geography, 2013-2019 (USD MN)
Figure 18 North America Biopesticides Market, By Application, 2014-2019 (USD MN)
Figure 19 North America Biopesticides Market, By Application, 2014-2019 (000’ HA)
Figure 20 North America Biopesticides Market in Permanent Crops, By Geography, 2013-2019 (USD MN)
Figure 21 North America Boipesticides Market in Arable Crops, By Geography, 2013-2019 (USD MN)
Figure 22 North America Biopesticides Market, By End-Use, 2014 & 2019 (USD MN)
Figure 23 North America Biopesticides Market, By End-Use, 2014 & 2019 (000’ HA)
Figure 24 North America Biopesticides Market in On-Farm, By Geography, 2013-2019 (USD MN)
Figure 25 North America Biopesticides Market in Seed Treatment, By Geography, 2013-2019 (USD MN)
Figure 26 North America Biopesticides Market in Postharvest, By Geography, 2013-2019 (USD MN)
Figure 27 North America Biopesticides Market, By Submarket, 2013-2019 (USD MN)
Figure 28 North America Boipesticides Market, By Submarket, 2013-2019 (000 HA)
Figure 29 North America Biopesticides Market, Submarket Comparison With Agricultural Biologicals Market, 2013-2019 (USD MN)
Figure 30 North America Bioinsecticide Market, By Geography, 2013-2019 (USD MN)
Figure 31 North America Biofungicide Market, By Geography, 2013-2019 (USD MN)
Figure 32 North America Bioherbicide Market, By Geography, 2013-2019 (USD MN)
Figure 33 North America Bionematicide Market, By Geography, 2013-2019 (USD MN)
Figure 34 North America Biopesticide Market, By Formulation, 2013-2019 (USD MN)
Figure 35 North America Boipesticides Market, By Formulation, 2013-2019 (000’ HA)
Figure 36 North America Biopesticides Market: Active Ingredient Comparison With Agricultural Biologicals Market, 2013-2019 (USD MN)
Figure 37 North America Liquid-Based Formulation Market, By Geography, 2013-2019 (USD MN)
Figure 38 North America Water Dispersible Granules Market, By Geography, 2013-2019 (USD MN)
Figure 39 North America Wettable Powder Market, By Geography, 2013-2019 (USD MN)
Figure 40 North America Pellets Market, By Geography, 2013-2019 (USD MN)
Figure 41 North America Biopesticides Market: Growth Analysis, By Geography, 2014-2019 (USD MN)
Figure 42 North America Biopesticides Market: Growth Analysis, By Geography, 2014-2019 (000’ HA)
Figure 43 U.S. Biopesticides Market Overview, 2014 & 2019 (%)
Figure 44 U.S. Biopesticides Market, By Source, 2013-2019 (USD MN)
Figure 45 U.S. Biopesticides Market Share: By Source, 2014 & 2019
Figure 46 U.S. Biopesticides Market, By Application, 2013-2019 (USD MN)
Figure 47 U.S. Biopesticides Market: Application Snapshot
Figure 48 U.S. Biopesticides Market, By End-Use, 2013-2019 (USD MN)
Figure 49 U.S. Biopesticides Market: End-Use Snapshot
Figure 50 U.S. Biopesticides Market, By Submarket, 2013-2019 (USD MN)
Figure 51 U.S. Biopesticides Market Share: By Submarket, 2014 & 2019
Figure 52 U.S. Biopesticides Market, By Formulation, 2013-2019 (USD MN)
Figure 53 U.S. Biopesticides Market, By Formulation, 2014-2019 (%)
Figure 54 Canada Biopesticides Market Overview, 2014 & 2019 (%)
Figure 55 Canada Biopesticides Market, By Source, 2013-2019 (USD MN)
Figure 56 Canada Biopesticides Market Share: By Source, 2014 & 2019
Figure 57 Canada Biopesticides Market, By Application, 2013-2019 (USD MN)
Figure 58 Canada Biopesticides Market: Application Snapshot
Figure 59 Canada Biopesticides Market, By End-Use, 2013-2019 (USD MN)
Figure 60 Canada Biopesticides Market: End-Use Snapshot
Figure 61 Canada Biopesticides Market, By Submarket, 2013-2019 (USD MN)
Figure 62 Canada Biopesticides Market Share: By Submarket, 2014 & 2019
Figure 63 Canada Biopesticides Market, By Formulation, 2013-2019 (USD MN)
Figure 64 Canada Biopesticides Market, By Formulation, 2013-2018 (%)
Figure 65 Mexico Biopesticides Market Overview, 2014 & 2019 (%)
Figure 66 Mexico Biopesticides Market, By Source, 2013-2019 (USD MN)
Figure 67 Mexico Biopesticides Market Share: By Source 2014 & 2019
Figure 68 Mexico Biopesticides Market, By Application, 2013-2019 (USD MN)
Figure 69 Mexico Biopesticides Market: Application Snapshot
Figure 70 Mexico Biopesticides Market, By End-Use, 2013-2019 (USD MN)
Figure 71 Mexico Biopesticides Market: End-Use Snapshot
Figure 72 Mexico Biopesticides Market, By Submarket, 2013-2019 (USD MN)
Figure 73 Mexico Biopesticides Market Share: By Submarket, 2014 & 2019
Figure 74 Mexico Biopesticides Market, By Formulation, 2013-2019 (USD MN)
Figure 75 Mexico Biopesticides Market, By Formulation, 2014-2019 (%)
Figure 76 North America Biopesticides Market: Company Share Analysis, 2014 (%)
Figure 77 Isagro S.P.A: Revenue Mix, By Geography, 2013 (%)
Figure 78 Novozymes A/S Revenue Mix, 2013 (%)
Biopesticides (also known as biological pesticides) are pesticides derived from natural resources, such as animals, plants, bacteria, and certain minerals. In other words, biopesticides are biochemical pesticides that are made of naturally occurring substances that control pests through non-toxic mechanisms. For example, canola oil and baking soda have pesticidal applications and are considered biopesticides. These are eco-friendly and easy to use. Biopesticides are the key components of integrated pest management (IPM) programs, and are receiving much attention as a means to reduce the load of synthetic chemical products that are used in order to control plant diseases.
The purpose of this study is to analyze the North American market for biopesticides. This report includes revenue forecasts, along with market trends and opportunities for the period from 2014 to 2019. The analysis has been conducted on the various market segments derived on the basis of applications, types, end-uses, formulations, crop type, and geography.
The North America Biopesticides market was valued at $823.7 million in 2014, and is projected to reach $1,658.1 million by 2019, at a CAGR of 15.0% during the forecast period. The market, by formulations, was led by liquid-based formulation segment in 2014 with 46.0% share. In terms of type, the bioincesticides segment leads the market with the highest consumption.
Please visit https://www.micromarketmonitor.com/custom-research-services.html to specify your custom Research Requirement
| PRODUCT TITLE | PUBLISHED | |
|---|---|---|
|
|
Europe Agriculture Biologicals Market Biologicals-Europe and Agriculture Biopesticides Market, Bio... |
Upcoming |
|
|
Asia-Pacific Agriculture Biologicals Market Biologicals-Asia and Agriculture Biopesticides Market, Bio... |
Upcoming |
|
|
Latin America Agriculture Biologicals Market Biologicals-Latin America and Agriculture Biopesticides Market, Bio... |
Apr 2015 |
|
|
North America Agriculture Biologicals Market The North America agriculture biologicals market was valued at $1,409.07 million in 2014 and is projected to reach $2,758.24 million by 2019 at a CAGR of 14.4% during the forecast period. The market, by application is led by cereals and grains in 2014. In North America, U.S. has the largest share in the agriculture biologicals market. It constitutes of 72.47% of North America agriculture biologicals market. The biopesticides are mostly consumed in North America than other biological types. |
May 2015 |


