

North America Active & Passive Fire Protection Systems Market By Application (Commercial, Industrial, Infrastructural, Residential), By Service (Engineering Service, Installation & Design, Service & Maintenance, Managed Service), By Type, By Vertical, and By Geography - Analysis & Forecast To 2020
- Publish Date: Jul 2016
- Number of Pages: 151


The North America active & passive fire protection systems market is estimated to grow at a CAGR of 7.0% during the forecast period. There have been increasing incidences of fire in the region. In order to prevent such incidents, the demand for advanced fire protection systems has increased in recent years. This increasing demand has given rise to the demand for technologies used in detection equipment, alarms, sensing, and monitoring equipment during fire. Industry verticals such as oil & gas, mining, and energy & power have shown significant growth of the fire protection systems market in North America, owing to the need for effective fire control and protection equipment in these industries.
Stringent government regulations and infrastructural developments are driving the market for passive fire protection systems. High-rise buildings need fire protection systems. Thus, strict fire and safety codes are being implemented in order to mitigate risks and losses caused by fire. Major countries such as the U.S. and Canada in the North American region are developed economies. These countries have high population growth rate as compared to the developing countries in the region. This has resulted in major infrastructural developments in the region. Hence, North America accounted for the largest market share of the overall fire protection systems market in 2015. However, this share is expected to decline by 2020. The prime cause for this decline would be the growth of the fire protection systems market in the Asia-Pacific region.
Enterprises across the globe have increased their spending on installation of fire protection equipment to safeguard infrastructure and to reduce loss of human lives. Enterprises rely on equipment such as sensors & detectors, fire alarm systems, control panels, interfaces, and communication devices to install fire protection systems in their premises. Increase in the number of enterprises and SMEs in North America is expected to drive the fire protection systems market in the region.
United Technologies Corporation, Siemens AG, Bosch Security Systems, and Tyco International Limited dominated the North America active & passive fire protection systems market in 2014. United Technologies Corporation is one of the dominating players in the North America active & passive fire protection market. It has introduced innovative products in the market, and its strong research and development capabilities give it a competitive edge over its competitors. Companies such as United Technologies and Honeywell provide fire protection systems in the North American region.
Scope of the Report
This research report categorizes the North America active & passive fire protection market into the following segments and subsegments:
North America Active & passive Fire Protection Market Size and Forecast, By Vertical
- Academia and Institutional
- Banking, Financial Services, and Insurance (BFSI)
- Consumer Goods and Retail
- Energy and Power
- Government
- Healthcare
- Manufacturing
- Transportation And Logistics
- Oil, Gas, And Mining
- Others
North America Active & passive Fire Protection Market Size and Forecast, By Application
- Commercial
- Industrial
- Infrastructural
- Residential
North America Active Fire Protection Market Size and Forecast, By Type
- Component
- Fire Detection Market
- Fire Management Market
- Fire Analysis Market
- Fire Response Market
- Sprinklers Market
- Fire Extinguisher Market
- Hoses And Nozzles Market
- Emergency Lighting Market
- Service
- Engineering Services Market
- Installation and Design Market
- Services and Maintenance Market
- Managed Services Market
North America Passive Fire Protection Market Size and Forecast, By Type
- Component
- Ceilings, Floors, and Roofs Market
- Fire Resistant Walls & Glass Market
- Coats, Paints & Sprays Market
- Service
- Engineering Services Market
- Installation and Design Market
- Services and Maintenance Market
- Managed Services Market
North America Active & Passive Fire Protection Market Size and Forecast, By Geography
- United States (U.S.)
- Canada
Table of Contents
1 Introduction
1.1 Objectives of the Study
1.2 Market Segmentation & Coverage
1.3 Stakeholders
2 Research Methodology
2.1 Integrated Ecosystem of Active Fire Protection Systems Market
2.2 Integrated Ecosystem of Passive Fire Protection Systems Market
2.3 Arriving at the Fire Protection Systems Market Size
2.3.1 Top-Down Approach
2.3.2 Bottom-Up Approach
2.3.3 Demand Side Approach
2.3.4 Macroindicator-Based Approach
2.4 Assumptions
3 Executive Summary
4 Market Overview
4.1 Introduction
4.2 Active Fire Protection Systems Market: Comparison With Parent Market
4.3 Passive Fire Protection Systems Market: Comparison With Parent Market
4.4 Market Drivers and Inhibitors: Active Fire Protection Systems
4.5 Market Drivers and Inhibitors: Passive Fire Protection Systems
4.6 Key Market Dynamics
4.7 Demand Side Analysis
5 North America Active Fire Protection Systems Market, By Vertical
5.1 Introduction
5.2 Demand Side Analysis
5.3 North America Active Fire Protection Systems Market in Oil & Gas, and Mining, By Geography
5.4 North America Active Fire Protection Systems Market in Transportation and Logistics, By Geography
5.5 North America Active Fire Protection Systems Market in Manufacturing,By Geography
5.6 North America Active Fire Protection Systems Market in Energy and Power, By Geography
5.7 North America Active Fire Protection Systems Market in Healthcare, By Geography
5.8 North America Active Fire Protection Systems Market in Government, By Geography
5.9 North America Active Fire Protection Systems Market in Consumer Goods and Retail, By Geography
5.10 North America Active Fire Protection Systems Market in Academia and Institutional, By Geography
5.11 North America Active Fire Protection Systems Market in Bfsi, By Geography
6 North America Passive Fire Protection Systems Market, By Application
6.1 Introduction
6.2 North America Passive Fire Protection Systems Market in Commercial, By Geography
6.3 North America Passive Fire Protection Systems Market in Industrial, By Geography
6.4 North America Passive Fire Protection Systems Market in Infrastructural, By Geography
6.5 North America Passive Fire Protection Systems Market in Residential, By Geography
7 North America Active Fire Protection Systems Market, By Type
7.1 Introduction
7.2 North America Active Fire Protection Systems Market: Type Comparison With Security Market
7.3 North America Active Fire Protection System Market, By Component
7.3.1 North America Active Fire Detection Component Market, By Geography
7.3.2 North America Fire Management Market, By Geography
7.3.3 North America Fire Analysis Market, By Geography
7.3.4 North America Fire Response Market, By Geography
7.3.4.1 North America Fire Response Market, By Sub-Segment
7.3.4.1.1 Introduction
7.3.4.1.1.1 North America Sprinklers Market, By Geography
7.3.4.1.1.2 North America Fire Extinguisher Market, By Geography
7.3.4.1.1.3 North America Hoses and Nozzles Market, By Geography
7.3.4.1.1.4 North America Emergency Lighting Market, By Geography
7.4 North America Active Fire Protection System Market, By Service
7.4.1 Introduction
7.4.2 North America Engineering Service Market, By Geography
7.4.3 North America Installation and Design Market, By Geography
7.4.4 North America Service and Maintenance Market, By Geography
7.4.5 North America Managed Service Market, By Geography
7.5 Sneak View: North America Active Fire Protection Systems Market, By Component
7.6 Sneak View: North America Active Fire Protection Systems Market, By Service
8 North America Passive Fire Protection Systems Market, By Type
8.1 Introduction
8.2 North America Passive Fire Protection Systems Market: Type Comparison With Security Market
8.3 North America Passive Fire Protection Systems Market, By Component
8.3.1 North America Ceilings, Floors, and Roofs Market, By Geography
8.3.2 North America Fire Resistant Walls & Glass Market, By Geography
8.3.3 North America Coats, Paints & Sprays Market, By Geography
8.4 North America Passive Fire Protection System Market, By Service
8.4.1 North America Installation and Design Market, By Geography
8.4.2 North America Engineering Services Market, By Geography
8.4.3 North America Service and Maintenance Market, By Geography
8.4.4 North America Managed Service Market, By Geography
9 North America Active Fire Protection Systems Market, By Geography
9.1 Introduction
9.2 U.S. Active Fire Protection Systems Market
9.2.1 U.S. Active Fire Protection Systems Market, By Vertical
9.2.2 U.S. Active Fire Protection Systems Market, By Type
9.2.3 U.S. Active Fire Protection Systems Market, By Region
9.2.3.1 Introduction
9.2.3.2 U.S. Active Fire Protection Systems Market, By Region
9.3 Canada Active Fire Protection Systems Market
9.3.1 Canada Active Fire Protection Systems Market, By Industry Vertical
9.3.2 Canada Active Fire Protection Systems Market, By Type
10 North America Passive Fire Protection Systems Market, By Geography
10.1 Introduction
10.2 U.S. Passive Fire Protection Systems Market
10.2.1 U.S. Passive Fire Protection Systems Market, By Application
10.2.2 U.S. Passive Fire Protection Systems Market, By Type
10.3 Canada Passive Fire Protection Systems Market
10.3.1 Canada Passive Fire Protection Systems Market, By Application
10.3.2 Canada Passive Fire Protection Systems Market, By Type
11 North America Fire Protection Systems Market: Competitive Landscape
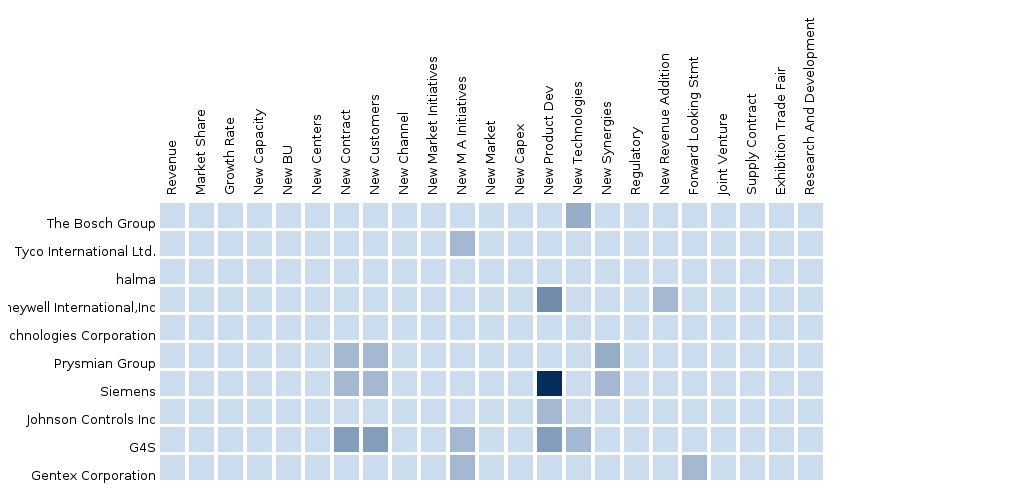
11.1 Company Presence in Fire Protection Systems Market, By Component
11.2 Mergers & Acquisitions
11.3 Joint Ventures
11.4 New Product Launches
11.5 Expansions
11.6 New Product Development
12 North America Fire Protection Systems Market, By Company
(Overview, Financials, Products & Services, Strategy, and Developments)*
12.1 United Technologies Corporation
12.2 Siemens Ag
12.3 Bosch Security Systems
12.4 Tyco International Limited
12.5 Johnson Controls, Inc.
*Details on Overview, Financials, Product & Services, Strategy, and Developments Might Not Be Captured in Case of Unlisted Company
13 Appendix
13.1 Customization Options
13.1.1 Solutions Matrix
13.1.2 Competitive Benchmarking
13.1.3 Vendor Landscaping
13.1.4 Data Tracker
13.1.5 Emerging Vendor Landscape
13.1.6 Channel Analysis
13.2 Related Reports
13.3 Introducing Rt: Real-Time Market Intelligence
13.3.1 Rt Snapshots
List of Tables
Table 1 Global Fire Protection Systems Peer Market Size, 2014 (USD Bn)
Table 2 North America Ict Expenditure: Industry Verticals, 2015 (USD Mn)
Table 3 North America Fire Protection Systems Market: Macroindicators, By Geography, 2015 (USD Mn)
Table 4 North America Active Fire Protection Systems Market: Comparison With Parent Market, 2014–2020 (USD Mn)
Table 5 North America Passive Fire Protection Systems Market: Comparison With Parent Market, 2014–2020 (USD Mn)
Table 6 North America Active Fire Protection Systems Market: Drivers and Inhibitors
Table 7 North America Passive Fire Protection Systems Market: Drivers and Inhibitors
Table 8 North America Active Fire Protection Systems Market, By Vertical, 2014–2020 (USD Mn)
Table 9 North America Active Fire Protection Systems Market, By Geography, 2014–2020 (USD Mn)
Table 10 North America Fire Protection Systems Market: Comparison With Industry Verticals, 2014–2020 (USD Mn)
Table 11 North America Fire Active Protection Systems Market, By Vertical, 2014–2020 (USD Mn)
Table 12 North America Active Fire Protection Systems Market in Oil & Gas, and Mining, By Geography, 2014–2020 (USD Mn)
Table 13 North America Active Fire Protection Systems Market in Transportation and Logistics, By Geography, 2014–2020 (USD Mn)
Table 14 North America Active Fire Protection Systems Market in Manufacturing, By Geography, 2014–2020 (USD Mn)
Table 15 North America Active Fire Protection Systems Market in Energy and Power, By Geography, 2014–2020 (USD Mn)
Table 16 North America Active Fire Protection Systems Market in Healthcare, By Geography, 2014–2020 (USD Mn)
Table 17 North America Active Fire Protection Systems Market in Government, By Geography, 2014–2020 (USD Mn)
Table 18 North America Active Fire Protection Systems Market in Consumer Goods and Retail, By Geography, 2014–2020 (USD Mn)
Table 19 North America Active Fire Protection Systems Market in Academia and Institutional, By Geography, 2014–2020 (USD Mn)
Table 20 North America Active Fire Protection Systems Market in Bfsi, By Geography, 2014–2020 (USD Mn)
Table 21 North America Passive Fire Protection Systems Market, By Application, 2014–2020 (USD Mn)
Table 22 North America Passive Fire Protection Systems Market in Commercial, By Geography, 2014–2020 (USD Mn)
Table 23 North America Passive Fire Protection Systems Market in Industrial, By Geography, 2014–2020 (USD Mn)
Table 24 North America Passive Fire Protection Systems Market in Infrastructural, By Geography, 2014–2020 (USD Mn)
Table 25 North America Passive Fire Protection Systems Market in Residential, By Geography, 2014–2020 (USD Mn)
Table 26 North America Fire Protection Systems Market, By Type, 2014–2020 (USD Mn)
Table 27 North America Active Fire Protection Systems Market: Type Comparison With Parent Market, 2014–2020 (USD Mn)
Table 28 North America Active Fire Protection Systems Component Market, By Segment, 2014–2020 (USD Mn)
Table 29 North America Active Fire Protection Systems Component Market, By Geography, 2014–2020 (USD Mn)
Table 30 North America Fire Detection Market: By Geography, 2014–2020 (USD Mn)
Table 31 North America Fire Management Market, By Geography, 2014–2020 (USD Mn)
Table 32 North America Fire Analysis Market: By Geography, 2014–2020 (USD Mn)
Table 33 North America Fire Response Market, By Geography, 2014–2020 (USD Mn)
Table 34 North America Fire Protection Market, By Type, 2014–2020 (USD Mn)
Table 35 North America Sprinklers Market: By Geography, 2014–2020 (USD Mn)
Table 36 North America Fire Extinguisher Market: By Geography, 2014–2020 (USD Mn)
Table 37 North America Hoses and Nozzles Market: By Geography, 2014–2020 (USD Mn)
Table 38 North America Emergency Lighting Market, By Geography, 2014 – 2020 (USD Mn)
Table 39 North America Active Fire Protection Systems Service Market, By Segment, 2014–2020 (USD Mn)
Table 40 North America Active Fire Protection Systems Service Market, By Geography, 2014–2020 (USD Mn)
Table 41 North America Engineering Service Market: By Geography, 2014–2020 (USD Mn)
Table 42 North America Installation and Design Market: By Geography, 2014–2020 (USD Mn)
Table 43 North America Service and Maintenance Market: By Geography, 2014–2020 (USD Mn)
Table 44 North America Managed Service Market, By Geography, 2014 – 2020 (USD Mn)
Table 45 North America Fire Protection Systems Market, By Type, 2014–2020 (USD Mn)
Table 46 North America Passive Fire Protection Systems Market: Type Comparison With Parent Market, 2014–2020 (USD Mn)
Table 47 North America Passive Fire Protection Systems Component Market, By Segment, 2014–2020 (USD Mn)
Table 48 North America Passive Fire Protection Systems Component Market, By Geography, 2014–2020 (USD Mn)
Table 49 North America Ceilings, Floors, and Roofs Market, By Geography, 2014–2020 (USD Mn)
Table 50 North America Fire Resistant Walls & Glass Market, By Geography, 2014–2020 (USD Mn)
Table 51 North America Coats, Paints & Sprays Market, By Geography, 2014–2020 (USD Mn)
Table 52 North America Passive Fire Protection Systems Service Market, By Segment, 2014–2020 (USD Mn)
Table 53 North America Passive Fire Protection Systems Service Market, By Geography, 2014–2020 (USD Mn)
Table 54 North America Installation and Design Market, By Geography, 2014–2020 (USD Mn)
Table 55 North America Engineering Services Market, By Geography, 2014–2020 (USD Mn)
Table 56 North America Service and Maintenance Market, By Geography, 2014–2020 (USD Mn)
Table 57 North America Managed Service Market, By Geography, 2014–2020 (USD Mn)
Table 58 North America Active Fire Protection Systems Market: Growth Analysis By Geography, 2014–2020 (USD Mn)
Table 59 U.S. Active Fire Protection Systems Market, By Vertical, 2014–2020 (USD Mn)
Table 60 U.S. Active Fire Protection Systems Market, By Type, 2014–2020 (USD Mn)
Table 61 U.S. Active Fire Protection Systems Market, By South Region, 2014–2020 (USD Mn)
Table 62 U.S. Active Fire Protection Systems Market, By Midwest Region, 2014–2020 (USD Mn)
Table 63 U.S. Active Fire Protection Systems Market, By Northeast Region, 2014–2020 (USD Mn)
Table 64 U.S. Active Fire Protection Systems Market, By West Region, 2014–2020 (USD Mn)
Table 65 Canada Active Fire Protection Systems Market, By Vertical, 2015–2020 (USD Mn)
Table 66 Canada Active Fire Protection Systems Market, By Type, 2014–2020 (USD Mn)
Table 67 North America Passive Fire Protection Systems Market: Growth Analysis By Geography, 2014–2020 (USD Mn)
Table 68 U.S. Passive Fire Protection Systems Market, By Application, 2014–2020 (USD Mn)
Table 69 U.S. Passive Fire Protection Systems Market, By Type, 2014–2020 (USD Mn)
Table 70 Canada Passive Fire Protection Systems Market, By Application, 2014–2020 (USD Mn)
Table 71 Canada Passive Fire Protection Systems Market, By Type, 2014–2020 (USD Mn)
Table 72 North America Fire Protection Systems Market: Mergers & Acquisitions
Table 73 North America Fire Protection Systems: Joint Ventures
Table 74 North America Fire Protection Systems: New Product Launches
Table 75 North America Fire Protection Systems Market: Expansions
Table 76 North America Fire Protection Systems Market: New Product Development
Table 77 United Technologies Corporation : Key Financials, 2011-2014 (USD Mn)
Table 78 United Technologies Corporation : Key Financials, By Geography, 2011-2014 (USD Mn)
Table 79 United Technologies Corporation: By Business Segment, 2011-2014 (USD Mn)
Table 80 Siemens Ag: Revenue, Key Financials, 2011–2014 (USD Mn)
Table 81 Siemens Ag: Revenue, By Business Segment, 2011–2014 (USD Mn)
Table 82 Siemens Ag: Revenue, By Geography, 2011–2014 (USD Mn)
Table 83 Tyco International Limited: Revenue, Key Financials,2011–2014 (USD Mn)
Table 84 Tyco International Limited: Revenue, By Business Segment, 2011–2014 (USD Mn)
Table 85 Tyco International Limited: Revenue, By Geography, 2011–2014 (USD Mn)
Table 86 Johnson Controls, Inc.: Key Financials, 2011–2014 (USD Mn)
Table 87 Johnson Controls, Inc.: Business Revenue Mix, 2011–2014 (USD Mn)
Table 88 Johnson Controls, Inc.: Geographic Revenue Mix, 2011–2014 (USD Mn)
List of Figures
Figure 1 North America Active Fire Protection Systems Market: Segmentation & Coverage
Figure 2 North America Passive Fire Protection Systems Market: Segmentation & Coverage
Figure 3 Active Fire Protection Systems Market: Integrated Ecosystem
Figure 4 Passive Fire Protection Systems Market: Integrated Ecosystem
Figure 5 Research Methodology
Figure 6 Top-Down Approach
Figure 7 Bottom-Up Approach
Figure 8 Demand Side Approach
Figure 9 Macroindicator-Based Approach, 2015
Figure 10 North America Active Fire Protection Systems Market: Snapshot
Figure 11 North America Passive Fire Protection Systems Market: Snapshot
Figure 12 North America Active Fire Protection Systems Market, By Vertical, 2015 & 2020 (USD Mn)
Figure 13 North America Active Fire Protection Systems Type Market, By Geography, 2015 (USD Mn)
Figure 14 North America Fire Protection Systems Market: Demand Side Analysis, 2015-2020 Value Growth Rate (%)
Figure 15 Fire Protection Systems : Verticals Market Scenario
Figure 16 North America Active Fire Protection Systems Market, By Vertical,2015 & 2020 (USD Mn)
Figure 17 Demand Side Analysis: Oil & Gas, and Mining
Figure 18 Demand Side Analysis: Transportation and Logistics
Figure 19 Demand Side Analysis: Manufacturing
Figure 20 Demand Side Analysis: Energy and Power
Figure 21 Demand Side Analysis: Healthcare
Figure 22 Demand Side Analysis: Government
Figure 23 Demand Side Analysis: Consumer Goods and Retail
Figure 24 Demand Side Analysis: Academia and Institutional
Figure 25 Demand Side Analysis: Banking, Financial Services, and Insurance
Figure 26 North America Active Fire Protection Systems Market: Oil & Gas, and Mining, By Geography, 2014–2020 (USD Mn)
Figure 27 North America Active Fire Protection Systems Market in Transportation and Logistics, By Geography, 2014–2020 (USD Mn)
Figure 28 North America Active Fire Protection Systems Market in Manufacturing,By Geography, 2014–2020 (USD Mn)
Figure 29 North America Active Fire Protection Systems Market in Energy and Power, By Geography, 2014–2020 (USD Mn)
Figure 30 North America Active Fire Protection Systems Market in Healthcare,By Geography, 2014–2020 (USD Mn)
Figure 31 North America Active Fire Protection Systems Market in Government,By Geography, 2014–2020 (USD Mn)
Figure 32 North America Active Fire Protection Systems Market in Consumer Goods and Retail, By Geography, 2014–2020 (USD Mn)
Figure 33 North America Active Fire Protection Systems Market in Academia and Institutional, By Geography, 2014–2020 (USD Mn)
Figure 34 North America Active Fire Protection Systems Market in Bfsi, By Geography,2014–2020 (USD Mn)
Figure 35 North America Passive Fire Protection Systems Market, By Application, 2015 & 2020 (USD Mn)
Figure 36 North America Passive Fire Protection Systems Market in Commercial, By Geography, 2014–2020 (USD Mn)
Figure 37 North America Passive Fire Protection Systems Market in Industrial, By Geography, 2014–2020 (USD Mn)
Figure 38 North America Passive Fire Protection Systems Market in Infrastructural, By Geography, 2014–2020 (USD Mn)
Figure 39 North America Passive Fire Protection Systems Market in Residential, By Geography, 2014–2020 (USD Mn)
Figure 40 North America Fire Protection Systems Market, By Type, 2014 & 2020 (USD Mn)
Figure 41 North America Active Fire Protection Systems Market: Type Comparison With Security Market, 2014–2020 (USD Mn)
Figure 42 North America Active Fire Protection System, Overview, 2015 & 2020 (USD Mn)
Figure 43 North America Fire Detection Component Market, By Geography,2014–2020 (USD Mn)
Figure 44 North America Fire Management Market, By Geography, 2014–2020 (USD Mn)
Figure 45 North America Fire Analysis Market, By Geography, 2014–2020 (USD Mn)
Figure 46 North America Fire Response Market, By Geography, 2014–2020 (USD Mn)
Figure 47 North America Fire Response Market, By Sub-Segment, 2014–2020 (USD Mn)
Figure 48 North America Sprinklers Market, By Geography, 2014–2020 (USD Mn)
Figure 49 North America Fire Extinguisher Market, By Geography, 2014–2020 (USD Mn)
Figure 50 North America Hoses and Nozzles Market, By Geography, 2014–2020 (USD Mn)
Figure 51 North America Emergency Lighting Market, By Geography, 2014–2020 (USD Mn)
Figure 52 North America Engineering Service Market, By Geography, 2014–2020 (USD Mn)
Figure 53 North America Installation and Design Market, By Geography, 2014–2020 (USD Mn)
Figure 54 North America Service and Maintenance Market, By Geography, 2014–2020 (USD Mn)
Figure 55 North America Managed Service Market, By Geography, 2014–2020 (USD Mn)
Figure 56 Sneak View: North America Fire Protection Systems Market, By Component
Figure 57 Sneak View: North America Fire Protection Systems Market, By Service
Figure 58 North America Passive Fire Protection Systems Market, By Type, 2015 & 2020 (USD Mn)
Figure 59 North America Passive Fire Protection Systems Market: Type Comparison With Security Market, 2015–2020 (USD Mn)
Figure 60 North America Passive Fire Protection Systems Market, Overview, 2015 & 2020 (USD Mn)
Figure 61 North America Ceilings, Floors, and Roofs Market, By Geography, 2014–2020 (USD Mn)
Figure 62 North America Fire Resistant Walls & Glass Market, By Geography, 2014–2020 (USD Mn)
Figure 63 North America Coats, Paints & Sprays Market, By Geography, 2014–2020 (USD Mn)
Figure 64 North America Passive Fire Protection Systems Market, Overview, 2015 & 2020 (USD Mn)
Figure 65 North America Installation and Design Market, By Geography, 2014–2020 (USD Mn)
Figure 66 North America Engineering Services Market, By Geography, 2014–2020 (USD Mn)
Figure 67 North America Service and Maintenance Market, By Geography, 2014–2020 (USD Mn)
Figure 68 North America Managed Service Market, By Geography, 2014–2020 (USD Mn)
Figure 69 North America Active Fire Protection Systems Market, Growth Analysis, By Geography, 2015–2020 (USD Mn)
Figure 70 U.S. Active Fire Protection Systems Market Overview, 2015 & 2020 (%)
Figure 71 U.S. Active Fire Protection Systems Market, By Vertical, 2014–2020 (USD Mn)
Figure 72 U.S. Active Fire Protection Systems Market, Application Snapshot
Figure 73 U.S. Active Fire Protection Systems Market, By Type, 2014–2020 (USD Mn)
Figure 74 U.S. Active Fire Protection Systems Market Share, By Component, 2015 & 2020 (%)
Figure 75 U.S Active Fire Protection Systems Market, By Region, 2015 & 2020 (USD Mn)
Figure 76 Canada Active Fire Protection Systems Market Overview, 2015 & 2020 (%)
Figure 77 Canada Fire Protection Systems Market, By Industry Vertical, 2014–2020 (USD Mn)
Figure 78 Canada Active Fire Protection Systems Market: Application Snapshot
Figure 79 Canada Active Fire Protection Systems Market, By Type, 2014–2020 (USD Mn)
Figure 80 Canada Fire Protection Systems Market Share, By Component, 2015 Vs 2020 (%)
Figure 81 North America Passive Fire Protection Systems Market, Growth Analysis, By Geography, 2015–2020 (USD Mn)
Figure 82 U.S. Passive Fire Protection Systems Market Overview, 2015 & 2020 (%)
Figure 83 U.S. Passive Fire Protection Systems Market, By Application, 2014–2020 (USD Mn)
Figure 84 U.S. Passive Fire Protection Systems Market: Application Snapshot
Figure 85 U.S. Passive Fire Protection Systems Market, By Type, 2014–2020 (USD Mn)
Figure 86 U.S. Passive Fire Protection Systems Market Share, By Component, 2015 & 2020 (%)
Figure 87 Canada Passive Fire Protection Systems Market Overview, 2015 & 2020 (%)
Figure 88 Canada Passive Fire Protection Systems Market, By Application, 2014–2020 (USD Mn)
Figure 89 Canada Passive Fire Protection Systems Market: Application Snapshot
Figure 90 Canada Passive Fire Protection Systems Market, By Type, 2014–2020 (USD Mn)
Figure 91 Canada Passive Fire Protection Systems Market Share, By Component, 2015 & 2020 (%)
Figure 92 Fire Protection Systems Market, Company Product Coverage, By Component, 2014
Figure 93 United Technologies Corporation Fire and Security: Revenue Mix, By Region, 2014
Figure 94 Siemens Ag: Revenue Mix, 2014 (%)
Figure 95 Tyco International Limited: Revenue Mix, 2014 (%)
Figure 96 Johnson Controls, Inc., Revenue Mix, 2014 (%)
Increase in spending towards protection of assets from fire and development of infrastructure have led to the growth of the fire protection systems market. Enterprises across the globe have increased their spending on fire protection equipment to safeguard infrastructure and to reduce loss of human lives. Technologies, such as human machine interface solutions, smart building, wireless sensory networks, and nanotechnology, are being launched in the fire protection systems market. Moreover, advanced sensors have been developed to give accurate data to control units. Intelligent sensors have networking capabilities, wherein a group of sensors and detectors can communicate easily through control units, leading to increased efficiency of systems. Distant users can access these intelligent sensors by connecting through LAN/WAN networks.
Financial loss and loss of human lives in the North America has given rise to an urgent need for fire protection systems in the region. The market is expected to grow in North America due to the increase in technological advancements. Many new equipment and technologies have been developed for the North American fire protection systems market. Renovations and developments of infrastructure in recent years have mandatory fire safety codes issued by the government. It is expected that enterprises in North America will invest in installation of fire safety equipment on a major scale, owing to the fire safety regulations and obligations laid down by government agencies.
Certain industry verticals, such as oil & gas, mining, and energy & power have witnessed growth in the fire protection systems market. This growth can be attributed to the necessity to adhere to stringent corporate regulation for these sectors, which are estimated to account for a major share in the North American fire protection systems market.
The North American active fire protection systems market was valued at USD 20,505.7 million in 2015, and is projected to grow at a CAGR of 7.0%, during the forecast period. The fire protection systems market has been segmented into component and service. The fire protection systems market, by component, was valued at USD 13,241.8 million in 2015 and is projected to reach USD 18,044.6 million by 2020, at a CAGR of 6.4% during the forecast period. The fire protection systems market, by service, was valued at USD 7,264.0 million in 2015 and is projected to reach USD 10,687.5 million by 2020, at a CAGR of 8.0% during the forecast period. The services and maintenance segment accounted for the largest market share in the overall service market in 2015.
The active fire protection systems market in the U.S. was valued at USD 15,303.7 million in 2015 and is estimated to grow at a CAGR of 6.2% during the forecast period. The U.S. market has been divided into four major region, namely, South, Midwest, Northeast, and West. Furthermore, the market in South U.S. recorded the highest value. It was valued at USD 4,202.1 million in 2015 and is projected to reach USD 5,526.0 million by 2020, at a CAGR of 5.6% during the forecast period.
The North American passive fire protection systems market was valued at USD 12,116.6 million in 2015 and is projected to grow at a CAGR of 12.0% during the forecast period. The passive fire protection systems market has been divided into component and service. The North American passive fire protection systems market, by component, was valued at USD 8,082.2 million in 2015 and is projected to reach USD 13,074.0 million by 2020, at a CAGR of 10.1% during the forecast period. By service, the passive fire protection systems market was valued at USD 4,034.4 million in 2015 and is estimated to reach USD 8,299.7 million by 2020, at a CAGR of 15.5% during the forecast period. The installation and design segment is expected to account for the largest market share in the overall service segment of the North American passive fire protection systems market by 2020.
Please visit https://www.micromarketmonitor.com/custom-research-services.html to specify your custom Research Requirement


