

Latin America Biostimulants Market by End-User (Row Crops, Fruits & Vegetables, Turfs & Ornamentals), by Mode of Application (Foliar, Seed, Soil), by Active Ingredients (Acid-based, Extracts-based), by Geography - Analysis and Forecast to 2019
- Publish Date: May 2015


The Latin American biostimulants market is estimated to grow at a CAGR of 17.5% during the forecast period of 2014 to 2019. Plant biostimulants contain substance(s) and/or micro-organisms whose function when applied to plants or the rhizosphere is to stimulate natural processes to enhance/benefit nutrient uptake, nutrient efficiency, tolerance to abiotic stress, and crop quality. Biostimulants have no direct action against pests, and therefore do not fall within the regulatory framework of pesticides.
Biostimulants have evolved into major agricultural inputs for sustainable crop production. These products were mostly used for the cultivation of horticultural products; but their usage has become essential for all key row crops such as rice, wheat, corn, sugarcane, and soybean. Acid based and extracts based biostimulants are the key types available in the market, with the acid based biostimulants being the most commonly used types in the Latin American region.
The Latin American biostimulants market is dominated by Brazil, followed by Argentina. In Brazil, the adoption of sustainable farming practices and organic ingredients, to improve the quality of the produce, has driven the market in this country and resulted in a high market value. The market in Brazil constituted 42.0% of the Latin American market in 2014.
The Latin American biostimulants market is a competitive market, with many firms such as Taminco Corp. (Belgium), Isagro S.p.A (Italy), Valagro S.p.A (Italy), Koppert B.V. (Netherlands), and Italpollina S.p.A (Italy) adopting different strategies to expand their market share in the Latin American region. To gain a large market share, these companies are adopting innovative product developments, partnerships, mergers & acquisitions, and expansion of existing facilities.
Scope of the Report
This research report categorizes the Latin American biostimulants market into the following segments and sub-segments:
Latin America Biostimulants Market, By Active Ingredient
- Acids
- Extracts
- Others
Latin America Biostimulants Market, By End-User
- Turf & Ornamental Crops
- Row Crops
- Fruits & Vegetables
- Others
Latin America Biostimulants Market, By Mode of Application
- Foliar
- Seed
- Soil
Latin America Biostimulants Market, By Geography
- Brazil
- Argentina
- Others
Table of Contents
1 Introduction (Page No. - 10)
1.1 Objectives of the Study
1.2 Market Segmentation & Coverage
1.3 Stakeholders
2 Research Methodology (Page No. - 12)
2.1 Integrated Ecosystem of Biostimulants Market
2.2 Arriving at the Biostimulants Market Size
2.2.1 Top-Down Approach
2.2.2 Bottom-Up Approach
2.2.3 Demand Side Approach
2.2.4 Macroindicator-Based Approach
2.3 Assumptions
3 Executive Summary (Page No. - 20)
4 Market Overview (Page No. - 22)
4.1 Introduction
4.2 Biostimulants Market: Comparison With Parent Market
4.3 Market Drivers and Inhibitors
4.4 Key Market Dynamics
4.5 Demand Side Analysis
5 Latin America Biostimulants Market, By End-User (Page No. - 31)
5.1 Introduction
5.2 Biostimulants in Row Crops, By Geogralphy
5.3 Biostimulants in Fruits & Vegetables, By Geography
5.4 Biostimulants in Turf and Ornamentals, By Geography
6 Latin America Biostimulants Market, By Mode of Application (Page No. - 39)
6.1 Introduction
6.2 Biostimulants in Foliar, By Geography
6.3 Biostimulants in Soil, By Geography
6.4 Biostimulants in Seed, By Geography
7 Latin America Biostimulants Market, By Active Ingredient (Page No. - 47)
7.1 Introduction
7.2 Latin America Biostimulants Market: Active Ingredients Comparison With Biologicals Market
7.3 Latin America Acid Based Biostimulants Market, By Geography
7.4 Latin America Extracts Based Biostimulants Market, By Geography
7.5 Sneak View: Latin America Fertilizers Market, By Active Ingredient
8 Latin America Biostimulants Market, By Geography (Page No. - 55)
8.1 Introduction
8.2 Brazil Biostimulants Market
8.2.1 Brazil Biostimulants Market, By Mode of Application
8.2.2 Brazil Biostimulants Market, By End-User
8.2.3 Brazil Biostimulants Market, By Active Ingredient
8.3 Argentina Biostimulants Market
8.3.1 Argentina Biostimulants Market, By Mode of Application
8.3.2 Argentina Biostimulants Market, By End-User
8.3.3 Argentina Biostimulants Market, By Active Ingredient
9 Latin America Biostimulants Market: Competitive Landscape (Page No. - 71)
9.1 Latin America Biostimulants Market: Company Share Analysis
9.2 Company Presence in Biostimulants Market, By Active Ingredient
9.3 Mergers & Acquisitions
9.4 Expansions
9.5 Investments
9.6 Joint Ventures
10 Latin America Biostimulants Market, By Company (Page No. - 76)
(Overview, Financials, Products & Services, Strategy, and Developments)*
10.1 Isagro S.P.A
10.2 Taminco Corporation
10.3 Valagro S.P.A
10.4 Koppert B.V.
10.5 Biostadt India Limited
*Details On Overview, Financials, Product & Services, Strategy, and Developments Might Not Be Captured in Case of Unlisted Company
11 Appendix (Page No. - 89)
11.1 Customization Options
11.1.1 Technical Analysis
11.1.2 Low-Cost Sourcing Locations
11.1.3 Regulatory Framework
11.1.4 Impact Analysis
11.1.5 Trade Analysis
11.1.6 Historical Data and Trends
11.2 Related Reports
11.3 Introducing RT: Real Time Market Intelligence
11.3.1 RT Snapshots
List of Tables (59 Tables)
Table 1 Global Biostimulants Peer Market Size, 2014 (USD MN)
Table 2 Latin America Biostimulants: End-User Markets, 2014 (000’ HA)
Table 3 Latin America Biostimulants Market: Macroindicators, By Geography, 2014 (Ha)
Table 4 Latin America Biostimulants Market: Comparison With Parent Market, 2013–2019 (USD MN)
Table 5 Latin America Biostimulants Market: Comparison With Parent Market, 2013–2019 (000’ HA)
Table 6 Latin America Biostimulants Market: Drivers and Inhibitors
Table 7 Latin America Biostimulants Market, By Mode of Application,2013-2019 (USD MN)
Table 8 Latin America Biostimulants Market, By Mode of Application,2013-2019 (000’ HA)
Table 9 Latin America Biostimulants Market, By Active Ingredients,2013-2019 (USD MN)
Table 10 Latin America Biostimulants Market, Active Ingredients, 2013-2019 (000’HA)
Table 11 Latin America Biostimulants Market, By Geography, 2013-2019 (USD MN)
Table 12 Latin America Biostimulants Market, By Geography, 2013-2019 (000’ HA)
Table 13 Latin America Biostimulants Market: Comparison With End-User Markets, 2013-2019 (USD MN)
Table 14 Latin America Biostimulants Market, By End-User, 2013-2019 (USD MN)
Table 15 Latin America Biostimulants Market, By End-User, 2013-2019 (000’ HA)
Table 16 Latin America Biostimulants in Row Crops, By Geography,2013-2019 (USD MN)
Table 17 Latin America Biostimulants in Row Crops, By Geography,2013-2019 (000’ HA)
Table 18 Latin America Biostimulants in Fruits & Vegetables, By Geography,2013-2019 (USD MN)
Table 19 Latin America Biostimulants in Fruits & Vegetables, By Geography,2013-2019 (000’ HA)
Table 20 Latin America Biostimulants in Turf and Ornamentals, By Geography, 2013-2019 (USD MN)
Table 21 Latin America Biostimulants in Turf and Ornamentals, By Geography, 2013-2019 (000’ HA)
Table 22 Latin America Biostimulants Market, By Mode of Application,2013-2019 (USD MN)
Table 23 Latin America Biostimulants: Market, By Mode of Application,2013-2019 (000’ HA)
Table 24 Latin America Biostimulants in Foliar, By Geography, 2013-2019 (USD MN)
Table 25 Latin America Biostimulants in Foliar, By Geography, 2013-2019 (000’ HA)
Table 26 Latin America Biostimulants in Soil, By Geography, 2013-2019 (USD MN)
Table 27 Latin America Biostimulants in Soil, By Geography, 2013-2019 (000’ HA)
Table 28 Latin America Biostimulants in Seed, By Geography, 2013-2019 (USD MN)
Table 29 Latin America Biostimulants in Seed, By Geography, 2013-2019 (000’ HA)
Table 30 Latin America Biostimulants Market, By Active Ingredient,2013-2019 (USD MN)
Table 31 Latin America Biostimulants Market, By Active Ingredient,2013-2019 (000’ HA)
Table 32 Latin America Biostimulants Market: Active Ingredients Comparison With Parent Market, 2013–2019 (USD MN)
Table 33 Latin America Acid Based Biostimulants Market, By Geography,2013–2019 (USD MN)
Table 34 Latin America Acid Based Biostimulants Market, By Geography,2013–2019 (000’ HA)
Table 35 Latin America Extracts Based Biostimulants Market, By Geography,2013-2019 (USD MN)
Table 36 Latin America Extracts Based Biostimulants Fertilizers Market,By Geography, 2013-2019 (000’ HA)
Table 37 Latin America Biostimulants Market, By Geography, 2013-2019 (USD MN)
Table 38 Latin America Biostimulants Market, By Geography, 2013-2019 (000’ HA)
Table 39 Brazil Biostimulants Market, By Mode of Application, 2013–2019 (USD MN)
Table 40 Brazil Biostimulants Market, By Mode of Application, 2013–2019 (000’ HA)
Table 41 Brazil Biostimulants Market, By End-User, 2013–2019 (USD MN)
Table 42 Brazil Biostimulants Market, By End-User, 2013–2019 (000’ HA)
Table 43 Brazil Biostimulants Market, By Active Ingredient, 2013-2019 (USD MN)
Table 44 Brazil Biostimulants Market, By Active Ingredient, 2013-2019 (000’ HA)
Table 45 Argentina Biostimulants Market, By Mode of Application,2013-2019 (USD MN)
Table 46 Argentina Biostimulants Market, By Mode of Application,2013-2019 (000’ HA)
Table 47 Argentina Biostimulants Market, By End-User, 2013–2019 (USD MN)
Table 48 Argentina Biostimulants Market, By End-User, 2013–2019 (000’ HA)
Table 49 Argentina Biostimulants Market, By Active Ingredient, 2013-2019 (USD MN)
Table 50 Argentina Biostimulants Market, By Active Ingredient, 2013-2019 (000’ HA)
Table 51 Latin America Biostimulants Market: Company Share Analysis, 2014 (%)
Table 52 Latin America Biostimulants Market: Mergers & Acquisitions
Table 53 Latin American Biostimulants Market: Expansions
Table 54 Latin American Biostimulants Market: Investments
Table 55 Latin American Biostimulants Market: Joint Ventures
Table 56 Isagro S.P.A: Key Operations Data, 2009–2013 (USD MN)
Table 57 Isagro S.P.A: 2009–2013 (USD MN)
Table 58 Taminco Corporation: Key Operations Data, 2010-2014 (USD MN)
Table 59 Taminco Corporations: Key Financials, 2010-2014 (USD MN)
List of Figures (47 Figures)
Figure 1 Latin America Biostimulants Market: Segmentation & Coverage
Figure 2 Biostimulants Market: Integrated Ecosystem
Figure 3 Research Methodology
Figure 4 Top-Down Approach
Figure 5 Bottom-Up Approach
Figure 6 Demand Side Approach
Figure 7 Macroindicator-Based Approach
Figure 8 Latin America Biostimulants Market: Snapshot
Figure 9 Biostimulants Market: Growth Aspects
Figure 10 Latin America Biostimulants Market, By Application, 2014-2019
Figure 11 Latin America Biostimulants Active Ingredients, By Geography,2014 (USD MN)
Figure 12 Latin America Biostimulants Market: Growth Analysis, Active Ingredients, 2014–2019 (%)
Figure 13 Latin America Biostimulants Market, By End-User, 2014-2019 (USD MN)
Figure 14 Latin America Biostimulants Market, By End-User, 2014-2019 (000’ HA)
Figure 15 Latin America Biostimulants Market in Row Crops, By Geography,2013-2019 (USD MN)
Figure 16 Latin America Biostimulants Market in Fruits & Vegetables, By Geography, 2013-2019 (USD MN)
Figure 17 Latin America Biostimulants Market in Turf and Ornamentals,By Geography, 2013-2019 (USD MN)
Figure 18 Biostimulants Market: Mode of Application Scenario
Figure 19 Latin America Biostimulants Market, By Mode of Application,2014-2019 (USD MN)
Figure 20 Latin America Biostimulants Market, By Mode of Application,2014-2019 (000’ HA)
Figure 21 Latin America Biostimulants Market in Foliar, By Geography,2013-2019 (USD MN)
Figure 22 Latin America Biostimulants Market in Soil, By Geography,2013-2019 (USD MN)
Figure 23 Latin America Biostimulants Market in Seed, By Geography,2013-2019 (USD MN)
Figure 24 Latin America Biostimulants Market, By Active Ingredient,2013-2019 (USD MN)
Figure 25 Latin America Biostimulants Market, By Active Ingredient,2014-2019 (000’ HA)
Figure 26 Latin America Biostimulants Market: Active Ingredients Comparison With Biologicals Market, 2013–2019 (USD MN)
Figure 27 Latin America Acid Based Biostimulants Market, By Geography,2013–2019 (USD MN)
Figure 28 Latin America Extracts Based Biostimulants Market, By Geography,2013-2019 (USD MN)
Figure 29 Latin America Biostimulants Market: Growth Analysis, By Geography, 2014–2019 (USD MN)
Figure 30 Latin America Biostimulants Market: Growth Analysis, By Geography, 2014–2019 (000’ HA)
Figure 31 Brazil Biostimulants Market Overview, 2014 & 2019 (%)
Figure 32 Brazil Biostimulants Market, By Mode of Application, 2013–2019 (USD MN)
Figure 33 Brazil Biostimulants Market: Mode of Application Snapshot
Figure 34 Brazil Biostimulants Market, By End-User, 2013–2019 (USD MN)
Figure 35 Brazil Biostimulants Market: End-User Snapshot
Figure 36 Brazil Biostimulants Market, By Active Ingredient, 2013-2019 (USD MN)
Figure 37 Brazil Biostimulants Market, By Active Ingredient, 2014 &2019 (%)
Figure 38 Argentina Biostimulants Market Overview, 2014 & 2019 (%)
Figure 39 Argentina Biostimulants Market, By Mode of Application,2013–2019 (USD MN)
Figure 40 Argentina Biostimulants Market: Mode of Application Snapshot
Figure 41 Argentina Biostimulants Market, By End-User, 2013–2019 (USD MN)
Figure 42 Argentina Biostimulants Market: End-User Snapshot
Figure 43 Argentina Biostimulants Market, By Active Ingredient, 2013-2019 (USD MN)
Figure 44 Argentina Biostimulants Market, By Active Ingredient, 2014 &2019 (%)
Figure 45 Latin America Biostimulants Market: Company Share Analysis, 2014 (%)
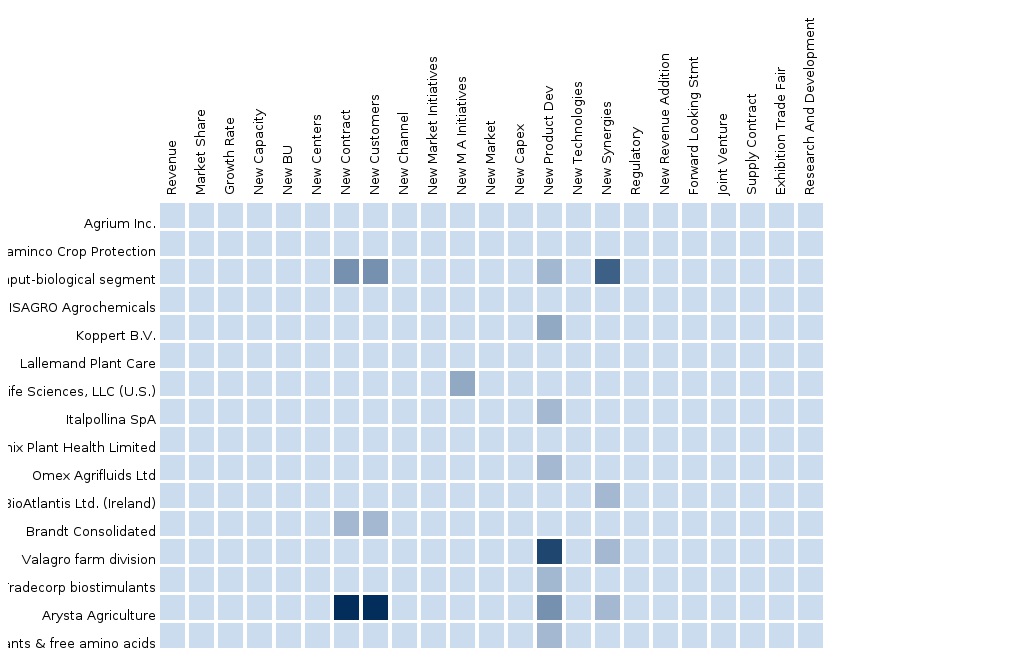
Figure 46 Latin America Biostimulants: Company Product Coverage, By Active Ingredient, 2014
Figure 47 Taminco Corporation: Revenue Mix, 2014 (%)
Biostimulants have evolved into major agricultural inputs for sustainable crop production. These products were mostly used for the cultivation of horticultural products; but their usage has become essential for all key row crops such as rice, wheat, corn, sugarcane, and soybean. The definition of biostimulants is expected to constantly change with regard to its organic nature and the type of active ingredients used.
The biostimulants market in Latin America is projected to grow at the fastest CAGR during the given forecast period, as compared to the other major regions. The increasing demand for organic products; the environmental hazards caused due to agrochemicals; and the rising need to increase the agriculture production to meet the requirements of the ever-growing population are among the key factors driving the biostimulants market in this region.
The purpose of this study is to analyze the Latin America market for biostimulants. This report includes revenue forecasts, and market trends and opportunities for the period from 2014 to 2019. The analysis has been conducted on the various market segments derived on the basis of end-uses of biostimulants and further segmented on the basis of biostimulants types (based on active ingredients).
The Latin American biostimulants market was valued at $196.7 million in 2014 and is projected to reach $441.2 million by 2019, at a CAGR of 17.5% from 2014 to 2019. The market, by active ingredients, was led by the acid based biostimulants segment in 2014 with a 55.0% share of the overall market.
The Latin American biostimulants market is a competitive market; some of the major players in this market include Taminco Corp. (Belgium), Isagro S.p.A (Italy), Valagro S.p.A (Italy), Koppert B.V. (Netherlands), and Italpollina S.p.A (Italy), among others, who are adopting different strategies to expand their market shares in the Latin American region. To gain a large market share and to sustain their positions in the market, these companies are adopting innovative product developments, partnerships, mergers & acquisitions, and expansion of existing facilities.
Please visit https://www.micromarketmonitor.com/custom-research-services.html to specify your custom Research Requirement
| PRODUCT TITLE | PUBLISHED | |
|---|---|---|
|
|
Europe Agriculture Biologicals Market Biologicals-Europe and Agriculture Biopesticides Market, Bio... |
Upcoming |
|
|
Asia-Pacific Agriculture Biologicals Market Biologicals-Asia and Agriculture Biopesticides Market, Bio... |
Upcoming |
|
|
Latin America Agriculture Biologicals Market Biologicals-Latin America and Agriculture Biopesticides Market, Bio... |
Apr 2015 |
|
|
North America Agriculture Biologicals Market The North America agriculture biologicals market was valued at $1,409.07 million in 2014 and is projected to reach $2,758.24 million by 2019 at a CAGR of 14.4% during the forecast period. The market, by application is led by cereals and grains in 2014. In North America, U.S. has the largest share in the agriculture biologicals market. It constitutes of 72.47% of North America agriculture biologicals market. The biopesticides are mostly consumed in North America than other biological types. |
May 2015 |


