

Latin America Agricultural Micronutrients Market: By Application (Soil, Foliar, Fertigation, Others), Form (Chelated, Non-Chelated), Crop Type (Cereals, Oilseeds & Pulses, Fruits & Vegetables, Others), Type, Geography - Forecasts to 2020
- Publish Date: Apr 2016
- Number of Pages: 145


The market for agricultural micronutrients in Latin America is expected to witness high growth during the forecast period. As such, the manufacturers of agricultural micronutrients are focusing on research & development activities to produce new formulations of agricultural micronutrients, along with the development of innovative application methods for efficient delivery of agricultural micronutrients. Increased deficiency of micronutrients in soil and shrinking of agricultural land in Latin America are the factors leading towards adoption of new methods of agriculture by farmers to increase their crop yields so as to meet the growing demand for nutritional food. Growing awareness among farmers about benefits of agricultural micronutrients is also one of the major reasons for the increasing demand for agricultural micronutrients.
The crop types include fruits & vegetables, cereals, oilseeds & pulses, and others. Molybdenum dominates the type segment of Latin America agricultural micronutrients market. Soil application mode is a key application mode along with fertigation and others. Brazil, Argentina, and Colombia are the three largest markets for agricultural micronutrients in Latin America. In 2014, Brazil recorded the highest consumption of agricultural micronutrients in the Latin American region, due to economic development taking place in the country. It is expected that Brazil will continue to showcase immense potential for usage of agricultural micronutrients in coming years as well.
This market research study provides a detailed qualitative and quantitative analysis of the Latin America agricultural micronutrients market. Various secondary sources, such as encyclopedia, directories, industry journals, and databases are used to identify and collect information useful for this extensive commercial study of the agricultural micronutrients market. The primary sources include experts from related industries and suppliers who have been interviewed to obtain and verify critical information as well as to assess the future prospects of the market.
Competitive scenarios of the players in the Latin America agricultural micronutrients market have been discussed in detail. Key players of this industry with their recent developments and other strategic industry activities are also covered in the report. BASF SE (Germany), AkzoNobel N.V. (Netherlands), Yara International ASA (Norway), and The Mosaic Company (U.S.) are some of the important players of this market.
1 Introduction
1.1 Objectives Of The Study
1.2 Market Segmentation & Coverage
1.3 Stakeholders
2 Research Methodology
2.1 Secondary Data
2.2 Primary Data
2.2.1 Key Data From Primary Sources
2.2.2 Key Industry Insights
2.2.3 Breakdown Of Primary Interviews: By Company Type, Designation,
2.3 Market Size Estimation
2.4 Market Breakdown & Data Triangulation
2.5 Market Share Estimation
2.6 Research Assumptions & Limitations
2.6.1 Assumptions
2.6.2 Limitations
3 Executive Summary
4 Premium Insights
4.1 Attractive Opportunities In The Latin America Agricultural Micronutrients Market
4.2 Latin America Agricultural Micronutrients Market, By Application
4.3 Latin America Agricultural Micronutrients Market, By Type
4.4 Latin America Agricultural Micronutrients Market, By Form
4.5 Latin America Agricultural Micronutrients Market, By Geography
4.6 Life Cycle Analysis, By Country
5 Market Overview
5.1 Introduction
5.2 Market Segmentation
5.2.1 Latin America Agricultural Micronutrients Market, By Application
5.3 Market Drivers And Inhibitors
5.4 Opportunities
5.4.1 Technology Upgradation
5.5 Challenges
5.5.1 High Prices Of Micronutrient Supplements
6 Industry Trends
6.1 Value Chain Analysis
6.2 Supply Chain Analysis
6.3 Porter’s Five Forces Analysis
6.3.1 Intensity Of Competitive Rivalry
6.3.2 Bargaining Power Of Suppliers
6.3.3 Bargaining Power Of Buyers
6.3.4 Threat Of New Entrants
6.3.5 Threat Of Substitutes
7 Latin America Agricultural Micronutrients Market, By Application
7.1 Introduction
7.2 Latin America Agricultural Nutrients Market In Soil, By Geography
7.3 Latin America Agricultural Nutrients Market In Foliar Application, By Geography
7.4 Latin America Agricultural Nutrients Market In Fertigation, By Geography
7.5 Latin America Agricultural Nutrients Market In Others Application Mode, By Geography
8 Latin America Agricultural Micronutrients Market, By Crop Type
8.1 Introduction
8.2 Cereals & Grains
8.3 Oilseeds & Pulses
8.4 Fruits & Vegetables
8.5 Other Crops
9 Latin America Agricultural Micronutrients Market, By Type
9.1 Introduction
9.2 Latin America Zinc Agriculture Micronutrients Market, By Country
9.3 Latin America Copper Agricultural Micronutrients Market, By Country
9.4 Latin America Iron Agricultural Micronutrients Market, By Country
9.5 Latin America Manganese Agricultural Micronutrients Market, By Country
9.6 Latin America Boron Agricultural Micronutrients Market, By Country
9.7 Latin America Molybdenum Agricultural Micronutrients Market, By Country
9.8 Latin America Other Agricultural Micronutrients Market, By Country
10 Latin America Agricultural Micronutrients Market, By Form
10.1 Introduction
10.2 Chelated
10.3 Non-Chelated
11 Latin America Agricultural Micronutrients Market, By Geography
11.1 Introduction
11.2 Brazil Agricultural Micronutrients Market
11.2.1 Brazil Agricultural Micronutrients Market, By Type
11.2.2 Brazil Agricultural Micronutrients Market, By Application
11.2.3 Brazil Agricultural Micronutrients Market, By Crop Type
11.2.4 Brazil Agricultural Micronutrients Market, By Form (USD Million)
11.3 Argentina Agricultural Micronutrients Market
11.3.1 Argentina Agricultural Micronutrients Market, By Type
11.3.2 Argentina Agricultural Micronutrients Market, By Application
11.3.3 Argentina Agricultural Micronutrients Market, By Crop Type
11.3.4 Argentina Agricultural Micronutrients Market, By Form
11.4 Colombia Agricultural Micronutrients Market
11.4.1 Colombia Agricultural Micronutrients Market, By Type
11.4.2 Colombia Agricultural Micronutrients Market, By Application
11.4.3 Colombia Agricultural Micronutrients Market, By Crop Type
11.4.4 Colombia Agricultural Micronutrients Market, By Form
11.5 Other Countries Agricultural Micronutrients Market
11.5.1 Other Countries Agricultural Micronutrients Market, By Type
11.5.2 Other Countries Agricultural Micronutrients Market, Application Snapshot
11.5.3 Other Countries Agricultural Micronutrients Market, Crop Type Snapshot
11.5.4 Other Countries Agricultural Micronutrients Market, By Form
12 Latin America Agricultural Micronutrients : Competitive Landscape
12.1 Industry Coverage
12.2 New Product Developments
12.3 Mergers & Acquisitions
12.4 Agreements
12.5 Expansions
13 Latin America Agricultural Nutrients Market, By Company
13.1 Agrium Inc.
13.1.1 Overview
13.1.2 Key Financials
13.1.3 Product And Service Offerings
13.1.4 Related Developments
13.1.5 MMM View
13.2 Akzonobel N.V.
13.2.1 Overview
13.2.2 Key Financials
13.2.3 Product And Service Offerings
13.2.4 Related Developments
13.2.5 MMM View
13.3 BASF Se
13.3.1 Overview
13.3.2 Key Financials
13.3.3 Product And Service Offerings
13.3.4 Related Developments
13.3.5 MMM View
13.4 Auriga Industries A/S
13.4.1 Overview
13.4.2 Key Financials
13.4.3 Product And Service Offerings
13.4.4 Related Developments
13.4.5 MMM View
13.5 The Mosaic Company
13.5.1 Overview
13.5.2 Key Financials
13.5.3 Product And Service Offerings
13.5.4 Related Developments
13.5.5 MMM View
13.6 Haifa Chemicals
13.6.1 Overview
13.6.2 Key Financials
13.6.3 Product And Service Offerings
13.6.4 Related Developments
13.6.5 MMM View
13.7 Coromandel International Ltd.
13.7.1 Overview
13.7.2 Key Financials
13.7.3 Product And Service Offerings
13.7.4 Related Developments
13.7.5 MMM View
14 Appendix
14.1 Customization Options
14.1.1 Technical Analysis
14.1.2 Low-Cost Sourcing Locations
14.1.3 Regulatory Framework
14.1.4 Agricultural Micronutrients Usage Data
14.1.5 Impact Analysis
14.1.6 Trade Analysis
14.1.7 Historical Data And Trends
14.2 Related Reports
14.3 Introducing Rt: Real-Time Market Intelligence
14.3.1 Rt Snapshots
List Of Tables
Table 2 Latin America Agricultural Nutrients Market, By Application, 2013-2020 (USD Million)
Table 3 Latin America Agricultural Nutrients Market, By Application, 2013-2020 (Kilotons)
Table 4 Latin America Agricultural Nutrients Market in Soil Application, By Geography, 2013 - 2020 (USD Million)
Table 5 Latin America Agricultural Nutrients Market in Soil Application, By Geography, 2013-2020 (Kilotons)
Table 6 Latin America Agricultural Nutrients Market in Foliar, By Geography, 2013-2020 (USD Million)
Table 7 Latin America Agricultural Nutrients Market in Foliar, By Geography, 2013-2020 (Kilotons)
Table 8 Latin America Agricultural Micronutrients Market in Fertigation Application Mode, By Geography, 2013-202(USD Million)
Table 9 Latin America Agricultural Micronutrients Market in Fertigation, By Geography, 2013-2020 (Kilotons)
Table 10 Latin America Agricultural Micronutrients Market in Other Applications, By Geography, 2013-2020 (USD Million)
Table 11 Latin America Agricultural Nutrients Market in Others Application, By Geography, 2013-2020 (Kilotons)
Table 12 Latin America Agricultural Micronutrients Market, By Crop Type, 2013-2020 (Kilotons)
Table 13 Latin America Agricultural Micronutrients Market, By Crop Type, 2013-2020 (USD Million)
Table 14 Latin America Agricultural Micronutrients Market For Cereals & Grains, By Geography, 2013-2020 (Kilotons)
Table 15 Latin America Agricultural Micronutrients Market For Cereals & Grains, By Geography, 2013-2020 (USD Million)
Table 16 Latin America Agricultural Micronutrients Market For Oilseeds & Pulses, By Geography, 2013-2020 (Kilotons)
Table 17 Latin America Agriculture Micronutrients Market For Oilseeds & Pulses, By Geography, 2013-2020 (USD Million)
Table 18 Latin America Agricultural Micronutrients Market For Fruits & Vegetables, By Geography, 2013–2020 (Kilotons)
Table 19 Latin America Agricultural Micronutrients Market For Fruits & Vegetables, By Geography, 2013-2020 (USD Million)
Table 20 Latin America Agricultural Micronutrients For Other Crop Types, By Geography, 2013–2020 (Kiloton)
Table 21 Latin America Agricultural Micronutrients For Other Crop Types, By Geography, 2013–2020 (USD Million)
Table 22 Latin America Agricultural Micronutrients Market, By Type, 2013-2020 (USD Million)
Table 23 Latin America Agriculture Micronutrients Market, By Type, 2013-2020 (Kilotons)
Table 24 Latin America Zinc Agricultural Micronutrients Market, By Country, 2013–2020 (USD Million)
Table 25 Latin America Zinc Agricultural Micronutrients Market, By Country, 2013–2020 (Kilotons)
Table 26 Latin America Copper Agricultural Micronutrients Market, By Country, 2013-2020 (USD Million)
Table 27 Latin America Copper Agricultural Micronutrients Market, By Country, 2013-2020 (Kilotons)
Table 28 Latin America Iron Agricultural Micronutrients Market, By Country, 2013-2020 (USD Million)
Table 29 Latin America Iron Agricultural Micronutrients Market, By Country, 2013-2020 (Kilotons)
Table 30 Latin America Manganese Agricultural Micronutrients Market, By Country, 2013-2020 (USD Million)
Table 31 Latin America Manganese Agricultural Micronutrients Market, By Country, 2013-2020 (Kilotons)
Table 32 Latin America Boron Agricultural Micronutrients Market, By Country, 2013-2020 (USD Million)
Table 33 Latin America Boron Agricultural Micronutrients Market, By Country, 2013-2020 (Kilotons)
Table 34 Latin America Molybdenum Agricultural Micronutrients Market, By Country, 2013-2020 (USD Million)
Table 35 Latin America Molybdenum Agricultural Micronutrients Market, By Country, 2013-2020 (Kilotons)
Table 36 Latin America Other Agricultural Micronutrients Market, By Country, 2013-2020 (USD Million)
Table 37 Latin America Other Agricultural Micronutrients Market, By Country, 2013-2020 (Kilotons)
Table 38 Latin America Agricultural Micronutrients Market, By Type, 2013-2020 (USD Million)
Table 39 Latin America Agricultural Nutrients Market, By Type, 2013-2020 (Kilotons)
Table 40 Latin America Chelated Agricultural Micronutrients Market, By Geography, 2013–2020 (USD Million)
Table 41 Latin America Chelated Agricultural Micronutrients Market, By Geography, 2013–2020 (Kilotons)
Table 42 Latin America Non-Chelated Agricultural Micronutrients Market, By Geography, 2013–2020 (USD Million)
Table 43 Latin America Non-Chelated Agricultural Micronutrients Market, By Geography, 2013–2020 (Kilotons)
Table 44 Latin America Agricultural Micronutrients Market, By Geography, 2013-2020 (USD Million)
Table 45 Brazil Agricultural Micronutrients Market, By Type, 2013-2020 (Kilotons)
Table 46 Brazil Agricultural Micronutrients Market, By Type, 2013-2020 (USD Million)
Table 47 Brazil Agricultural Micronutrients Market, By Application, 2013-2020 (Kilotons)
Table 48 Brazil Agricultural Micronutrients Market, By Application, 2013-2020 (USD Million)
Table 49 Brazil Agricultural Micronutrients Market, By Crop Type, 2013-2020 (Kilotons)
Table 50 Brazil Agricultural Micronutrients Market, By Crop Type, 2013-2020 (USD Million)
Table 51 Brazil Agricultural Micronutrients Market, By Form, 2013-2020 (Kilotons)
Table 52 Brazil Agricultural Micronutrients Market, By Form, 2013-2020 (USD Million)
Table 53 Argentina Agricultural Micronutrients Market, By Type, 2013-2020 (Kilotons)
Table 54 Argentina Agricultural Micronutrients Market, By Type, 2013-2020 (USD Million)
Table 55 Argentina Agricultural Micronutrients Market, By Application, 2013-2020 (Kilotons)
Table 56 Argentina Agricultural Micronutrients Market, By Application, 2013-2020 (USD Million)
Table 57 Argentina Agricultural Micronutrients Market, By Crop Type, 2013-2020 (Kilotons)
Table 58 Argentina Agricultural Micronutrients Market, By Crop Type, 2013-2020 (USD Million)
Table 59 Argentina Agricultural Micronutrients Market, By Form, 2013-2020 (Kilotons)
Table 60 Argentina Agricultural Micronutrients Market, By Form, 2013-2020 (USD Million)
Table 61 Colombia Agricultural Micronutrients Market, By Type, 2013-2020 (Kilotons)
Table 62 Colombia Agricultural Micronutrients Market, By Type, 2013-2020 (USD Million)
Table 63 Colombia Agricultural Micronutrients Market, By Application, 2013-2020 (Kilotons)
Table 64 Colombia Agricultural Micronutrients Market, By Application, 2013-2020 (USD Million)
Table 65 Colombia Agricultural Micronutrients Market, By Crop Type, 2013-2020 (Kilotons)
Table 66 Colombia Agricultural Micronutrients Market, By Crop Type, 2013-2020 (USD Million)
Table 67 Colombia Agricultural Micronutrients Market, By Form, 2013-2020 (Kilotons)
Table 68 Colombia Agricultural Micronutrients Market, By Form, 2013-2020 (USD Million)
Table 69 Other Countries Agricultural Micronutrients Market, By Type, 2013-2020 (Kilotons)
Table 70 Other Countries Agricultural Micronutrients Market, By Type, 2013-2020 (USD Million)
Table 71 Other Countries Agricultural Micronutrients Market, By Application, 2013-2020 (Kilotons)
Table 72 Other Countries Agricultural Micronutrients Market, By Application, 2013-2020 (USD Million)
Table 73 Other Countries Agricultural Micronutrients Market, By Crop Type, 2013-2020 (Kilotons)
Table 74 Other Countries Agricultural Micronutrients Market, By Crop Type, 2013-2020 (USD Million)
Table 75 Other Countries Agricultural Micronutrients Market, By Form, 2013-2020 (Kilotons)
Table 76 Other Countries Agricultural Micronutrients Market, By Form, 2013-2020 (USD Million)
Table 77 Latin America Agricultural Micronutrients Market: New Product Developments
Table 78 Latin America Agricultural Micronutrients Market: Mergers & Acquisitions
Table 79 Latin America Agricultural Micronutrients Market: Agreements
Table 80 Latin America Agricultural Micronutrients Market: Expansions
Table 81 Agrium inc.: Key Financials, 2010-2014 (USD Million)
Table 82 Akzonobel Nv.: Key Financials, 2011-2015 (USD Million)
Table 83 Basf Se: Key Financials, 2011-2015 (USD Million)
Table 84 Auriga Industries A/S: Key Financials, 2010-2014 (USD Million)
Table 85 The Mosiac Company: Key Financials, 2011-2015 (USD Million)
Table 86 The Coromandel International Ltd.: Key Financials, 2011-2015 (USD Million)
List Of Figure
Figure 1 Latin America Agricultural Micronutrients Market: Segmentation & Coverage
Figure 2 Bottom-Up Approach
Figure 3 Top-Down Approach
Figure 4 Latin America Agricultural Micronutrients Market: Data Triangulation
Figure 5 Latin America Agricultural Micronutrients Market : Snapshot
Figure 6 Latin America Agricultural Micronutrients Market, 2015-2020
Figure 7 The Soil Application Segment Is Projected To Lead The Latin America Agricultural Micronutrients Market Between 2015 And 2020
Figure 8 The Molybdenum Segment Is Projected To Lead The Latin America Agricultural Micronutrients Market Between 2015 And 2020
Figure 9 The Non-Chelated Segment Is Projected To Lead The Latin America Agricultural Micronutrients Market Between 2015 And 2020
Figure 10 Brazil Led The Latin America Agricultural Micronutrients Market In 2014
Figure 11 Brazil Presents Attractive Investment Opportunities in The Latin America Agricultural Micronutrients Market
Figure 12 Latin America Agricultural Micronutrients Market, By Application
Figure 13 Latin America Agricultural Micronutrients Market: Value Chain Analysis
Figure 14 Porter’s Five Forces Analysis: Latin America Agricultural Micronutrients Market
Figure 15 Latin American Agricultural Nutrients Market, By Application, 2015 & 2020 (USD Million)
Figure 16 Latin America Agricultural Nutrients Market, By Application, 2015-2020 (Kilotons)
Figure 17 Latin America Agricultural Nutrients Market in Soil Application, By Geography, 2013-2020 (USD Million)
Figure 18 Latin American Agricultural Nutrients Market in Foliar Application, By Geography, 2013-2020 (USD Million)
Figure 19 Latin American Agricultural Nutrients Market in Fertigation, By Geography, 2013-2020 (USD Million)
Figure 20 Latin American Agricultural Nutrients Market in Other Applications, By Geography, 2013-2020 (USD Million)
Figure 21 Latin America Agricultural Micronutrients Market, By Crop Type, 2015 & 2020 (Kilotons)
Figure 22 Latin America Agricultural Micronutrients Market, By Crop Type, 2015 & 2020 (USD Million)
Figure 23 Latin America Agricultural Micronutrients Market For Cereals & Grains, By Geography, 2013-2020 (USD Million)
Figure 24 Latin America Agricultural Micronutrients For Oilseeds & Pulses, By Geography, 2013-2020 (USD Million)
Figure 25 Latin America Agricultural Micronutrients Market For Fruits & Vegetables, By Geography, 2013–2020 (USD Million)
Figure 26 Latin America Agricultural Micronutrients For Other Crop Types, By Geography, 2013–2020 (USD Million)
Figure 27 Latin America Agricultural Micronutrients Market, By Type, 2015 & 2020 (USD Million)
Figure 28 Latin America Agricultural Micronutrients Market, By Type, 2015 & 2020 (Kilotons)
Figure 29 Latin America Zinc Agricultural Micronutrients Market, By Country, 2013–2020 (USD Million)
Figure 30 Latin America Copper Agricultural Micronutrients Market, By Country, 2013-2020 (USD Million)
Figure 31 Latin America Iron Agricultural Micronutrients Market, By Country, 2013-2020 (USD Million)
Figure 32 Latin America Manganese Agricultural Micronutrients Market, By Country, 2013-2020 (USD Million)
Figure 33 Latin America Boron Agricultural Micronutrients Market, By Country, 2013-2020 (USD Million)
Figure 34 Latin America Molybdenum Agricultural Micronutrients Market, By Country, 2013-2020 (USD Million)
Figure 35 Latin America Other Agricultural Micronutrients Market, By Country, 2013-2020 (USD Million)
Figure 36 Latin America Agricultural Micronutrients Market, By Form, 2015-2020 (USD Million)
Figure 37 Latin America Agricultural Nutrients Market, By Form, 2015-2020 (Kilotons)
Figure 38 Latin America Chelated Agricultural Micronutrients Market, 2013–2020 (USD Million)
Figure 39 Latin America Non-Chelated Agricultural Micronutrients Market, 2013–2020 (USD Million)
Figure 40 Latin America Agricultural Micronutrients Market: Growth Analysis, By Geography, 2015-2020 (USD Million)
Figure 41 Latin America Agricultural Micronutrients Market Overview, 2015 & 2020 (USD Million)
Figure 42 Brazil Agricultural Micronutrients Market, By Type, 2013-2020 (USD Million)
Figure 43 Brazil Agricultural Micronutrients Market, Application Snapshot (USD Million)
Figure 44 Brazil Agricultural Micronutrients Market, Crop Type Snapshot (USD Million)
Figure 45 Argentina Agricultural Micronutrients Market, By Type, 2013-2020 (USD Million)
Figure 46 Argentina Agricultural Micronutrients Market, Application Snapshot
Figure 47 Argentina Agricultural Micronutrients Market, Crop Type Snapshot
Figure 48 Argentina Agricultural Micronutrients Market, By Form (USD Million)
Figure 49 Colombia Agricultural Micronutrients Market, By Type, 2013-2020 (USD Million)
Figure 50 Colombia Agricultural Micronutrients Market, Application Snapshot
Figure 51 Colombia Agricultural Micronutrients Market, Crop Type Snapshot(USD Million)
Figure 52 Colombia Agricultural Micronutrients Market, By Form, 2015-2020 (USD Million)
Figure 53 Other Countries Agricultural Micronutrients Market, By Type, 2013-2020 (USD Million)
Figure 54 Other Countries Agricultural Micronutrients Market, By Application, 2015 & 2020 (USD Million)
Figure 55 Other Countries Agricultural Micronutrients Market, Crop Type, 2015 & 2020 (USD Million)
Figure 56 Other Countries Agricultural Micronutrients Market, By Form, 2015 & 2020 (USD Million)
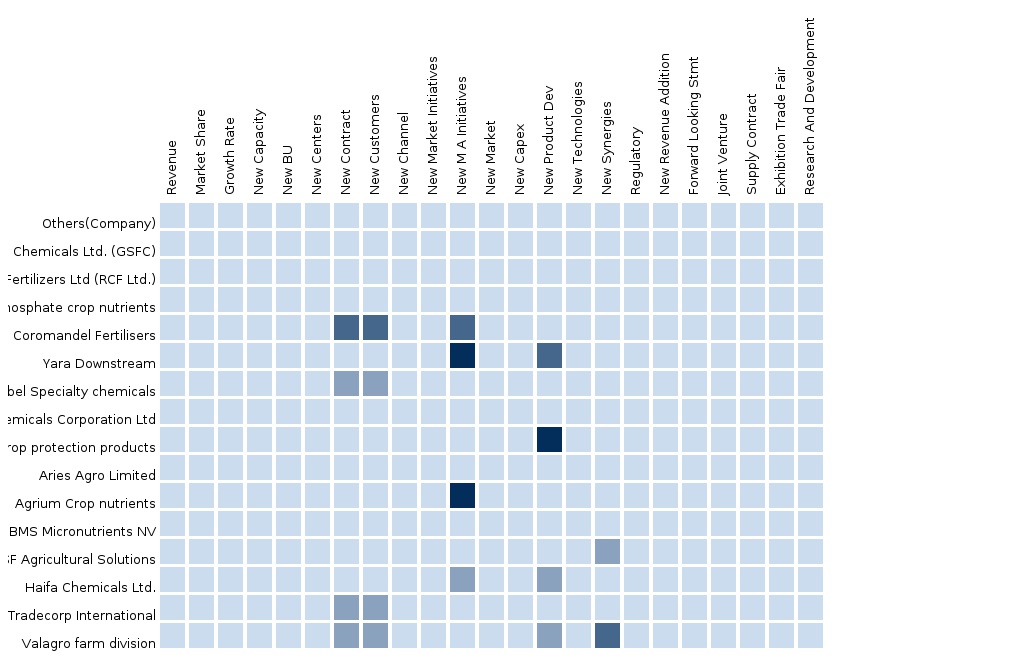
Figure 57 Competitive Situation And Trends
Figure 58 Agricultural Micronutrients Market: Developments in Major Companies
Figure 59 Agrium Inc.: Revenue Mix, 2014 (%)
Figure 60 Contribution Of Retail Fertilizer Towards Company Revenues, 2011-2015 (USD Million)
Figure 61 Akzonobel N.V.: Revenue Mix, 2015 (%)
Figure 62 Contribution Of Industrial Speciality Chemicals Segment Towards Company Revenues, 2011-2015 (USD Million)
Figure 63 Basf Se: Revenue Mix, 2015 (%)
Figure 64 Contribution Of Agricultural Solutions Segment Towards Company Revenues, 2011-2015 (USD Million)
Figure 65 Auriga Industries A/S: Revenue Mix, 2013 (%)
Figure 66 Contribution Of Industrial Products Segment Towards Company Revenues, 2010-2014 (USD Million)
Figure 67 The Mosaic Company: Revenue Mix, 2015 (%)
Figure 68 Contribution Of Phosphates Segment Towards Company Revenues, 2011-2015 (USD Million)
Micronutrients are of critical importance as they enhance sugar translocation in plants, strengthen their roots, and improve their immunity. Each micronutrient has a special function to perform. For instance, zinc and manganese are crucial for proper reproduction and seed formation, whereas boron facilitates transportation of carbohydrates within plant systems. Thus, presence of micronutrients helps in increasing natural immunity of plants against pests and diseases.
The Latin America agricultural micronutrients market is projected to reach USD 695.8 million by 2020, at a CAGR of around 7.6% from 2015 to 2020. Various factors, such as increasing micronutrient deficiency in soil, diminishing agricultural land in the Latin American region, and growing demand for quality food owing to increased income of the masses, along with economic development are the major factors expected to drive the Latin America agricultural micronutrients market between 2015 and 2020. Agricultural micronutrients are needed by all plants and crops throughout their lifespan in small quantities to carry out various physiological functions. There are various types of micronutrients available in nature, but only seven of them, which include zinc, manganese, boron, copper, chlorine, iron, and molybdenum are considered to be crucial for successful plant procreation. However, these micronutrients are present in very small quantities in nature. The need for agricultural micronutrients depends upon the type of soil, pH content of soil, type of crop, and cropping pattern used. Proper scientific study needs to be carried out to understand clearly the suitability of a particular agricultural micronutrient for a particular type of soil and temperature level.
The market for agricultural micronutrients in Latin America is expected to witness increased growth during the forecast period. The manufacturers of agricultural micronutrients are focusing on research & development activities to produce new formulations of agricultural micronutrients, along with the development of innovative application methods for efficient delivery of agricultural micronutrients. Increased deficiency of micronutrients in soil and shrinking of agricultural land in Latin America are the factors leading towards adoption of new methods of agriculture by farmers to increase their crop yields so as to meet the growing demand for nutritional food. Growing awareness among farmers about benefits of agricultural micronutrients is also one of the major reasons for the increasing demand for agricultural micronutrients.
The leading market players operating in the Latin America agricultural micronutrients market have adopted various strategies, such as expansions, mergers & acquisitions, supply contracts, and new product launches to cater to the increased demand for agricultural micronutrients, along with strengthening of their position in the market. Some of the key companies operating in this market are AkzoNobel N.V. (Netherlands) BASF SE (Germany), Coromandel International Limited (India), and The Mosaic Company (U.S.), among others.
Please visit https://www.micromarketmonitor.com/custom-research-services.html to specify your custom Research Requirement
| PRODUCT TITLE | PUBLISHED | |
|---|---|---|
|
|
North America Agrochemicals Agrochemicals-North America and Pesticides, Agricultural... |
Upcoming |
|
|
Europe Agrochemicals Agrochemicals-Europe and Pesticides, Agricultural... |
Upcoming |


