

Japan Network Configuration and Change Management Market
- Publish Date: Upcoming


Japan Network Configuration and Change Management market is estimated to grow from $66.43 million in 2013 to $125.0 million by 2019, at a Compound Annual Growth Rate (CAGR) of 12.5% from 2013 - 2019. The Japan Network Configuration and Change Management growth is basically depends on the various IT industries carrying and transferring huge amount of data over their networks and to manage as well deliver that data there is huge requirement of the Network configuration and change management.
Network Configuration and Change management is the automated technology that protect against the interruption caused by changes in configuration. Today’s network infrastructure is very difficult to manage, with numbers of devices attached to it. Managing such large complex network infrastructure is important for business units so the NCCM helps to manage and improve system capability to manage the network and also helps to manage critical data, save time, reduces cost and eliminate the manual tasks.
The enterprise networks in Japan are changing in size and complexity at a rapid pace. The advancement and innovation on the services being provided on the networks coupled with the increased data transfer rates has paved the road for network management solutions market.
MicroMarketMonitor endeavor’s the customer to have a deep analysis of Japan Network Configuration and Change Management market. The report provides a competitive benchmarking of leading players in this market such as BMC, Solarwinds, Emc Corporation, IBM, and Hewlett Packard. The Japan Network Configuration and Change Management market report gives the financial analysis which includes CAGR and market share of the different region, vendors, and also overall adoption scenario, competitive landscape, key drivers, restraints, and opportunities
Report Options:
- Japan Network Configuration and Change Management Market segmentation covered in this report are-
- By Components: Software, and Services
- By Deployment Mode: On-Premise, and On-Demand
- By End-User: Small and Medium Enterprises, and Enterprises
- By Verticals: Banking Financial Services and Insurances, Healthcare, Education, Government, IT & Telecom, Energy, and Others
Customization Options:
With MMM assessment, we will best meet your company’s specific customization needs. Following customization options provide comprehensive industry standard and deep dive analysis:
- Japan Network Configuration and Change Management Market Solutions Matrix
- Comprehensive analysis and benchmarking by components, by deployments mode, by end-users, and by verticals in the Japan Network Configuration and Change Management market
- Japan Network Configuration and Change Management Market Competitive Benchmarking
- Value-chain evaluation using events, developments, market data for vendors in the market ecosystem, across various industrial verticals, market segmentation and categorization
- Japan Network Configuration and Change Management Market Vendor Landscaping
- Vendor market watch and predictions, vendor market shares and offerings, categorization of adoption trends and market dominance (Leaders, Challengers, Followers, and Nicher)
- Japan Network Configuration and Change Management Market Market Data Tracker
- Industry vertical specific market forecast and analysis
- Identification of key end-user segments by country
- Japan Network Configuration and Change Management Market Vertical Analysis
- Analysis of different industrial verticals by components, by deployments mode, by end-users, and by verticals in Japan Network Configuration and Change Management market
- Japan Network Configuration and Change Management Market Emerging Vendor Landscape
- Evaluate Tier-2/3 vendors’ market offerings using a 2X2 framework (realizing Leaders, Challengers, Followers, Nichers)
- Japan Network Configuration and Change Management Market Channel Analysis
- Channel/distribution partners/alliances for tier-1 vendors. Application specific products being build towards the customer end of value chain
1 Introduction
1.1 Key Take-aways
1.2 Report Description
1.3 Markets Covered
1.4 Stakeholders
1.5 Research Methodology
1.5.1 Key Data Points
1.5.2 Data Triangulation and Market Forecasting
1.6 Forecast Assumptions
2 Executive Summary
2.1 Abstract
2.2 Overall Market Size
3 Market Overview
3.1 Market Definition
3.1.1 Configuration Management
3.1.1.1 Multi-Vendor Device Support
3.1.1.2 Network Device Discovery and Inventory
3.1.1.3 Protocol Support
3.1.1.4 Secure Configuration Storage
3.1.1.5 Configuration Versioning and Comparison
3.1.1.6 Role-Based Access Control
3.1.1.7 Configuration Upload
3.1.2 Change Management
3.1.2.1 Real-Time Change Monitoring
3.1.2.2 Restoration and Backup
3.1.2.3 Change Management Policy and Notification
3.1.3 Network Security and Compliance Management
3.1.3.1 Government and Industry Regulations
3.1.3.2 Industry Best Practices and Standards
3.1.3.3 Configuration Syntax Checking
3.1.3.4 Compliance Reporting
3.1.4 Network Audit and Report
3.1.4.1 User Activity Monitoring and Tracking
3.1.4.2 Reporting
3.1.5 Automation and Tools
3.1.5.1 Automation
3.1.5.2 Device Upgrades
3.1.5.3 Robust Search Engine
3.1.5.4 Command Execution Utilities and Tools
3.2 Fcaps
3.2.1 Introduction
3.2.2 Components of Fcaps
3.3 Market Evolution
3.4 Market Segmentation
3.5 Market Dynamics
3.5.1 Drivers
3.5.2 Challenges
3.5.3 Opportunities
3.5.4 Impact Analysis of DRO
3.6 Value Chain
4 JAPAN Network Configuration and Change Management (NCCM): Market Size and Forecast By Components
4.1 Introduction
4.2 Software
4.2.1 Overview
4.2.2 Market Size and Forecast
4.2.3 Market Size and Forecast By Verticals
4.2.4 Market Size and Forecast By End-Users
4.3 Services
4.3.1 Overview
4.3.2 Market Size and Forecast
4.3.3 Market Size and Forecast By Verticals
4.3.4 Market Size and Forecast By End-Users
4.3.5 Market Size and Forecast, By Type of Services
5 NCCM: Market Size and Forecast By Deployment Model
5.1 Introduction
5.2 On-Premise
5.2.1 Overview
5.2.2 Market Size and Forecast
5.2.3 Market Size and Forecast By Verticals
5.2.4 Market Size and Forecast By End-Users
5.3 On-Demand
5.3.1 Overview
5.3.2 Market Size and Forecast
5.3.3 Market Size and Forecast By Verticals
5.3.4 Market Size and Forecast By End-Users
6 JAPAN Network Configuration and Change Management (NCCM): Market Size and Forecast By End-User
6.1 Introduction
6.2 SME
6.2.1 Overview
6.2.2 Market Size and Forecast
6.2.3 Market Size and Forecast By Verticals
6.2.4 Market Size and Forecast By Countries
6.3 Enterprise
6.3.1 Overview
6.3.2 Market Size and Forecast
6.3.3 Market Size and Forecast By Verticals
6.3.4 Market Size and Forecast By Countries
7 JAPAN NCCM: Market Size and Forecast By Verticals
7.1 Introduction
7.2 BFSI
7.2.1 Overview
7.2.2 Market Size and Forecast
7.2.3 Market Size and Forecast By Deployment
7.2.4 Market Size and Forecast By Countries
7.3 Healthcare
7.3.1 Overview
7.3.2 Market Size and Forecast
7.3.3 Market Size and Forecast By Deployment
7.3.4 Market Size and Forecast By Countries
7.4 Education
7.4.1 Overview
7.4.2 Market Size and Forecast
7.4.3 Market Size and Forecast By Deployment
7.4.4 Market Size and Forecast By Countries
7.5 Government
7.5.1 Overview
7.5.2 Market Size and Forecast
7.5.3 Market Size and Forecast By Deployment
7.5.4 Market Size and Forecast By Countries
7.6 IT &Telecom
7.6.1 Overview
7.6.2 Market Size and Forecast
7.6.3 Market Size and Forecast By Deployment
7.6.4 Market Size and Forecast By Countries
7.7 Energy
7.7.1 Overview
7.7.2 Market Size and Forecast
7.7.3 Market Size and Forecast By Deployment
7.7.4 Market Size and Forecast By Countries
7.8 Others
7.8.1 Overview
7.8.2 Market Size and Forecast
7.8.3 Market Size and Forecast By Deployment
7.8.4 Market Size and Forecast By Countries
8 JAPAN NCCM: Competitive Landscape
8.1 Competitive Landscape
8.1.1 Ecosystem and Roles
8.1.2 Portfolio Comparison
8.2 End-User Landscape
8.2.1 Market Opportunity Analysis
8.2.2 End-User Analysis
8.2.2.1 More Than 10 Billion Mobile-Connected Devices By 2018
8.2.2.2 Global Network Management System Market Will Surpass $6 Billion By 2019
9 Company Profiles (Introduction, Products & Services, Strategy & Analyst Insights, New Developments, MMM View)
9.1 Alterpoint
9.2 Bmc Software
9.3 Ca Technologies
9.4 Cisco
9.5 Dorado Software
9.6 Emc Corporation
9.7 Ibm
9.8 Hewlett Packard
9.9 Manageengine
9.10 Solarwinds
Appendix
List Of Tables
Table 1 JAPAN Network Configuration And Change Management (Nccm) Market, 2014-2019 ($Million)
Table 2 JAPAN Nccm Market, By Components,2014-2019 ($Million)
Table 3 JAPAN Nccm Market, By Components, 2014-2019 (Y-O-Y %)
Table 4 JAPAN Network Configuration And Change Management (Nccm) Market, By Software, 2014-2019 ($Million)
Table 5 JAPAN Nccm Market, Software, By Verticals, 2014-2019 ($Million)
Table 6 JAPAN Market, Software, By Verticals, 2014-2019 (Y-O-Y %)
Table 7 JAPAN Market, Software, By End-Users, 2014-2019 ($Million)
Table 8 JAPAN Market, Software, By End-Users, 2014-2019 (Y-O-Y %)
Table 9 JAPAN Network Configuration And Change Management Market, By Services, 2014-2019 ($Million)
Table 10 JAPAN Nccm Market, Services, By Verticals, 2014-2019 ($Million)
Table 11 JAPAN Market, Services, By Verticals, 2014-2019 (Y-O-Y%)
Table 12 JAPAN Market, Services, By End-Users, 2014-2019 ($Million)
Table 13 JAPAN Market, Services, By End-Users, 2014-2019 (Y-O-Y %)
Table 14 JAPAN Services Market, By Type, 2014-2019 ($Million)
Table 15 JAPAN Services Market, By Type, 2014-2019 (Y-O-Y %)
Table 16 JAPAN Market, By Deployment Mode, 2014-2019 ($Million)
Table 17 JAPAN Market, By Deployment Mode, 2014-2019 (Y-O-Y %)
Table 18 JAPAN Network Configuration And Change Management (Nccm), On-Premise, 2014-2019 ($Million, Y-O-Y %)
Table 19 JAPAN Market, On-Premise, By Verticals, 2014-2019 ($Million)
Table 20 JAPAN Market, On-Premise, By Verticals, 2014-2019 (Y-O-Y %)
Table 21 JAPAN Market, On-Premise, By End-Users, 2014-2019 ($Million)
Table 22 JAPAN Market, On-Premise, By End-Users,2014-2019 (Y-O-Y %)
Table 23 JAPAN Nccm Market, On-Demand, 2014-2019 ($ Million, Y-O-Y %)
Table 24 JAPAN Market, On-Demand, By Verticals, 2014-2019 ($Million)
Table 25 JAPAN Market, On-Demand, By Verticals, 2014-2019 (Y-O-Y %)
Table 26 JAPAN Market, On-Demand, By End-Users 2014-2019 ($Million)
Table 27 JAPAN Market, On-Demand, By End-Users 2014-2019 (Y-O-Y %)
Table 28 JAPAN Nccm Market, By End-Users, 2014-2019 ($Million)
Table 29 JAPAN Market, By End-Users, 2014-2019 (Y-O-Y %)
Table 30 JAPAN Network Configuration And Change Management (Nccm) Market, Sme, 2014-2019 ($Million, Y-O-Y %)
Table 31 JAPAN Market, Sme, By Verticals 2014-2019 ($Million)
Table 32 JAPAN Market, Sme, By Verticals 2014-2019 (Y-O-Y %)
Table 33 JAPAN Market, Sme, By Countries, 2014-2019 ($Million)
Table 34 JAPAN Market, Sme, By Countries, 2014-2019 (Y-O-Y)
Table 35 JAPAN Nccm Market, Enterprise, 2014-2019 ($Million, Y-O-Y %)
Table 36 JAPAN Market, Enterprise, By Verticals, 2014-2019 ($Million)
Table 37 JAPAN Market, Enterprise, By Verticals, 2014-2019 (Y-O-Y %)
Table 38 JAPAN Market, Enterprise, By Countries, 2014-2019 ($Million)
Table 39 JAPAN Market, Enterprise, By Countries, 2014-2019 (Y-O-Y %)
Table 40 JAPAN Nccm Market, By Verticals, 2014-2019 ($Million)
Table 41 JAPAN Market, By Verticals, 2014-2019 (Y-O-Y %)
Table 42 JAPAN Network Configuration And Change Management (Nccm) Market, Bfsi, 2014-2019 ($Million, Y-O-Y %)
Table 43 JAPAN Market, Bfsi, By Deployment, 2014-2019 ($Million)
Table 44 JAPAN Market, Bfsi, By Deployment, 2014-2019 (Y-O-Y %)
Table 45 JAPAN Market, Bfsi, By Countries, 2014-2019 ($Million)
Table 46 JAPAN Market, Bfsi, By Countries, 2014-2019 (Y-O-Y %)
Table 47 JAPAN Nccm Market, Healthcare, 2014-2019 ($Million, Y-O-Y %)
Table 48 JAPAN Market, Healthcare, By Deployment, 2014-2019 ($Million)
Table 49 JAPAN Market, Healthcare, By Deployment, 2014-2019 (Y-O-Y %)
Table 50 JAPAN Market, Healthcare, By Countries, 2014-2019 ($Million)
Table 51 JAPAN Market, Healthcare, By Countries, 2014-2019 (Y-O-Y %)
Table 52 JAPAN Market, Education, 2014-2019 ($Million, Y-O-Y %)
Table 53 JAPAN Network Configuration And Change Management (Nccm) Market, Education, By Deployment, 2014-2019 ($Million)
Table 54 JAPAN Market, Education, By Deployment, 2014-2019 (Y-O-Y %)
Table 55 JAPAN Market, Education, By Countries, 2014-2019 ($Million)
Table 56 JAPAN Market, Education, By Countries, 2014-2019 (Y-O-Y %)
Table 57 JAPAN Network Configuration And Change Management (Nccm) Market, Government, 2014-2019 ($Million, Y-O-Y %)
Table 58 JAPAN Market, Government, By Deployment, 2014-2019 ($Million)
Table 59 JAPAN Market, Government, By Deployment (Y-O-Y %)
Table 60 JAPAN Market, Government, By Countries, 2014-2019 ($Million)
Table 61 JAPAN Market, Government, By Countries, 2014-2019 (Y-O-Y %)
Table 62 JAPAN Network Configuration And Change Management (Nccm) Market, It And Telecom, By Deployment, 2014-2019 ($Million)
Table 63 JAPAN Market, It And Telecom, By Deployment, 2014-2019 ($Million)
Table 64 JAPAN Market, It And Telecom, By Deployment, 2014-2019 (Y-O-Y %)
Table 65 JAPAN Market, It And Telecom, By Countries, 2014-2019 ($Million)
Table 66 JAPAN Market, It & Telecom, By Countries, 2014-2019 (Y-O-Y %)
Table 67 JAPAN Network Configuration And Change Management (Nccm) Market, Energy, 2014-2019 ($Million)
Table 68 JAPAN Market, Energy, By Deployment, 2014-2019 ($Million)
Table 69 JAPAN Market, Energy, By Deployment, 2014-2019 (Y-O-Y %)
Table 70 JAPAN Market, Energy, By Countries, 2014-2019 ($Million)
Table 71 JAPAN Market, Energy, By Countries, 2014-2019 (Y-O-Y %)
Table 72 JAPAN Network Configuration And Change Management (Nccm) Market, Others, 2014-2019 ($Million)
Table 73 JAPAN Market, Others, By Deployment, 2014-2019 ($Million)
Table 74 JAPAN Market, Others, By Deployment, 2014-2019 (Y-O-Y %)
Table 75 JAPAN Market, Others, By Countries, 2014-2019 ($Million)
Table 76 JAPAN Market, Others, By Countries, 2014-2019 (Y-O-Y %)
Table 77 JAPAN Network Configuration And Change Management (Nccm) Market, By Countries, 2014-2019 ($Million)
Table 78 JAPAN Market, 2014-2019 (Y-O-Y %)
Table 79 JAPAN, 2014-2019 ($Million, Y-O-Y %)
Table 80 JAPAN, By Components, 2014-2019 ($Million)
Table 81 JAPAN, By Components, 2014-2019 (Y-O-Y %)
Table 82 JAPAN, By Deployment, 2014-2019 ($Million)
Table 83 JAPAN, By Deployment, 2014-2019 (Y-O-Y %)
Table 84 JAPAN Nccm Market: M&A
List Of Figures
Figure 1 Stakeholders
Figure 2 Secondary And Primary Research
Figure 3 Data Triangulation And Market Forecasting
Figure 4 JAPAN Nccm Market, 2014-2019 (Y-O-Y %)
Figure 5 Features
Figure 6 Fcaps: Components
Figure 7 JAPAN Market Evolution
Figure 8 Market Segmentation
Figure 9 Time Impact Analysis
Figure 10 Value-Chain
Figure 11 JAPAN Network Configuration And Change Management (Nccm) Market, By Components, 2014-2019 (Y-O-Y %)
Figure 12 JAPAN Market, By Software, 2014-2019 (Y-O-Y %)
Figure 13 JAPAN Market, By Services, 2014-2019 (Y-O-Y %)
Figure 14 JAPAN Market, By Deployment Mode, 2014-2019 (Y-O-Y %)
Figure 15 JAPAN Market, On-Premise, 2014-2019 ($Million, Y-O-Y %)
Figure 16 JAPAN Market, On-Demand, 2014-2019 ($ Million, Y-O-Y %)
Figure 17 JAPAN Network Configuration And Change Management (Nccm) Market, By End-Users, 2014-2019 (Y-O-Y %)
Figure 18 JAPAN Nccm Market, Sme, 2014-2019 ($Million, Y-O-Y %)
Figure 19 JAPAN Market, Enterprise, 2014-2019 ($Million, Y-O-Y %)
Figure 20 JAPAN Market, By Verticals, 2014-2019 (Y-O-Y %)
Figure 21 JAPAN Market, Bfsi, 2014-2019 ($Million, Y-O-Y %)
Figure 22 JAPAN Market, Healthcare, 2014-2019 ($Million, Y-O-Y %)
Figure 23 JAPAN Market, Education, 2014-2019 ($Million, Y-O-Y %)
Figure 24 JAPAN Market, Government, 2014-2019 ($Million, Y-O-Y %)
Figure 25 JAPAN Market, It And Telecom, 2014-2019 ($Million)
Figure 26 JAPAN Market, Energy, 2014-2019 ($Million)
Figure 27 JAPAN Market, Others, 2014-2019 ($Million)
Figure 28 JAPAN Market, By Countries, 2014-2019 (Y-O-Y %)
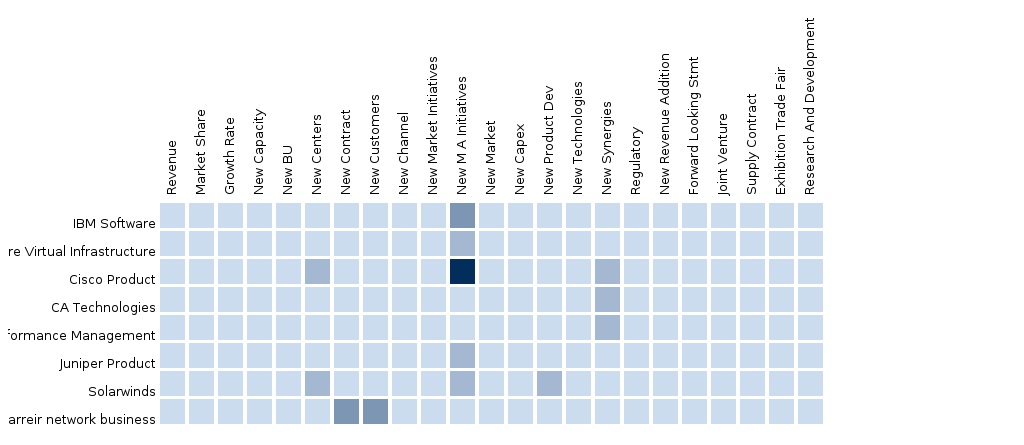
Figure 29 JAPAN Parfait Chart
Figure 30 JAPAN Market, JAPAN, 2014-2019 ($Million, Y-O-Y %)
Figure 31 JAPAN Nccm Market, JAPAN, 2014-2019 ($Million, Y-O-Y %)
Figure 32 JAPAN Market, Apac, 2014-2019 ($Million, Y-O-Y %)
Figure 33 JAPAN Market, Mea, 2014-2019 ($Million, Y-O-Y %)
Figure 34 JAPAN Market, La, By Components, 2014-2019 ($Million, Y-O-Y %)
Figure 35 JAPAN Ecosystem And Roles
Figure 36 JAPAN Product Portfolio Comparison
Figure 37 JAPAN Market Opportunity Analysis
Please fill in the form below to receive a free copy of the Summary of this Report
Please visit https://www.micromarketmonitor.com/custom-research-services.html to specify your custom Research Requirement
| PRODUCT TITLE | PUBLISHED | |
|---|---|---|
|
|
North America Network Management Network Management-North America can be segmented by Hardwares, Endusers, Services, Softwares, Industries and MacroIndicators. Hardwares of Network Management-North America are Networking Hardware. Endusers of Network Management-North America are Small and Medium... |
Upcoming |
|
|
Europe Network Management Network Management-Europe can be segmented by Hardwares, Endusers, Services, Softwares, Industries and MacroIndicators. Hardwares of Network Management-Europe are Networking Hardware. Endusers of Network Management-Europe are Small and Medium Business (SMB) and... |
Upcoming |
|
|
Asia-Pacific Network Management Network Management-Asia-Pacific can be segmented by Hardwares, Endusers, Services, Softwares, Industries and MacroIndicators. Hardwares of Network Management-Asia-Pacific are Networking Hardware. Endusers of Network Management-Asia-Pacific are Small and Medium Business... |
Upcoming |
|
|
Middle East and Africa Network Management Network Management-Middle East and Africa can be segmented by Hardwares, Endusers, Services, Softwares, Industries and MacroIndicators. Hardwares of Network Management-Middle East and Africa are Networking Hardware. Endusers of Network Management-Middle East and Africa... |
Upcoming |
|
|
Latin America Network Management Network Management-Latin America can be segmented by Hardwares, Endusers, Services, Softwares, Industries and MacroIndicators. Hardwares of Network Management-Latin America are Networking Hardware. Endusers of Network Management-Latin America are Small and Medium... |
Upcoming |


