

Europe Nitrogenous Fertilizer Market By Type (Ammonia, Ammonium Nitrate, Ammonium Sulphate, Calcium Ammonium Nitrate, Urea and Others), By Application and By Country - Trends and Forecast Upto 2019
- Publish Date: Apr 2015


The European nitrogenous fertilizers market is estimated to grow at a CAGR of 2.4% in 2014 to 2019. Crop requires different types of nutrients such as nitrogen, phosphorus, sulfur and potassium for its growth. Nitrogen is the most essential nutrient for vegetative growth of crop. Grains and oilseed require more application rate of nitrogenous fertilizers than fruits and vegetables.
In Europe, nitrogenous fertilizers are widely use in the field. It comes with different type like ammonia, urea, calcium ammonium sulfate, ammonium nitrate and others. Different nitrogenous fertilizers are required for different type of crops and at different stages of plant growth. Ammonia and urea are widely used in the fields of grains and oilseeds in Europe.
The European nitrogenous fertilizers market is led by France with 20.54% of market share followed by Germany and the U.K. European countries are focusing on diverting their agricultural produce for bio-diesel production. Rapeseed oil is the ingredient used for the production of bio-fuel. With an increase in use of bio-fuel commodity prices are also increasing. This has encouraged the farmers to employ nitrogen fertilizers for increasing production.
The growing European market has several competitors. Companies such as Yara International (Norway) have expansion strategies which helped to expand beyond Europe and are present in major countries in the world. The other companies present in the European market are Agrium Inc. (Canada), Bunge (US) and Eurochem (Russia), apart from these companies, the European nitrogenous fertilizers market has largely fragmented and many small players are present to compete with world leaders.
Scope of the Report
This research report categorizes the European nitrogenous fertilizers market into the following segments and sub-segments:
European Nitrogenous Fertilizers Market, By Applications
- Urea
- Ammonia
- Ammonium Nitrate
- Ammonium Sulfate
- Calcium Ammonium Nitrate
- Other Nitrogenous Fertilizers
European Nitrogenous Fertilizers Market, By Geography
- France
- Germany
- Italy
- Spain
- Italy
- United Kingdom
- Rest of Europe
Table of Contents
1 Introduction (Page No. - 10)
1.1 Objectives of the Study
1.2 Market Segmentation & Coverage
1.3 Stakeholders
1.4 Assumptions
2 Research Methodology (Page No. - 13)
2.1 Integrated Ecosystem of Nitrogenous Fertilizers Market
2.2 Arriving at the Nitrogenous Fertilizers Market Size
2.2.1 Top-Down Approach
2.2.2 Bottom-Up Approach
2.2.3 Demand Side Approach
2.2.4 Macro Indicator-Based Approach
3 Executive Summary (Page No. - 22)
4 Market Overview (Page No. - 24)
4.1 Introduction
4.2 Nitrogenous Fertilizer Market: Comparison With Parent Market
4.3 Key Market Dynamics
4.4 Demand Side Analysis
4.5 Vendor Side Analysis
4.6 Market Drivers and Inhibitors
5 Nitrogenous Fertilizers Market, By Application (Page No. - 34)
5.1 Introduction
5.2 Demand Side Analysis
5.3 Vendor Side Analysis
5.4 Nitrogenous Fertilizers in Grains & Oilseeds, By Geography
5.5 Nitrogenous Fertilizers in Fruits & Vegetables, By Geography
5.6 Sneak View: Europe Fertilizers Market, By Application, 2014 (USD MN)
6 Nitrogenous Fertilizers Market, By Type (Page No. - 45)
6.1 Introduction
6.2 Europe Nitrogenous Fertilizers Market, Type Comparison With Fertilizers Market
6.3 Europe Ammonium Nitrate Fertilizers Market, By Geography
6.4 Europe Urea Fertilizers Market, By Geography
6.5 Europe Calcium Ammonium Nitrate (CAN) Fertilizers Market, By Geography
6.6 Europe Ammonium Sulfate Fertilizers Market, By Geography
6.7 Sneak View: Europe Fertilizers Market, By Type
7 Nitrogenous Fertilizers Market, By Geography (Page No. - 56)
7.1 Introduction
7.2 Vendor Side Analysis
7.3 France Nitrogenous Fertilizers Market
7.3.1 France Nitrogenous Fertilizers Market, By Application
7.3.2 France Nitrogenous Fertilizers Market, By Key Type
7.4 Germany Nitrogenous Fertilizers Market
7.4.1 Germany Nitrogenous Fertilizers Market, By Application
7.4.2 Germany Nitrogenous Fertilizers Market, By Key Type
7.5 U.K. Nitrogenous Fertilizers Market
7.5.1 U.K. Nitrogenous Fertilizers Market, By Application
7.5.2 U.K. Nitrogenous Fertilizers Market, By Key Type
7.6 Spain Nitrogenous Fertilizers Market
7.6.1 Spain Nitrogenous Fertilizers Market, By Application
7.6.2 Spain Nitrogenous Fertilizers Market, By Key Type
7.7 Italy Nitrogenous Fertilizers Market
7.7.1 Italy Nitrogenous Fertilizers Market, By Application
7.7.2 Italy Nitrogenous Fertilizers Market, By Key Type
8 Nitrogenous Fertilizers Market: Competitive Landscape (Page No. - 84)
8.1 Nitrogenous Fertilizers Market: Market Share Analysis
8.2 Company Presence in Nitrogenous Fertilizers Market, By Type
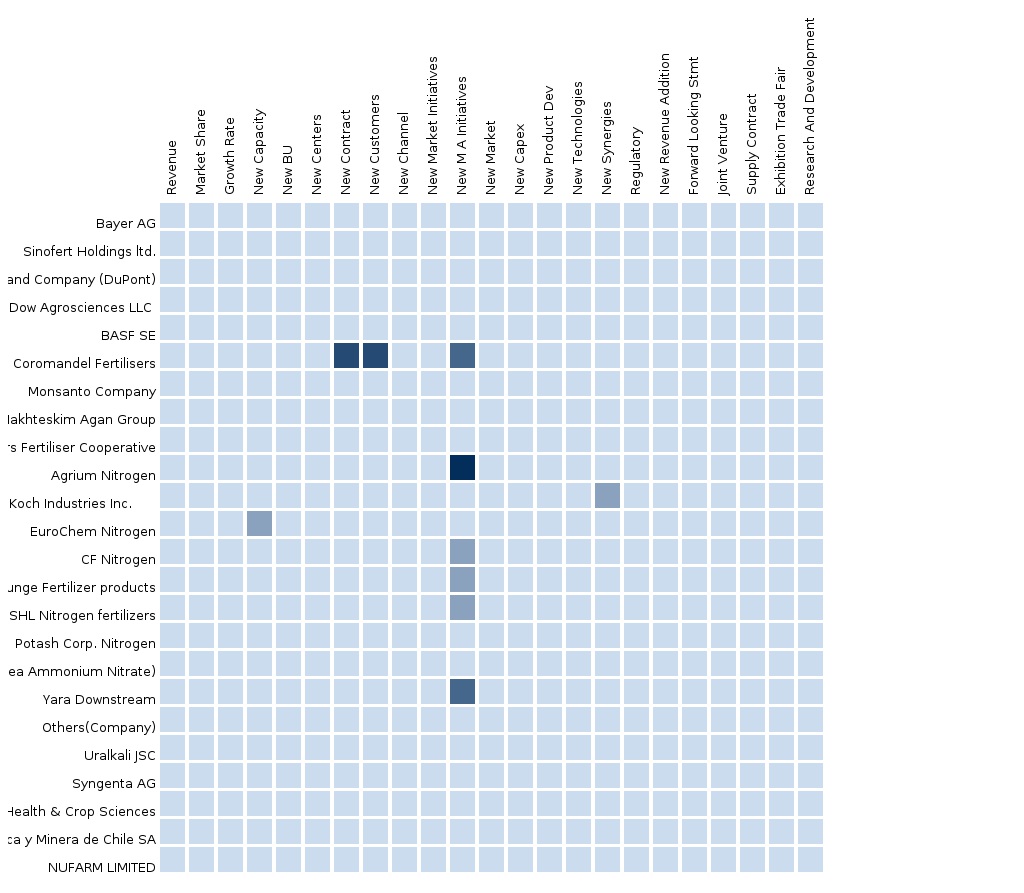
8.3 Mergers & Acquisitions
8.4 Expansions
8.5 Investments
8.6 Joint Ventures
9 Nitrogenous Fertilizers Market, By Company (Page No. - 88)
(Overview, Financials, Products & Services, Strategy, and Developments)*
9.1 Agrium Inc.
9.2 Yara International ASA
9.3 Eurochem Mineral & Chemical Co OJSC
9.4 Anwil S.A.
9.5 OCI Nitrogen B.V.
*Details on Overview, Financials, Product & Services, Strategy, and Developments Might Not be Captured in Case of Unlisted Company
10 Appendix (Page No. - 101)
10.1 Customization Options
10.1.1 Technical Analysis
10.1.2 Low-Cost Sourcing Locations
10.1.3 Regulatory Framework
10.1.4 Crop-Nitrogen Fertilizer Usage Data
10.1.5 Impact Analysis
10.1.6 Trade Analysis
10.1.7 Historical Data and Trends
10.2 Related Reports
10.3 Introducing RT: Real Time Market Intelligence
10.3.1 RT Snapshots
List of Tables (61 Tables)
Table 1 Global Nitrogenous Fertilizers Peer Market Size, 2014 (USD MN)
Table 2 Europe Nitrogenous Fertilizers Application Market, 2014 (KT)
Table 3 Europe Nitrogenous Fertilizers Market: Macro Indicators, By Geography, 2013 (HA)
Table 4 Europe Nitrogenous Fertlizers Market: Comparison With Parent Market, 2013 – 2019 (USD MN)
Table 5 Europe Nitrogenous Fertilizers Market: Comparison With Parent Market, 2013 – 2019 (KT)
Table 6 Europe Nitrogenous Fertilizers Market, By Application, 2013 - 2019 (USD MN)
Table 7 Europe Nitrogenous Fertilizers Market, By Application, 2013 - 2019 (KT)
Table 8 Europe Nitrogenous Fertilizers Market, By Type, 2013 - 2019 (USD MN)
Table 9 Europe Nitrogenous Fertilizers Market, By Type, 2013 - 2019 (KT)
Table 10 Europe Nitrogenous Fertilizers Market, By Geography, 2013 - 2019 (USD MN)
Table 11 Europe Nitrogenous Fertilizers Market, By Geography, 2013 - 2019 (KT)
Table 12 Europe Nitrogenous Fertilizers Market: Comparison With Application Markets, 2013 - 2019 (USD MN)
Table 13 Europe Nitrogenous Fertilizers Market: Drivers and Inhibitors
Table 14 Europe Nitrogenous Fertilizers Market, By Application, 2013 - 2019 (USD MN)
Table 15 Europe Nitrogenous Fertilizers: Market, By Application, 2014 - 2019 (KT)
Table 16 Europe Nitrogenous Fertilizers in Grains & Oilseeds, By Geography, 2013 - 2019 (USD MN)
Table 17 Europe Nitrogenous Fertilizers in Grains & Oilseeds, By Geography, 2013- 2019 (KT)
Table 18 Europe Nitrogenous Fertilizers in Fruits & Vegetables, By Geography, 2013 - 2019 (USD MN)
Table 19 Europe Nitrogenous Fertilizers in Fruits & Vegetables, By Geography, 2013 - 2019 (KT)
Table 20 Europe Nitrogenous Fertilizers Market, By Type, 2013 - 2019 (USD MN)
Table 21 Europe Nitrogenous Fertilizers Market, By Type, 2013 - 2019 (KT)
Table 22 Europe Nitrogenous Fertilizers Market: Type Comparison With Parent Market, 2013–2019 (USD MN)
Table 23 Europe Ammonium Nitrate Fertilizers Market, By Geography, 2013–2019 (USD MN)
Table 24 Europe Ammonium Nitrate Fertilizers Market, By Geography, 2013–2019 (KT)
Table 25 Europe Urea Fertilizers Market, By Geography, 2013 - 2019 (USD MN)
Table 26 Europe Urea Fertilizers Market, By Geography, 2013 - 2019 (KT)
Table 27 Europe Calcium Ammonium Nitrate (CAN) Fertilizers Market, By Geography, 2013 - 2019 (USD MN)
Table 28 Europe Calcium Ammonium Nitrate (CAN) Fertilizers Market, By Geography, 2013 - 2019 (KT)
Table 29 Europe Ammonium Sulfate Market, By Geography, 2013 - 2019 (USD MN)
Table 30 Europe Ammonium Sulfate Market, By Geography, 2013 - 2019 (KT)
Table 31 Europe Nitrogenous Fertilizers Market, By Geography, 2013 - 2019 (USD MN)
Table 32 Europe Nitrogenous Fertilizers Market, By Geography, 2013 – 2019 (KT)
Table 33 France Nitrogenous Fertilizers Market, By Application, 2013-2019 (USD MN)
Table 34 France Nitrogenous Fertilizers Market, By Application, 2013-2019 (KT)
Table 35 France Nitrogenous Fertilizer Market, By Type, 2013 - 2019 (USD MN)
Table 36 France Nitrogenous Fertilizers Market, By Type, 2013 - 2019 (KT)
Table 37 Germany Nitrogenous Fertilizers Market, By Application, 2013-2019 (USD MN)
Table 38 Germany Nitrogenous Fertilizers Market, By Application, 2013-2019 (KT)
Table 39 Germany Nitrogenous Fertilizer Market, By Type, 2013 - 2019 (USD MN)
Table 40 Germany Nitrogenous Fertilizers Market, By Type, 2013 - 2019 (KT)
Table 41 U.K. Nitrogenous Fertilizers Market, By Application, 2013-2019 (USD MN)
Table 42 U.K. Nitrogenous Fertilizers Market, By Application, 2013-2019 (KT)
Table 43 U.K. Nitrogenous Fertilizer Market, By Type, 2013 - 2019 (USD MN)
Table 44 U.K. Nitrogenous Fertilizers Market, By Type, 2013 - 2019 (KT)
Table 45 Spain Nitrogenous Fertilizers Market, By Application, 2013-2019 (USD MN)
Table 46 Spain Nitrogenous Fertilizers Market, By Application, 2013-2019 (KT)
Table 47 Spain Nitrogenous Fertilizer Market, By Type, 2013 - 2019 (USD MN)
Table 48 Spain Nitrogenous Fertilizers Market, By Type, 2013 - 2019 (KT)
Table 49 Italy Nitrogenous Fertilizers Market, By Application, 2013 - 2019 (USD MN)
Table 50 Italy Nitrogenous Fertilizers Market, By Application, 2013 - 2019 (KT)
Table 51 Italy Nitrogenous Fertilizers Market, By Type, 2013 - 2019 (USD MN)
Table 52 Italy Nitrogenous Fertilizers Market, By Type, 2013 - 2019 (KT)
Table 53 Nitrogenous Fertilizers Market: Market Share Analysis, 2014 (%)
Table 54 Europe Nitrogenous Fertilizers Market: Mergers & Acquisitions
Table 55 Europe Nitrogenous Fertilizers Market: Expansions
Table 56 Europe Nitrogenous Fertilizers Market: Investments
Table 57 Europe Nitrogenous Fertilizers Market: Joint Ventures
Table 58 Agrium, Inc.: Key Operations Data, 2009 - 2013 (USD MN)
Table 59 Agrium, Inc.: Key Financials, 2009 - 2013 (USD MN)
Table 60 Yara International ASA: Key Financials, 2009 - 2013 (USD MN)
Table 61 Eurochem MCC, OJSC: Key Financials, 2009 - 2013 (USD MN)
List of Figures (59 Figures)
Figure 1 Europe Nitrogenous Fertilizers Market: Segmentation & Coverage
Figure 2 Nitrogenous Fertilizers Market: Integrated Ecosystem
Figure 3 Research Methodology
Figure 4 Top-Down Approach
Figure 5 Bottom-Up Approach
Figure 6 Demand Side Approach
Figure 7 Macro Indicator-Based Approach
Figure 8 Europe Nitrogenous Fertilizers Market Snapshot, (2014)
Figure 9 Nitrogenous Fertilizers Market: Growth Aspects
Figure 10 Europe Nitrogenous Fertilizers Market, By Application, 2014 vs. 2019
Figure 11 Europe Nitrogenous Fertilizers Types, By Geography, 2014 (USD MN)
Figure 12 Europe Nitrogenous Fertilizers Market: Growth Analysis, By Type, 2014–2019 (%)
Figure 13 Nitrogenous Fertilizers: Application Market Scenario
Figure 14 Europe Nitrogenous Fertilizers Market, By Application, 2014 - 2019 (USD MN)
Figure 15 Europe Nitrogenous Fertilizers Market, By Application, 2014 - 2019 (KT)
Figure 16 Europe Nitrogenous Fertilizers Market: Vendor Side Analysis
Figure 17 Europe Nitrogenous Fertilizers Market in Grains & Oilseeds, By Geography, 2013 - 2019 (USD MN)
Figure 18 Europe Nitrogenous Fertilizers Market in Fruits & Vegetables, By Geography, 2013 - 2019 (USD MN)
Figure 19 Sneak View: Europe Fertilizer Market, By Application, 2014 (USD MN)
Figure 20 Europe Nitrogenous Fertilizers Market, By Type, 2013 - 2019 (USD MN)
Figure 21 Europe Nitrogenous Fertilizers Market, By Type, 2014 & 2019 (KT)
Figure 22 Europe Nitrogenous Fertilizers Market: Type Comparison With Fertilizers Market, 2013–2019 (USD MN)
Figure 23 Europe Ammonium Nitrate Fertilizers Market, By Geography, 2013–2019 (USD MN)
Figure 24 Europe Urea Market, By Geography, 2013 - 2019 (USD MN)
Figure 25 Europe Calcium Ammonium Nitrate (CAN) Fertilizers Market, By Geography, 2013 - 2019 (USD MN)
Figure 26 Europe Ammonium Sulfate Market, By Geography, 2013 - 2019 (USD MN)
Figure 27 Europe Nitrogenous Fertilizers Market: Growth Analysis, By Geography, 2013-2019 (USD MN)
Figure 28 Europe Nitrogenous Fertilizers Market: Growth Analysis, By Geography, 2013-2019 (KT)
Figure 29 France Nitrogenous Fertilizers Market Overview, 2014 & 2019 (%)
Figure 30 France Nitrogenous Fertilizers Market, By Application, 2014-2019 (USD MN)
Figure 31 France Nitrogenous Fertilizers Market: Application Snapshot
Figure 32 France Nitrogenous Fertilizers Market, By Key Type, 2013 - 2019 (USD MN)
Figure 33 France Nitrogenous Fertilizers Market Share, By Type, 2014-2019 (%)
Figure 34 Germany Nitrogenous Fertilizers Market Overview, 2014 & 2019 (%)
Figure 35 Germany Nitrogenous Fertilizers Market, By Application, 2013-2019 (USD MN)
Figure 36 Germany Nitrogenous Fertilizers Market: Application Snapshot
Figure 37 Germany Nitrogenous Fertilizers Market, By Key Type, 2013 - 2019 (USD MN)
Figure 38 Germany Nitrogenous Fertilizers Market Share, By Type, 2014-2019 (%)
Figure 39 U.K. Nitrogenous Fertilizers Market Overview, 2014 & 2019 (%)
Figure 40 U.K. Nitrogenous Fertilizers Market, By Application, 2013-2019 (USD MN)
Figure 41 U.K. Nitrogenous Fertilizers Market: Application Snapshot
Figure 42 U.K. Nitrogenous Fertilizers Market, By Key Type, 2013 - 2019 (USD MN)
Figure 43 U.K. Nitrogenous Fertilizers Market Share, By Type, 2014-2019 (%)
Figure 44 Spain Nitrogenous Fertilizers Market Overview, 2014 & 2019 (%)
Figure 45 Spain Nitrogenous Fertilizers Market, By Application, 2013-2019 (USD MN)
Figure 46 Spain Nitrogenous Fertilizers Market: Application Snapshot
Figure 47 Spain Nitrogenous Fertilizers Market, By Key Type, 2013 - 2019 (USD MN)
Figure 48 Spain Nitrogenous Fertilizers Market Share, By Type, 2014-2019 (%)
Figure 49 Italy Nitrogenous Fertilizers Market Overview, 2014 & 2019 (%)
Figure 50 Italy Nitrogenous Fertilizers Market, By Application, 2013-2019 (USD MN)
Figure 51 Italy Nitrogenous Fertilizers Market: Application Snapshot
Figure 52 Italy Nitrogenous Fertilizers Market, By Key Type, 2013 - 2019 (USD MN)
Figure 53 Italy Nitrogenous Fertilizers Market Share, By Type, 2014-2019 (%)
Figure 54 Nitrogenous Fertilizers Market: Market Share Analysis, 2014 (%)
Figure 55 Nitrogenous Fertilizers: Company Product Coverage, By Type, 2014
Figure 56 Agrium Inc. Revenue Mix, 2013 (%)
Figure 57 Yara International ASA Revenue Mix, 2013 (%)
Figure 58 Eurochem Mineral & Chemical Co OJSC, Revenue Mix, 2013 (%)
Figure 59 Anwil S.A.: Revenue Mix (%)
The European nitrogenous fertilizers market is estimated to grow at a CAGR of 2.4% in 2014 to 2019. The European nitrogenous fertilizers market is highly competitive and no single player dominates the market. Large numbers of small players are dominating a major share of European nitrogenous fertilizer market. In 2014, Yara International (Norway) led the European market with a market share of 16.70%; followed by the Russian firm Eurochem with a market share of 11.76%. These companies are active in all major countries of Europe such as France, Germany, U.K., Spain, and Italy.
In 2014, France was the largest nitrogenous fertilizers market by value followed by Germany and U.K. Spain has highest CAGR% among the European countries for estimated period. There is a considerable increase in the meat consumption along with other products. The increase in meat production directly affects the increase in demand for corn and other agricultural commodities, which is necessary to make animal feed. This increases the demand for nitrogen fertilizers. European countries are focusing on diverting their agricultural produce for bio-diesel production. Rapeseed oil is the ingredient used for production of bio-fuel. With an increase in use of bio-fuel, commodity prices are also increasing. This has encouraged the farmers to use nitrogen fertilizers for increasing production.
In Europe, nitrogenous fertilizers market companies are adopting the strategies of, partnerships, agreements, collaborations, joint ventures, acquisitions, and expansions. The firm follows these strategies to take advantage of new technologies introduced in the market. Agrium Inc. (Canada) strategizes its comprehensive crop inputs and serves in the European market.
Please visit https://www.micromarketmonitor.com/custom-research-services.html to specify your custom Research Requirement


