

Europe Food and Beverages Stabilizers and Systems Market by Application (Bakery, Confectionery, Dairy, Sauces & Dressing, Meat, Poultry, Convenience, Beverages), by Function (Stability, Texture, Moisture Retention) - Forecasts to 2019
- Publish Date: Apr 2015


The Europe food & beverage stabilizers & systems market is projected to grow at CAGR of 4.17%from 2014 to 2019. Food stabilizer blends are used in a wide range of applications such as bakery, meat, convenience food, ice-creams, canned and packed food, confectionery, dairy, and beverages.
Today, food stabilizer blends perform various functions in food preparations. These include product stability, thermal stability, softness, and moisture retention. Stabilizer blends that comprise hydrocolloid blends and other ingredients such as emulsifiers essential for stability of food products are offered as systems by food ingredient manufactures. Other functions delivered by food stabilizer blends include mouthfeel, prevention of ice crystallization, and egg replacement, among others.
The Europe food and beverage stabilizers and systems market has the largest share in the global market. It is dominated by France, followed by Germany and the U.K. In Europe, the applications for stabilizer blends include bakery, confectionery, dairy, sauces & dressings, meat & poultry products, convenience food, and beverages. The convenience food segment is estimated to grow as a result of the increasing popularity and convenience of processed food.
The Europe food & beverage stabilizers & systems market is competitive, with firms such as Tate & Lyle (U.K.), Kerry (Ireland), DuPont (U.S.), Cargill Inc. (U.S.), and Royal DSM (U.S.) among others, which are expanding their share in the market. To gain market share, these companies are adopting numerous strategies such as innovative product development, partnerships, mergers & acquisitions and expansion of existing facilities. Apart from these companies, a large number of small firms are also present in this market.
Scope of the Report
This research report categorizes the Europe food & beverage stabilizers & systems market into the following segments and sub-segments:
Europe Food & Beverage Stabilizers & Systems Market, by Application
- Bakery
- Confectionery
- Dairy & Dairy Products
- Sauces & Dressings
- Meat & Poultry
- Convenience Food
- Beverages
Europe Food & Beverage Stabilizers & Systems Market, by Function
- Stability
- Texture
- Moisture Retention
Europe Food & Beverage Stabilizers & Systems Market, by Geography
- France
- U.K.
- Germany
- Italy
- Spain
- Russia
- The Netherlands
- Rest of Europe
Table of Contents
1 Introduction (Page No. - 13)
1.1 Objectives of the Study
1.2 Market Segmentation & Coverage
1.3 Stakeholders
2 Research Methodology (Page No. - 15)
2.1 Integrated Ecosystem of Food & Beverages Stabilizers Market
2.2 Arriving at the Food & Beverages Stbilizers & System Market Size
2.2.1 Top-Down Approach
2.2.2 Bottom-Up Approach
2.2.3 Macro Indicator-Based Approach
2.3 Assumptions
3 Executive Summary (Page No. - 22)
4 Market Overview (Page No. - 24)
4.1 Introduction
4.2 Market Drivers and Inhibitors
4.3 Key Market Dynamics
5 Europe Food & Beverage Stabilizers & Systems, By Application (Page No. - 36)
5.1 Introduction
5.2 Europe Food and Beverage Stabilizers and Systems in Bakery, By Geography
5.3 Europe Food and Beverage Stabilizers and Systems Market for Confectionery, By Geography
5.4 Europe Food and Beverage Stabilizers and Systems Market for Dairy Products, By Geography
5.5 Europe Food and Beverage Stabilizers and Systems Market for Sauces, Dressings & Condiments, By Geography
5.6 Food & Beverage Stabilizers & Systems for Beverage Products, By Geography
5.7 Europe Food and Beverage Stabilizers and Systems Market for Meat & Meat Products, By Geography
5.8 Europe Food and Beverage Stabilizers and Systems Market for Convenience Foods, By Geography
5.9 Sneak View: European Food & Beverage Stabilizers & Systems Market, By Application
6 Europe Food & Beverage Stabilizers & Systems Market, By Function (Page No. - 55)
6.1 Introduction
6.2 European Food & Beverage Stbiizers & Systems Market, Function Comparison With Parent Market
6.3 European Texture Function Market, By Geography
6.4 European Stability Function Market, By Geography
6.5 European Moisture Retention Function Market, By Geography
6.6 Sneak View: European Food & Beverages Ingredients Market
7 Europe Food & Beverage Stabilizers & Systems Market, By Geography (Page No. - 64)
7.1 Introduction
7.2 U.K. Food & Beverages Stabilizers & Systems Market
7.2.1 U.K. Food & Beverage Stabilizers & Systems Market, By Application
7.2.2 U.K. Food & Beverage Stabilizers & Systems Market, By Function
7.3 Germany Food & Beverage Stabilizers & Systems Market
7.3.1 Germany Food & Beverage Stabilizers & Systems Market, By Application
7.3.2 Germany Food & Beverage Stabilizers & Systems Market, By Function
7.4 France Food & Beverage Stabilizers & Systems Market
7.4.1 France Food & Beverage Stabilzers & Systems Market, By Application
7.4.2 Germany Food & Beverage Stabiilzers & Systems Market, By Function
7.5 Italy Food & Beverage Stabilizers & Systems Market
7.5.1 Italy Food & Beverages Stabilzers & System Market, By Application
7.5.2 Italy Food & Beverage Stabiilzers & Systems Market, By Function
7.6 Spain Food & Beverage Stabilizers & Systems Market
7.6.1 Spain Food & Beverages Stabilizers & Systems Market, By Application
7.6.2 Spain Food & Beverage Stabilizers & Systems Market, By Function
7.7 Russia Food & Beverage Stabilizers & Systems Market
7.7.1 Russia Food & Beverage Stabilzers & Systems Market, By Application
7.7.2 Russia Food & Beverage Stabilizers & Systems Market, By Function
7.8 The Netherlands Food & Beverage Stabilizers & Systems Market
7.8.1 The Netherlands Food & Beverage Stabilizers & Systems Market, By Application
7.8.2 The Netherlands Food Beverages Stabilizers & Systems Market, By Function
8 Europe Food & Beverage Stabilizers & Systems: Competitive Landscape (Page No. - 103)
8.1 Europe Food and Beverage Stabilizers and Systems Market: Market Share Analysis
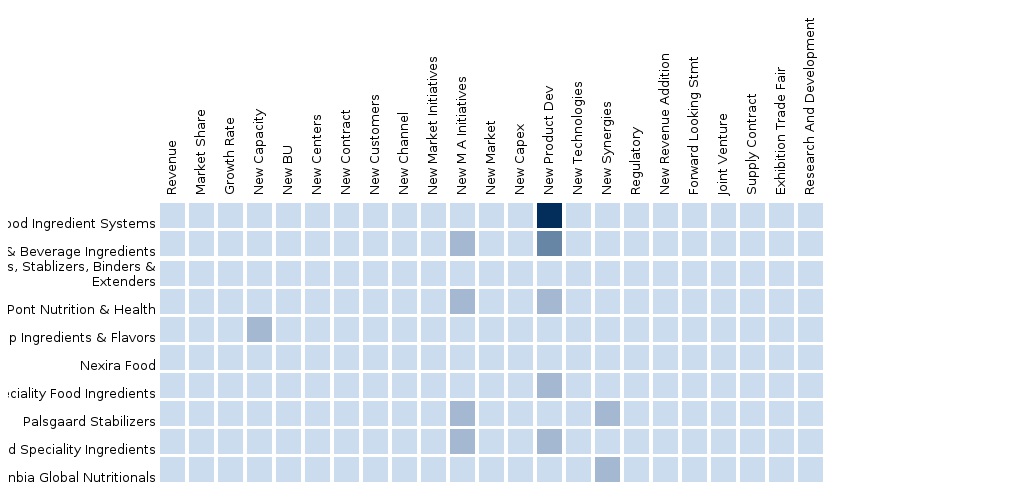
8.2 Company Presence in Food & Beverage Stabilizers & Systems Market, By Function
8.3 Mergers & Acquisitions
8.4 Expansions and New Product Launches
8.5 Investments, Joint Ventures and Agreements
9 Europe Food & Beverage Stabilizers & Systems Market, By Company (Page No. - 107)
(Overview, Products and Services, Financials, Strategy & Development)*
9.1 Archer Daniels Midland Company (Adm)
9.2 Tate & Lyle PLC
9.3 Palsgaard A/S.
9.4 E. I. Du Pont De Nemours and Company
9.5 Kerry Group
9.6 Cargill Incorporated
*Details on Overview, Products and Services, Financials, Strategy & Development Might Not be Captured in Case of Unlisted Companies.
10 Appendix (Page No. - 125)
10.1 Customization Options
10.1.1 Technical Analysis
10.1.2 Low-Cost Sourcing Locations
10.1.3 Regulatory Framework
10.1.4 Impact Analysis
10.1.5 Trade Analysis
10.1.6 Historical Data and Trends
10.2 Related Reports
10.3 Introducing RT: Real Time Market Intelligence
10.3.1 RT Snapshots
List of Tables (68 Tables)
Table 1 Global Food & Beverage Stabilizers & Systems Peer Market Size, 2014 (USD MN)
Table 2 European Food & Beverage Stabilizers & Systems Market: Macro Indicators, By Geography, 2014 (Thousand)
Table 3 European Food & Beverage Stabilizers & Systems Market: Comparison With Parent Market, 2013 – 2019 (USD MN)
Table 4 European Food & Beverage Stabilizers & Systems Market: Comparison With Parent Market, 2013 – 2019 (MT)
Table 5 European Food & Beverage Stabilizers & Systems Market: Drivers and Inhibitors
Table 6 European Food & Beverage Stabilizers & Systems Market, By Application, 2013 - 2019 (USD MN)
Table 7 European Food & Beverage Stabilizers & Systems Market, By Application, 2013 - 2019 (MT)
Table 8 European Food & Beverage Stabilizers & Systems Market, By Function, 2013 - 2019 (USD MN)
Table 9 European Food & Beverage Stabilizers & Systems Market, By Function, 2013 - 2019 (MT)
Table 10 European Food & Beverage Stabilizers & Systems Market, Bygeography,2013 - 2019 (USD MN)
Table 11 European Food & Beverage Stabilizers & Systems Market, By Geography,2013 - 2019 (MT)
Table 12 Europe Food & Beverage Stabilizers & Systems Market: Comparison With Application Markets, 2013 - 2019 (USD MN)
Table 13 European Food & Beverage Stabilizers & Systems Market, By Application, 2013 - 2019 (USD MN)
Table 14 European Food & Beverage Stabilizers & Systemss: Market, By Application, 2013 - 2019 (MT)
Table 15 Europe Food & Beverages Stabilzers & Systems Market for Bakery, By Geography, 2013 - 2019 (USD MN)
Table 16 European Food & Beverages Stabilzers & Systems Market for Bakery, By Geography, 2013 - 2019 (MT)
Table 17 European Food & Beverage Stabilizers & Systems Market for Confectionery, By Geography, 2013 – 2019 (USD MN)
Table 18 European Food & Beverage Stabilizers & Systems Market for Confectionery, By Geography, 2013 - 2019 (MT)
Table 19 European Food & Beverage Stabilizers & Systems Market for Dairy Products, By Geography, 2013 - 2019 (USD MN)
Table 20 European Food & Beverage Stabilizers & Systems Market for Dairy Products, By Geography, 2013 - 2019 (MT)
Table 21 European Food & Beverage Stabilizers & Systems in Sauces, Dressings & Condiments, By Geography, 2013 - 2019 (USD MN)
Table 22 European Food & Beverage Stabilizers & Systems in Sauces, Dressings & Condiments, By Geography, 2013 - 2019 (MT)
Table 23 European Food & Beverage Stabilizers & Systems Market for Beverage Products, By Geography, 2013 - 2019 (USD MN)
Table 24 European Food & Beverage Stabilizers & Systems Market for Beverage Products, By Geography, 2013 - 2019 (MT)
Table 25 European Food & Beverage Stabilizers & Systems Market for Meat & Meat Products, By Geography, 2013 - 2019 (USD MN)
Table 26 European Food & Beverage Stabilizers & Systems Market for Meat & Meat Products, By Geography, 2013 - 2019 (MT)
Table 27 European Food & Beverage Stabilizers & Systems Market for Convenience Foods, By Geography, 2013 - 2019 (USD MN)
Table 28 European Food & Beverage Stabilizers & Systems Market for Convenience Foods, By Geography, 2013 - 2019 (MT)
Table 29 European Food & Beverage Stabilizers & Systems Market: Comparison With Application Markets, 2013 - 2019 (USD MN)
Table 30 European Food & Beverage Stabilizers & Systems, By Function, 2013 - 2019 (USD MN)
Table 31 European Food & Beverage Stabilizers & Systems Market, By Function, 2013 - 2019 (MT)
Table 32 European Food & Beverage Stabilizers & Systems Market: Function Comparison With Parent Market, 2013–2019 (USD MN)
Table 33 European Texture Function Market, By Geography, 2013–2019 (USD MN)
Table 34 European Stability Function Market, By Geography, 2013 - 2019 (USD MN)
Table 35 European Miosture Retention Function Market, By Geography, 2013 - 2019 (USD MN)
Table 36 European Food & Beverage Stabilizers & Systems Market, By Geography, 2013 - 2019 (USD MN)
Table 37 European Food & Beverage Stabilizers & Systems Market: By Geography, 2013-2019 (MT)
Table 38 U.K. Food & Beverage Stabilizers & Systems Market, By Application, 2013 - 2019 (USD MN)
Table 39 U.K. Food & Beverages Stabilizers & Systems Market, By Application, 2013 - 2019 (MT)
Table 40 U.K. Food & Beverage Stabilizers & Systems Market, By Function, 2013 - 2019 (USD MN)
Table 41 Germany Food & Beverage Stabilizers & Systems Market, By Application, 2013 – 2019 (USD MN)
Table 42 Germany Food & Beverages Stabilizers & System Market, By Application, 2013 - 2019 (MT)
Table 43 Germany Food & Beverage Stabilizers & Systems Market, By Function, 2013 - 2019 (USD MN)
Table 44 France Food & Beverage Stabilizers & Systems Market, By Application, 2013 - 2019 (USD MN)
Table 45 France Food & Beverage Stabilizers & Systems Market, By Application, 2013-2019 (MT)
Table 46 France Food & Beverage Stabilizers & Systems Market, By Function, 2013 - 2019 (USD MN)
Table 47 Italy Food & Beverage Stabilizers & Systems Market, By Application, 2013 - 2019 (USD MN)
Table 48 Italy Food & Beverage Stabilizers & Systems Market, By Application, 2013 - 2019 (MT)
Table 49 Italy Food & Beverage Stabilizers & Systems: Market, By Function, 2013 - 2019 (USD MN)
Table 50 Spain Food & Beverage Stabilizers & Systems Market, By Application, 2013 - 2019 (USD MN)
Table 51 Spain Food & Beverage Stabilizers & Systems Market, By Application, 2013 - 2019 (MT)
Table 52 Spain Food & Beverage Stabilizers & Systems Market, By Function, 2013 - 2019 (USD MN)
Table 53 Russia Food & Beverage Stabilizers & Systems Market, By Application, 2013 - 2019 (USD MN)
Table 54 Russia Food & Beverage Stabilizers & Systems Market, By Application, 2013-2019 (MT)
Table 55 Russia Food & Beverage Stabilizers & Systems Market, By Function, 2013 - 2019 (USD MN)
Table 56 The Netherlands Food & Beverage Stabilizers & Systems Market, By Application, 2013 - 2019 (USD MN)
Table 57 The Netherlands Food & Beverage Stabilizers & Systems Market, By Application, 2013 - 2019 (MT)
Table 58 The Netherlands Food & Beverage Stabilizers & Systems: Market, By Function, 2013 - 2019 (USD MN)
Table 59 Food & Beverage Stabilizers & Systems Market: Market Share Analysis, 2014 (%)
Table 60 European Food & Beverage Stabilizers & Systems Market: Mergers & Acquisitions
Table 61 Europe Food & Beverage Stabilizers & Systems Market: Expansions and New Product Launches
Table 62 Europe Food & Beverage Stabilizers & Systems Market: Investments
Table 63 Archer Daniels Midland Company: Key Financials, 2008 - 2013 (USD MN)
Table 64 Tate & Lyle PLC: Key Operations Data, 2009 - 2013 (USD MN)
Table 65 Tate & Lyle PLC: Key Financials, 2009 - 2013 (USD MN)
Table 66 E. I. Du Pont De Nemours and Company: Key Financials, 2009 - 2013 (USD MN)
Table 67 Kerry Group: Key Financials, 2009 - 2013 (USD MN)
Table 68 Cargill Incorporated: Key Financials, 2009 - 2013 (USD MN)
List of Figures (74 Figures)
Figure 1 European Food & Beverage Stabilizers & Systems Market: Segmentation & Coverage
Figure 2 Food & Beverage Stabilizers & Systems Market: Integrated Ecosystem
Figure 3 Research Methodology
Figure 4 Top-Down Approach
Figure 5 Bottom-Up Approach
Figure 6 Macro Indicator-Based Approach
Figure 7 Europe Food & Beverage Stabilizers & Systems Market Snapshot: 2014
Figure 8 Food & Beverage Stabilizers & Systems Market: Growth Aspects
Figure 9 Europe Food & Beverage Stabilizers & Systems Market, By Application, 2014 vs. 2019
Figure 10 European Food & Beverage Stabilizers & Systems Market, By Application, 2014 vs. 2019
Figure 11 European Food & Beverage Stabilizers & Systems Market, By Function and Geography, 2014 (USD MN)
Figure 12 European Food & Beverage Stabilizers & Systems Market: Growth Analysis, By Function, 2014 – 2019 (%)
Figure 13 Demand-Side Analysis
Figure 14 Food & Beverage Stabilizers & Systems Fertilizers: Key Application Markets Scenario
Figure 15 European Food & Beverage Stabilizers & Systems Market, By Application, 2014 - 2019 (USD MN)
Figure 16 European Food & Beverage Stabilizers & Systems Market, By Application, 2014 - 2019 (MT)
Figure 17 Food & Beverage Stabilizers & Systems in Bakery, By Geography, 2013 - 2019 (USD MN)
Figure 18 European Food & Beverage Stabilizers & Systems Market for Confectionery, By Geography, 2013 - 2019 (USD MN)
Figure 19 European Food & Beverage Stabilizers & Systems Market for Dairy Products, By Geography, 2013 - 2019 (USD MN)
Figure 20 European Food & Beverage Stabilizers & Systems Market for Sauces, Dressings & Condiments By Geography, 2013 - 2019 (USD MN)
Figure 21 European Food & Beverage Stabilizers & Systems Market for Beverage Products, By Geography, 2013 - 2019 (USD MN)
Figure 22 European Food & Beverage Stabilizers & Systems Market for Meat & Meat Products, By Geography, 2013 - 2019 (USD MN)
Figure 23 European Food & Beverage Stabilizers & Systems Market in Convenience Foods, By Geography, 2013 - 2019 (USD MN)
Figure 24 Sneak View: European Food & Beverage Stabilizers & Systems Market: Comparison With Application Markets, 2013 - 2019 (USD MN)
Figure 25 European Food & Beverage Stabilizers & Systems Market, By Function, 2014 & 2019 (USD MN)
Figure 26 European Food & Beverage Stabilizers & Systems Market, By Function, 2014 & 2019 (MT)
Figure 27 European Food & Beverage Satbilizers & Systems Market: Function Comparison With Parent Market, 2013 - 2019 (USD MN)
Figure 28 European Texture Function, By Geography, 2013 - 2019 (USD MN)
Figure 29 European Stability Function Market, By Geography, 2013 - 2019 (USD MN)
Figure 30 European Moisture Retention Function Market, By Geography, 2013 - 2019 (USD MN)
Figure 31 European Food & Beverage Stabilizers & Systems Market: Growth Analysis, By Geography, 2014 - 2019 (USD MN)
Figure 32 European Food & Beverage Stabilizers & Systems Market: Growth Analysis, By Geography, 2014 - 2019 (MT)
Figure 33 U.K. Food & Beverage Stabilizers & Systems Market Overview, 2014 & 2019 (%)
Figure 34 U.K. Food & Beverage Stabilizers & Systems Market, By Application, 2013-2019 (USD MN)
Figure 35 U.K. Food & Beverage Stabilizers & Systems Market: Application Snapshot
Figure 36 U.K. Food & Beverage Stabilizers & Systems Market, By Function 2013 - 2019 (USD MN)
Figure 37 U.K. Food & Beverage Stabilizers & Systems Market Share, By Function, 2014 - 2019 (%)
Figure 38 Germany Food & Beverage Stabilizers & Systems Market Overview, 2014 & 2019 (%)
Figure 39 Germany Food & Beverage Stabilizers & Systems Market: By Application
Figure 40 Germany Food & Beverage Stabilizers & Systems Market: Application Snapshot
Figure 41 Germany Food & Beverage Stabilizers & Systems Market, By Function, 2013 - 2019 (USD MN)
Figure 42 Germany Food & Beverage Stabilizers & Systems Market Share, By Function, 2014 - 2019 (%)
Figure 43 France Food & Beverage Stabilizers & Systemss Market Overview, 2014 & 2019 (%)
Figure 44 France Food & Beverage Stabilzers & Systems Market, By Application, 2013 - 2019 (USD MN)
Figure 45 France Food & Beverages Stabilizers Market: Application Snapshot
Figure 46 Germany Food Beverage Stabiilzers & Systems Market, By Function 2013 - 2019 (USD MN)
Figure 47 France Food & Beverage Stabilizers & Systems Market: Function Snapshot
Figure 48 Italy Food & Beverages Stabilizers & Systems Market Overview, 2014 & 2019 (%)
Figure 49 Italy Food & Beverages Stabilzers & System Market, By Application, 2013 - 2019 (USD MN)
Figure 50 Italy Food & Beverage Stabilizers & Systems Market: Application Snapshot
Figure 51 Italy Food & Beverages Stabiilzer & Systems, By Function 2013 - 2019 (USD MN)
Figure 52 Italy Food & Beverage Stabilizers & Systems Market: Function Snapshot
Figure 53 Spain Food & Beverage Stabilizers & Systemss Market Overview, 2014 & 2019 (%)
Figure 54 Spain Food & Beverage Stabilizers & Systems Market, By Application, 2013 - 2019 (USD MN)
Figure 55 Italy Food & Beverage Stabilizers & Systems Market: Application Snapshot
Figure 56 Spain Food & Beverages Stabilizers & Systems, By Function 2013 - 2019 (USD MN)
Figure 57 Spain Food & Beverage Stabilizers & Systems: Function Snapshot
Figure 58 Russia Food & Beverage Stabilizers & Systemss Market Overview, 2014 & 2019 (%)
Figure 59 Russia Food & Beverage Stabilzers & Systems Market, By Application, 2013 - 2019 (USD MN)
Figure 60 Russia Food & Beverages Stabilizrs Market: Application Snapshot
Figure 61 Russia Food & Beverage Stabilizers & Systems, By Function 2013 - 2019 (USD MN)
Figure 62 Russia Food & Beverage Stabilizers & Systems: Function Snapshot
Figure 63 The Netherlands Food & Beverage Stabilizers & Systems Market Overview, 2014 & 2019 (%)
Figure 64 The Netherlands Food & Beverage Stabilizers & Systems Market, By Application, 2013 - 2019 (USD MN)
Figure 65 The Netherlands Food & Beverages Stabilizers Market: Application Snapshot
Figure 66 The Netherlands Food Beverages Stabilizers & System, By Function 2013 - 2019 (USD MN)
Figure 67 The Netherlands Food & Beverage Stabilizers & Systems: Function Snapshot
Figure 68 Food & Beverage Stabilizers & Systemsmarket: Market Share Analysis, 2014 (%)
Figure 69 Food & Beverage Stabilizers & Systems: Company Product Coverage, By Function, 2013
Figure 70 Archer Daniels Midland Companay: Revenue Mix, 2013 (%)
Figure 71 Tate & Lyle PLC. Revenue Mix, 2013 (%)
Figure 72 Contribution of Food & Beverage Stabilizers & Systems Towards Company Revenue, 2008 - 2013 (USD MN)
Figure 73 Kerry Group, Revenue Mix, 2013 (%)
Figure 74 Cargill Incorporated: Revenue Mix 2013 (%)
Stabilizers are substances which make it possible to maintain the physical and chemical state of foodstuffs; they include substances which enable the maintenance of a homogenous dispersion of two or more immiscible substances in a foodstuff and include also substances which stabilize, retain or intensify the existing color of a foodstuff.
The purpose of these food stabilizers is to maintain a consistent texture and to prevent the separation of ingredients in products such as margarine, low-fat spreads and dairy products, ice cream, salad dressings, and mayonnaise. Many reduced-fat and low-fat versions of common foods are dependent on this technology. Any recipe that requires the mixing of ingredients that normally do not mix, such as fat and water, need food stabilizers to impart and maintain the desired consistency.
The purpose of this study is to analyze the Europe market for food & beverage stabilizers & systems. This report includes market size forecasts, market trends, and opportunities for the period from 2014 to 2019. The analysis has been conducted on the various market segments derived on the basis of applications of food & beverage stabilizers & systems and further segmented on the basis of their types.
The European food & beverage stabilizers & systems market was valued at $3,309.36 million in 2014 and is projected to reach $4,059.85 million by 2019 at a CAGR of 4.1% during the forecast period. The market, by application was led by the dairy segment in 2014, with a 29.01% share.
Please visit https://www.micromarketmonitor.com/custom-research-services.html to specify your custom Research Requirement


