

China Text Analytics Market
- Publish Date: Upcoming


The Chinese text analytics market is expected to grow from $100.5 million in 2014 to $238.6 million by 2019, at a CAGR of 18.9% from 2014 to 2019. The growth of social media for brand building is one of the main drivers for the Chinese text analytics market.
Text analytics is the process of deriving information from text sources. It is used for several purposes, such as summarization, sentiment analysis, investigation, and classification of text information for a particular subject or content.
China has a potential market for text analytics implementation due to their brand management techniques. Organizations build their brand equity by continuously providing better services and products to its customers over the years. They need valued information about its customers, and their products & services. For this, organizations conduct many online surveys and obtain feedback from their customers in order to enhance the brand loyalty and customer satisfaction. Organizations are adopting text analytics to interpret the enormous data speedily, which will help them in effective business actions.
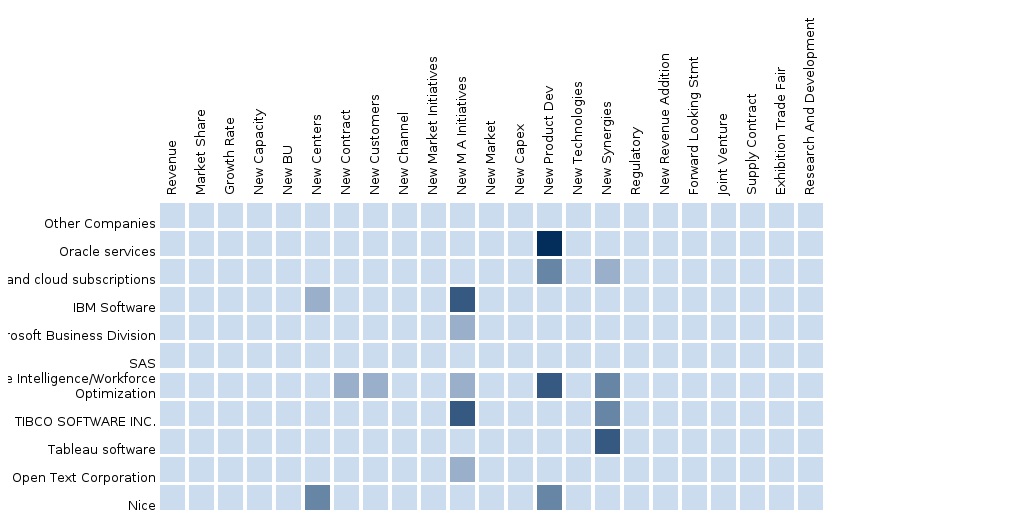
The report further provides a competitive benchmarking of the leading players in the industry such as SAS, SAP, Oracle, IBM, and Microsoft, among others, in terms of their product offerings, key strategies, and operational parameters. The report provides market trends, overall adoption scenarios, competitive landscape, key drivers, restraints, and opportunities in this market. The report aims in estimating the current size and the future growth potential of this market across the different applications, verticals, and regions.
Report Options:
The market segmentation detailed in this report is as given below:
- By Applications: Enterprise, web-based and software, data analysis, and search-based, among others
- By Users: Small and medium businesses (SMBs), and enterprises
- By Deployments: Cloud and On-Premise
- By Verticals: BFSI, healthcare & pharma, consumer packaged goods, retail and hospitality, telecommunications, and manufacturing, among others
Customization Options:
Along with the MMM assessment, customize the report to meet your company’s specific needs. The following customization options provide a comprehensive summary of the industry standards and deep dive analysis:
Text Analytics Solutions Matrix
- A comprehensive analysis and benchmarking of applications and solutions in the text analytics market
Text Analytics Competitive Benchmarking
- Value-chain evaluation using events, developments, market data for vendors in the market ecosystem, across various industrial verticals, market segmentation and categorization
- To unearth hidden opportunities by connecting related markets using cascaded value chain analysis
Text Analytics Vendor Landscaping
- Vendor market watch and predictions, vendor market shares and offerings, categorization of adoption trends and market dominance (leaders, challengers, and followers)
Text Analytics R&D Watch
- Tracking market movements in R&D space. For instance, algorithm optimization firms, statistical analysis firms, deep learning firms, academic institutions (tier-1 firms and major emphasis on tier-2/3 firms)
Text Analytics Client Tracker
- The listing and analysis of deals, case studies, R&D investments, events, discussion forums, alliances and partners of tier-1 and tier-2/3 vendors for the last 3 years
Text Analytics Vertical Analysis
- An analysis of different industrial verticals in terms of technologies and solutions
- Industry Verticals: Defense, healthcare, BFSI, retail, manufacturing, education, security, logistics, and IT & telecom, among others
Text Analytics Market Data Tracker
- Regional and country-specific market forecast and analysis
- The identification of key end-user segments, by country
Text Analytics Technology Watch
- Updates on the current technology trends across different industry verticals in the text analytics market
- Tracking latest technologies such as rosette language identifier (RLI), rosette base linguistics (RBL), and rosette name translator (RNT), among others
1 Introduction
1.1 Key Take-aways
1.2 Report Description
1.3 Markets Covered
1.4 Stakeholders
1.5 Research Methodology
1.5.1 Key Data Points
1.5.2 Data Triangulation and Market Forecasting
1.6 Forecast Assumptions
2 Executive Summary
2.1 Abstract
2.2 Overall Market Size
3 CHINA Text Analytics Market Overview
3.1 Market Definition
3.2 Market Evolution
3.3 Market Segmentation
3.4 Market Dynamics
3.4.1 Drivers
3.4.2 Restraints
3.4.3 Opportunities
3.4.4 Impact Analysis of DRO
3.4.5 Value Chain
4 CHINA Text Analytics Market Size and Forecast By Applications
4.1 Introduction
4.1.1 Market Size and Forecast
4.2 Enterprise Applications
4.2.1 Overview
4.2.2 Market Size and Forecast by Verticals
4.2.3 Market Size and Forecast by Countries
4.3 Web-Based and Software Applications
4.3.1 Overview
4.3.2 Market Size and Forecast by Verticals
4.3.3 Market Size and Forecast by Countries
4.4 Data Analysis Applications
4.4.1 Overview
4.4.2 Market Size and Forecast by Verticals
4.4.3 Market Size and Forecast by Countries
4.5 Search-Based Applications
4.5.1 Overview
4.5.2 Market Size and Forecast by Vertical
4.5.3 Market Size and Forecast by Countries
4.6 Others
4.6.1 Overview
4.6.2 Market Size and Forecast by Verticals
4.6.3 Market Size and Forecast by Countries
5 CHINA Text Analytics Market Size and Forecast by Users
5.1 Introduction
5.1.1 Market Size and Forecast
5.2 Small and Medium Businesses
5.2.1 Overview
5.2.2 Market Size and Forecast by Countries
5.3 Enterprises
5.3.1 Overview
5.3.2 Market Size and Forecast by Countries
6 CHINA Text Analytics Market Size and Forecast by Deployment Model
6.1 Introduction
6.1.1 Market Size and Forecast
6.2 Cloud
6.2.1 Overview
6.2.2 Market Size and Forecast by Countries
6.3 On Premise
6.3.1 Overview
6.3.2 Market Size and Forecast by Countries
7 CHINA Text Analytics Market Size and Forecast by Verticals
7.1 Introduction
7.1.1 Market Size and Forecast
7.2 Banking, Financial Services, and Insurance (BFSI)
7.2.1 Overview
7.2.2 Market Size and Forecast by Countries
7.3 Consumer Packaged Goods
7.3.1 Overview
7.3.2 Market Size and Forecast by Countries
7.4 Healthcare and Pharma
7.4.1 Overview
7.4.2 Market Size and Forecast by Countries
7.5 High Tech
7.5.1 Overview
7.5.2 Market Size and Forecast by Countries
7.6 Manufacturing
7.6.1 Overview
7.6.2 Market Size and Forecast by Countries
7.7 Retail and Hospitality
7.7.1 Overview
7.7.2 Market Size and Forecast by Countries
7.8 Telecommunications
7.8.1 Overview
7.8.2 Market Size and Forecast by Countries
7.9 Others
7.9.1 Overview
7.9.2 Market Size and Forecast by Countries
8 CHINA Text Analytics Market Landscape
8.1 Competitive Landscape
8.1.1 Ecosystem and Roles
8.1.2 Portfolio Comparison
8.2 End User Landscape
8.2.1 Market Opportunity Analysis
8.2.2 End User Analysis
9 Company Profiles (Overview, Products & Services, Strategies & Insights, Developments, MMM View)
9.1 Attensity
9.2 Clarabridge
9.3 Hewlett Packard
9.4 IBM
9.5 Microsoft
9.6 Oracle
9.7 SAP
9.8 SAS
9.9 Tableau Software
9.10 Tibco Software
Appendix
Mergers and Acquisitions
Venture Capital Funding
List Of Tables
Table 1 China Text Analytics Market Size, 2014-2019 ($Billion)
Table 2 Impact Analysis Of Dro
Table 3 China Text Analytics Market Size, By Applications, 2014-2019 ($Million)
Table 4 China Text Analytics Market, By Applications, 2014-2019 (Y-O-Y %)
Table 5 China Enterprise Applications Market Size, By Verticals, 2014-2019 ($Million)
Table 6 China Enterprise Applications Market, By Verticals, 2014-2019 (Y-O-Y %)
Table 7 China Enterprise Applications Market Size, By Countries, 2014-2019 ($Million)
Table 8 China Enterprise Applications Market, By Countries, 2014-2019 (Y-O-Y %)
Table 9 China Web-Based And Software Applications Market Size, By Verticals, 2014-2019 ($Million)
Table 10 China Web-Based And Software Applications Market, By Verticals, 2014-2019 (Y-O-Y %)
Table 11 China Web-Based And Software Applications Market Size, By Countries, 2014-2019 ($Million)
Table 12 China Web-Based And Software Applications Market, By Countries, 2014-2019 (Y-O-Y %)
Table 13 China Data Analysis Applications Market Size, By Verticals, 2014-2019 ($Million)
Table 14 China Data Analysis Applications Market, By Verticals, 2014-2019 (Y-O-Y %)
Table 15 China Data Analysis Applications Market Size, By Countries, 2014-2019 ($Million)
Table 16 China Data Analysis Applications Market, By Countries, 2014-2019 (Y-O-Y %)
Table 17 China Search-Based Applications Market Size, By Verticals, 2014-2019 ($Million)
Table 18 China Search-Based Applications Market, By Verticals, 2014-2019 (Y-O-Y %)
Table 19 China Search-Based Applications Market Size, By Countries, 2014-2019 ($Million)
Table 20 China Search-Based Applications Market, By Countries, 2014-2019 (Y-O-Y %)
Table 21 China Other Applications Market Size, By Verticals, 2014-2019 ($Million)
Table 22 China Other Applications Market, By Verticals, 2014-2019 (Y-O-Y %)
Table 23 China Other Applications Market Size, By Countries, 2014-2019 ($Million)
Table 24 China Other Applications Market, By Countries, 2014-2019 (Y-O-Y %)
Table 25 China Text Analytics: Market Size, By Users, 2014-2019 ($Million)
Table 26 China Market, By Users, 2014-2019 (Y-O-Y %)
Table 27 China Small And Medium Businesses Market Size, By Countries, 2014-2019 ($Million)
Table 28 China Small And Medium Businesses Market, By Countries, 2014-2019 (Y-O-Y %)
Table 29 China Enterprises Market Size, By Countries, 2014-2019 ($Million)
Table 30 China Enterprises Market, By Countries, 2014-2019 (Y-O-Y %)
Table 31 China Market Size, By Deployment Model, 2014-2019 ($Million)
Table 32 China Text Analytics Market, By Deployment Model, 2014-2019 (Y-O-Y %)
Table 33 China Cloud Market Size, By Countries, 2014-2019 ($Million)
Table 34 China Cloud Market, By Countries, 2014-2019 (Y-O-Y %)
Table 35 China On Premise Market Size, By Countries, 2014-2019 ($ Million)
Table 36 China On Premise Market, By Countries, 2014-2019 (Y-O-Y %)
Table 37 China Market Size, By Verticals, 2014-2019 ($ Million)
Table 38 China Text Analytics Market, By Verticals, 2014-2019 (Y-O-Y %)
Table 39 China Bfsi Market Size, By Countries, 2014-2019 ($Million)
Table 40 China Bfsi Market, By Countries, 2014-2019 (Y-O-Y %)
Table 41 China Consumer Packaged Goods Market Size, By Countries, 2014-2019 ($Million)
Table 42 China Consumer Packaged Goods Market, By Countries, 2014-2019 (Y-O-Y %)
Table 43 China Healthcare And Pharma Market Size, By Countries, 2014-2019 ($ Million)
Table 44 China Healthcare And Pharma Market, By Countries, 2014-2019 (Y-O-Y %)
Table 45 China High Tech Market Size, By Countries, 2014-2019 ($Million)
Table 46 China High Tech Market, By Countries, 2014-2019 (Y-O-Y %)
Table 47 China Manufacturing Market Size, By Countries, 2014-2019 ($Million)
Table 48 China Manufacturing Market, By Countries, 2014-2019 (Y-O-Y %)
Table 49 China Retail And Hospitality Market Size, By Countries, 2014-2019 ($Million)
Table 50 China Retail And Hospitality Market, By Countries, 2014-2019 (Y-O-Y %)
Table 51 China Telecommunications Market Size, By Countries, 2014-2019 ($Million)
Table 52 China Telecommunications Market, By Countries, 2014-2019 (Y-O-Y %)
Table 53 China Others Market Size, By Countries, 2014-2019 ($Million)
Table 54 China Others Market, By Countries, 2014-2019 (Y-O-Y %)
Table 55 China Text Analytics Market Size, By Countries, 2014-2019 ($Million)
Table 56 China Text Analytics Market, By Countries, 2014-2019 (Y-O-Y %)
Table 57 China Market Size, By Applications, 2014-2019 ($Million)
Table 58 China Market, By Applications, 2014-2019 (Y-O-Y %)
Table 59 China Text Analytics Mergers And Acquisitions
Table 60 China Text Analytics Venture Capital Funding
List Of Figures
Figure 1 Data Triangulation
Figure 2 China Text Analytics Market Size And Growth Rate, 2014-2019 ($Billion, Y-O-Y %)
Figure 3 China Market Evolution
Figure 4 China Text Analytics: Market Segmentation
Figure 5 Value Chain
Figure 6 China Text Analytics: Market, By Applications, 2014-2019 (Y-O-Y %)
Figure 7 China Enterprise Applications Market, By Verticals, 2014-2019 (Y-O-Y %)
Figure 8 China Enterprise Applications Market, By Countries, 2014-2019 (Y-O-Y %)
Figure 9 China Web-Based And Software Applications Market, By Verticals, 2014-2019 (Y-O-Y %)
Figure 10 China Web-Based And Software Applications Market, By Countries, 2014-2019 (Y-O-Y %)
Figure 11 China Data Analysis Applications Market, By Verticals, 2014-2019 (Y-O-Y %)
Figure 12 China Data Analysis Applications Market, By Countries, 2014-2019 (Y-O-Y %)
Figure 13 China Search-Based Applications Market, By Verticals, 2014-2019 (Y-O-Y %)
Figure 14 China Search-Based Applications Market, By Countries,2014-2019 (Y-O-Y %)
Figure 15 China Other Applications Market, By Verticals, 2014-2019 (Y-O-Y %)
Figure 16 China Other Applications Market, By Countries, 2014-2019 (Y-O-Y %)
Figure 17 China Text Analytics Market, By Users, 2014-2019 (Y-O-Y %)
Figure 18 China Small And Medium Businesses Market, By Countries, 2014-2019 (Y-O-Y %)
Figure 19 China Enterprises Market, By Countries, 2014-2019 (Y-O-Y %)
Figure 20 China Text Analytics Market, By Deployment Model, 2014-2019 (Y-O-Y %)
Figure 21 China Cloud Market, By Countries, 2014-2019 (Y-O-Y %)
Figure 22 China On Premise Market, By Countries, 2014-2019 (Y-O-Y %)
Figure 23 China Text Analytics: Market, By Verticals, 2014-2019 (Y-O-Y %)
Figure 24 China Bfsi Market, By Countries, 2014-2019 (Y-O-Y %)
Figure 25 China Consumer Packaged Goods Market, By Countries, 2014-2019 (Y-O-Y %)
Figure 26 China Healthcare And Pharma Market, By Countries, 2014-2019, (Y-O-Y %)
Figure 27 China High Tech Market, By Countries, 2014-2019 (Y-O-Y %)
Figure 28 China Manufacturing Market, By Countries, 2014-2019 (Y-O-Y %)
Figure 29 China Retail And Hospitality Market, By Countries, 2014-2019 (Y-O-Y %)
Figure 30 China Telecommunications Market, By Countries, 2014-2019 (Y-O-Y %)
Figure 31 China Others Market, By Countries, 2014-2019 (Y-O-Y %)
Figure 32 China Text Analytics Parfait Chart
Figure 33 China Text Analytics Market, By Countries, 2014-2019 (Y-O-Y %)
Figure 34 China Market, By Applications, 2014-2019 (Y-O-Y %)
Figure 39 China Text Analytics Ecosystem
Figure 40 China Text Analytics Portfolio Comparison
Figure 41 China Text Analytics: Market Opportunity Analysis
Please fill in the form below to receive a free copy of the Summary of this Report
Please visit https://www.micromarketmonitor.com/custom-research-services.html to specify your custom Research Requirement


