

Asia-Pacific UV Curable Resins Market
- Publish Date: Upcoming


The Asia-Pacific UV curable resins market had been valued at $1.6 billion in 2013, and is expected to grow at 11.6% annually, to reach $2.8 billion by 2018.
The Asia-Pacific market is segmented on the basis of applications, end-users, and countries in the region, and the major applications include paints & coatings, inks, and adhesives.
What makes our report unique?
- The report provides competitive intelligence on Jiangsu Sanmu Group Co. Limited, Eternal Chemical Co., Ltd., Jiangsu Litian and Miwon Specialty Chemical Co. Ltd.
- You can request 10% customization in the research matching your exact requirement, for example, deep dive research in any specific geography or technology or applications.
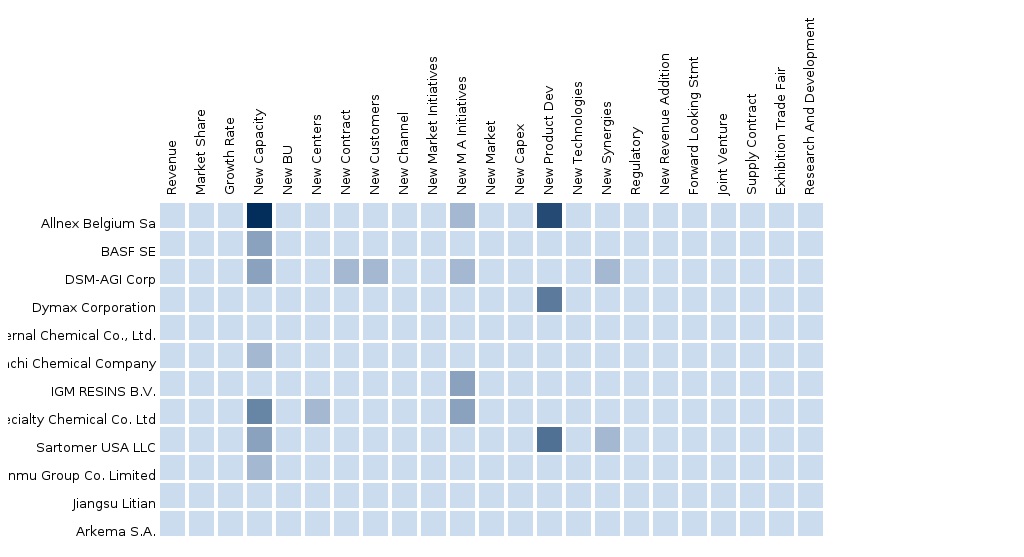
- This report provides competitive landscape of the top players. Under strategic benchmarking section, we will provide you their key developments along with the impacts including New Product development, M&A, strategic focus on any specific application, technology, geography. Under Financial, we will provide you CAPEX (Investments), Revenues, EBITDA. Under Operational insights, we will provide you new capacity added, New centers, new key employments. Under sales and marketing, we will provide you insight on new contracts (available on public domain), new distribution channels added, new marketing initiatives.
Key question answered
- What are market estimates and forecasts; which markets are doing well and which are not?
- What is the competitive landscape; who are the main players in each segment of the market; what are their strategic directives, operational strengths, key selling products, and product pipelines? Who is doing what?
Audience for this report
- Asia-Pacific UV Curable Resins companies
- Paints & Coatings, Inks, and Adhesive companies
- Associations and Industry Bodies.
1 INTRODUCTION 13
1.1 OBJECTIVES OF THE STUDY 13
1.2 REPORT DESCRIPTION 13
1.3 MARKETS COVERED 14
1.3.1 UV CURABLE RESINS MARKET BY APPLICATIONS 14
1.3.2 UV CURABLE RESINS MARKET BY END-USER 14
1.3.3 UV CURABLE RESINS MARKET BY GEOGRAPHIES 14
1.4 STAKEHOLDERS 14
1.5 RESEARCH METHODOLOGY 15
1.6 ASSUMPTIONS 15
2 MARKET SNAPSHOT 16
3 MARKET OVERVIEW 18
3.1 INTRODUCTION 19
3.1.1 AVERAGE SELLING PRICE 19
3.1.2 REGIONAL MARKET SUMMARY 19
3.2 MARKET DYNAMICS 23
3.2.1 DRIVERS 23
3.2.1.1 Growing Electronics Market 23
3.2.2 RESTRAINTS 24
3.2.2.1 Not attractive in price competitive markets 24
3.2.3 OPPORTUNITIES 25
3.2.3.1 Diversifying target segments & Potential markets with low capacities 25
4 UV CURABLE RESINS in ASIA-PACIFIC, BY APPLICATIONS 26
4.1 SPLIT BY GEOGRAPHY 27
4.1.1 ASIA-PACIFIC-PAINTS & COATINGS 27
4.1.1.1 India-Paints & Coatings 28
4.1.1.2 China-Paints & Coatings 28
4.1.1.3 Japan-Paints & Coatings 28
4.1.1.4 South Korea-Paints & Coatings 29
4.1.1.5 Taiwan-Paints & Coatings 29
4.1.2 ASIA-PACIFIC-INKS 29
4.1.2.1 India-Inks 30
4.1.2.2 China-Inks 31
4.1.2.3 Japan-Inks 31
4.1.2.4 South Korea-Inks 31
4.1.2.5 Taiwan-Inks 31
4.1.3 ASIA-PACIFIC-ADHESIVE 31
4.1.3.1 India-Adhesive 33
4.1.3.2 China-Adhesive 33
4.1.3.3 Japan-Adhesive 33
4.1.3.4 South Korea-Adhesive 33
4.1.3.5 Taiwan-Adhesive 34
4.1.4 ASIA-PACIFIC-OTHER APPLICATIONS 34
4.1.4.1 India-Other Applications 35
4.1.4.2 China-Other Applications 35
4.1.4.3 Japan-Other Applications 36
4.1.4.4 South Korea-Other Applications 36
4.1.4.5 Taiwan-Other Applications 36
5 UV CURABLE RESINS in ASIA-PACIFIC, BY END-USERS 37
5.1 SPLIT BY GEOGRAPHY 38
5.1.1 ASIA-PACIFIC-ELECTRICAL & ELECTRONICS 38
5.1.1.1 India-Electrical & Electronics 39
5.1.1.2 China-Electrical & Electronics 39
5.1.1.3 Japan-Electrical & Electronics 39
5.1.1.4 South Korea-Electrical & Electronics 40
5.1.1.5 Taiwan-Electrical & Electronics 40
5.1.2 ASIA-PACIFIC-INDUSTRIAL PAINTS & COATS 40
5.1.2.1 India-Industrial Paints & Coats 42
5.1.2.2 China-Industrial Paints & Coats 42
5.1.2.3 Japan-Industrial Paints & Coats 42
5.1.2.4 South Korea-Industrial Paints & Coats 42
5.1.2.5 Taiwan-Industrial Paints & Coats 42
5.1.3 ASIA-PACIFIC-GRAPHIC ARTS 43
5.1.3.1 India-Graphic Arts 44
5.1.3.2 China-Graphic Arts 44
5.1.3.3 Japan-Graphic Arts 44
5.1.3.4 South Korea-Graphic Arts 45
5.1.3.5 Taiwan-Graphic Arts 45
5.1.4 ASIA-PACIFIC-OTHER END-USERS 45
5.1.4.1 India-Other End-Users 46
5.1.4.2 China-Other End-Users 47
5.1.4.3 Japan-Other End-Users 47
5.1.4.4 South Korea-Other End-Users 47
5.1.4.5 Taiwan-Other End-Users 47
6 UV CURABLE RESINS in ASIA-PACIFIC, BY GEOGRAPHIES 48
6.1 INDIA 49
6.1.1 INDIA, BY APPLICATIONS 49
6.1.1.1 India-Paints & Coatings 50
6.1.1.2 India-Inks 50
6.1.1.3 India-Adhesive 50
6.1.1.4 India-Other Applications 50
6.1.2 INDIA, BY END-USERS 51
6.1.2.1 India-Industrial Paints & Coats 52
6.1.2.2 India-Graphic Arts 52
6.1.2.3 India-Electrical & Electronics 52
6.1.2.4 India-Other End-Users 53
6.2 CHINA 53
6.2.1 CHINA, BY APPLICATIONS 53
6.2.1.1 China-Paints & Coatings 54
6.2.1.2 China-Inks 54
6.2.1.3 China-Adhesive 54
6.2.1.4 China-Other Applications 55
6.2.2 CHINA, BY END-USERS 55
6.2.2.1 China-Electrical & Electronics 56
6.2.2.2 China-Industrial Paints & Coats 56
6.2.2.3 China-Graphic Arts 57
6.2.2.4 China-Other End-Users 57
6.3 JAPAN 57
6.3.1 JAPAN, BY APPLICATIONS 57
6.3.1.1 Japan-Paints & Coatings 58
6.3.1.2 Japan-Inks 58
6.3.1.3 Japan-Adhesive 59
6.3.1.4 Japan-Other Applications 59
6.3.2 JAPAN, BY END-USERS 59
6.3.2.1 Japan-Electrical & Electronics 60
6.3.2.2 Japan-Industrial Paints & Coats 61
6.3.2.3 Japan-Graphic Arts 61
6.3.2.4 Japan-Other End-Users 61
6.4 SOUTH KOREA 61
6.4.1 SOUTH KOREA, BY APPLICATIONS 61
6.4.1.1 South Korea-Paints & Coatings 62
6.4.1.2 South Korea-Inks 63
6.4.1.3 South Korea-Adhesive 63
6.4.1.4 South Korea-Other Applications 63
6.4.2 SOUTH KOREA, BY END-USERS 63
6.4.2.1 South Korea-Electrical & Electronics 64
6.4.2.2 South Korea-Industrial Paints & Coats 65
6.4.2.3 South Korea-Graphic Arts 65
6.4.2.4 South Korea-Other End-Users 65
6.5 TAIWAN 65
6.5.1 TAIWAN, BY APPLICATIONS 65
6.5.1.1 Taiwan-Paints & Coatings 67
6.5.1.2 Taiwan-Inks 67
6.5.1.3 Taiwan-Adhesive 67
6.5.1.4 Taiwan-Other Applications 67
6.5.2 TAIWAN, BY END-USERS 67
6.5.2.1 Taiwan-Electrical & Electronics 69
6.5.2.2 Taiwan-Industrial Paints & Coats 69
6.5.2.3 Taiwan-Graphic Arts 69
6.5.2.4 Taiwan-Other End-Users 69
7 COMPETITIVE LANDSCAPE 70
7.1 ASIA-PACIFIC-BY COMPANIES 70
7.2 ASIA-PACIFIC-MARKET DEVELOPMENTS 70
8 COMPANY PROFILES 74
8.1 ETERNAL CHEMICAL CO. LTD 74
8.1.1 OVERVIEW 74
8.1.2 PRODUCT PORTFOLIO 74
8.1.3 FINANCIALS 74
8.2 JIANGSU SANMU 75
8.2.1 OVERVIEW 75
8.2.2 PRODUCT PORTFOLIO 75
8.3 JIANGSU LITIAN TECHNOLOGY CO. LTD 75
8.3.1 OVERVIEW 75
8.3.2 PRODUCT PORTFOLIO 75
8.4 MIWON SPECIALTY CHEMICALS 76
8.4.1 OVERVIEW 76
8.4.2 PRODUCT PORTFOLIO 76
8.5 ALLENEX BELGIUM SA 76
8.5.1 OVERVIEW 76
8.5.2 PRODUCT PORTFOLIO 76
8.6 DSM AGI CORP 76
8.6.1 OVERVIEW 76
8.6.2 PRODUCT PORTFOLIO 77
8.6.3 FINANCIALS 77
8.7 HITACHI CHEMICAL COMPANY 77
8.7.1 OVERVIEW 77
8.7.2 PRODUCT PORTFOLIO 77
8.7.3 FINANCIALS 78
8.8 SARTOMER USA LLC 78
8.8.1 OVERVIEW 78
8.8.2 PRODUCT PORTFOLIO 78
9 TECHNICAL INSIGHTS 80
9.1 INTRODUCTION 80
9.1.1 MONOMERS 80
9.1.2 OLIGOMERS 81
9.1.3 PHOTOINITIATORS 82
LIST OF TABLES
TABLE 1 GLOBAL UV CURABLE RESINS MARKET, 2012 – 2018 (KT) 16
TABLE 2 GLOBAL UV CURABLE RESINS MARKET, 2012 – 2018 ($MILLION) 16
TABLE 3 UV CURABLE RESINS MARKET-ASIA-PACIFIC AVERAGE SELLING PRICE, 2012 – 2018 ($MILLION) 19
TABLE 4 UV CURABLE RESINS MARKET-ASIA-PACIFIC MARKET VALUES, BY APPLICATIONS, 2012 – 2018 ($MILLION) 19
TABLE 5 UV CURABLE RESINS MARKET-ASIA-PACIFIC MARKET VOLUME, BY APPLICATIONS, 2012 – 2018 (TONS) 20
TABLE 6 UV CURABLE RESINS MARKET-ASIA-PACIFIC MARKET VALUES, BY END-USERS, 2012 – 2018 ($MILLION) 21
TABLE 7 UV CURABLE RESINS MARKET-ASIA-PACIFIC MARKET VOLUME, BY END-USERS, 2013 – 2018, (TONS) 21
TABLE 8 UV CURABLE RESINS MARKET-ASIA-PACIFIC MARKET VALUES, BY GEOGRAPHIES, 2013 – 2018 ($MILLION) 22
TABLE 9 UV CURABLE RESINS MARKET-ASIA-PACIFIC MARKET VOLUME, BY GEOGRAPHIES, 2013 – 2018 (TONS) 23
TABLE 10 CONSUMER ELECTRONICS: MARKET VOLUME (BILLION UNITS) & VALUE ($BILLION), 2008-2012 24
TABLE 11 ASIA-PACIFIC-PAINTS & COATINGS MARKET VALUES, BY GEOGRAPHIES, 2012-2018 ($MILLION) 27
TABLE 12 ASIA-PACIFIC-PAINTS & COATINGS MARKET VOLUME, BY GEOGRAPHIES, 2012-2018 (TONS) 27
TABLE 13 ASIA-PACIFIC-INKS VALUES BY GEOGRAPHIES, 2012-2018 ($THOUSANDS) 29
TABLE 14 ASIA-PACIFIC-INKS MARKET VOLUME, BY GEOGRAPHIES, 2012-2018 (TONS) 30
TABLE 15 ASIA-PACIFIC-ADHESIVE MARKET VALUES, BY GEOGRAPHIES, 2013-2018 ($THOUSANDS) 31
TABLE 16 ASIA-PACIFIC-ADHESIVE MARKET VOLUME, BY GEOGRAPHIES, 2012-2018 (TONS) 32
TABLE 17 ASIA-PACIFIC-OTHER APPLICATIONS MARKET VALUES, BY GEOGRAPHIES, 2012-2018 ($THOUSANDS) 34
TABLE 18 ASIA-PACIFIC-OTHER APPLICATIONS MARKET VOLUME, BY GEOGRAPHIES, 2012-2018 (TONS) 35
TABLE 19 ASIA-PACIFIC-ELECTRICAL & ELECTRONICS MARKET VALUES, BY GEOGRAPHIES, 2012-2018 ($THOUSANDS) 38
TABLE 20 ASIA-PACIFIC-ELECTRICAL & ELECTRONICS MARKET VOLUME, BY GEOGRAPHIES, 2012-2018 (TONS) 38
TABLE 21 ASIA-PACIFIC-INDUSTRIAL PAINTS & COATS MARKET VALUES, BY GEOGRAPHIES, 2012-2018 ($MILLION) 40
TABLE 22 ASIA-PACIFIC-INDUSTRIAL PAINTS & COATS MARKET VOLUME, BY GEOGRAPHIES, 2012-2018 (TONS) 41
TABLE 23 ASIA-PACIFIC-GRAPHIC ARTS MARKET VALUES, BY GEOGRAPHIES, 2012-2018 ($MILLION) 43
TABLE 24 ASIA-PACIFIC-GRAPHIC ARTS MARKET VOLUME, BY GEOGRAPHIES, 2012-2018 (TONS) 43
TABLE 25 ASIA-PACIFIC-OTHER END-USERS MARKET VALUES, BY GEOGRAPHIES, 2012-2018 ($THOUSANDS) 45
TABLE 26 ASIA-PACIFIC-OTHER END-USERS MARKET VOLUME, BY GEOGRAPHIES, 2012-2018 (TONS) 46
TABLE 27 MARKET VALUES-INDIA, BY APPLICATIONS, 2012-2018 ($THOUSANDS) 49
TABLE 28 MARKET VOLUME-INDIA, BY APPLICATIONS, 2012-2018 (TONS) 49
TABLE 29 MARKET VALUES-INDIA, BY END-USERS, 2012-2018 ($THOUSANDS) 51
TABLE 30 MARKET VOLUME-INDIA, BY END-USERS, 2012-2018 (TONS) 51
TABLE 31 MARKET VALUES-CHINA, BY APPLICATIONS, 2012-2018 ($MILLION) 53
TABLE 32 MARKET VOLUME-CHINA, BY APPLICATIONS, 2012-2018 (TONS) 54
TABLE 33 MARKET VALUES-CHINA, BY END-USERS, 2012-2018 ($MILLION) 55
TABLE 34 MARKET VOLUME-CHINA, BY END-USERS, 2012-2018 (TONS) 56
TABLE 35 MARKET VALUES-JAPAN, BY APPLICATIONS, 2012-2018 ($THOUSANDS) 57
TABLE 36 MARKET VOLUME-JAPAN, BY APPLICATIONS, 2012-2018 (TONS) 58
TABLE 37 MARKET VALUES-JAPAN, BY END-USERS, 2012-2018 ($THOUSANDS) 59
TABLE 38 MARKET VOLUME-JAPAN, BY END-USERS, 2012-2018 (TONS) 60
TABLE 39 MARKET VALUES-SOUTH KOREA, BY APPLICATIONS, 2012-2018 ($THOUSANDS) 61
TABLE 40 MARKET VOLUME-SOUTH KOREA, BY APPLICATIONS, 2012-2018 (TONS) 62
TABLE 41 MARKET VALUE-SOUTH KOREA, BY END-USERS, 2012-2018 ($THOUSANDS) 63
TABLE 42 MARKET VOLUME-SOUTH KOREA, BY END-USERS, 2012-2018 (TONS) 64
TABLE 43 MARKET VALUES-TAIWAN, BY APPLICATIONS, 2012-2018 ($THOUSANDS) 65
TABLE 44 MARKET VOLUME-TAIWAN, BY APPLICATIONS, 2012-2018 (TONS) 66
TABLE 45 MARKET VALUES-TAIWAN, BY END-USERS, 2012-2018 ($THOUSANDS) 68
TABLE 46 MARKET VOLUME-TAIWAN, BY END-USERS, 2012-2018 (TONS) 68
TABLE 47 ASIA-PACIFIC MARKET VALUES, BY COMPANIES, 2013 – 2018 ($MILLION) 70
TABLE 48 EXPANSIONS 70
TABLE 49 AGREEMENT AND CONTRACT 72
TABLE 50 MERGER AND ACQUISITION 73
TABLE 51 NEW PRODUCT LAUNCH 73
TABLE 52 74
TABLE 53 ETERNAL CHEMICAL CO. LTD: ANNUAL REVENUE, BY BUSINESS SEGMENTS, 2011–2012 ($MILLION) 74
TABLE 54 DSM AGI: ANNUAL REVENUE, 2008-2012($MILLION) 77
TABLE 55 HITACHI CHEMICAL COMPANY: ANNUAL REVENUE, 2008-2012($MILLION) 78
TABLE 56 RADICAL VS CATIONIC CURE 80
TABLE 57 OLIGOMERS: TYPES & PERFORMANCE EFFECTS 81
Please fill in the form below to receive a free copy of the Summary of this Report
Please visit https://www.micromarketmonitor.com/custom-research-services.html to specify your custom Research Requirement


