

Asia-Pacific Lubricants Market by Type (Mineral Oil Lubricants, Synthetic Lubricants, Bio-based Lubricants, and Greases), by Application (Transportation, and Industrial Machinery & Equipment) - Global Trends & Forecasts to 2020
- Publish Date: Nov 2015


Lubricants are used widely across various industries as it offers low operating costs. They are mostly used in engine oils for transportation. Reducing friction between moving surfaces and thereby enhance the operation by keeping the vehicles fleet ready and moving is the primary function of lubricants. In automotive engines, lubricants play an important role of cleaning and cooling the engine. They also help to reduce the engine wear and tear caused by the friction of its metal parts, as well as to carry off heat.
Factors such as rapid expansion of the automotive industry and industrialization in the Asia-Pacific region are driving the overall demand for lubricants.
Furthermore, considerable amount of investments in expansion are made by various market players to provide variety of lubricants across various industries in the coming years. Due to the presence of major key players in the region, the market in China dominates the Asia-Pacific lubricants market having accounted for a share of 63.1% in 2014.
Various secondary sources, such as encyclopedia, directories, industry journals, and databases are used to identify and collect information useful for this extensive commercial study of the lubricants market market. The primary sources include experts from related industries and suppliers who have been interviewed to obtain and verify critical information as well as to assess the future prospects of the market.
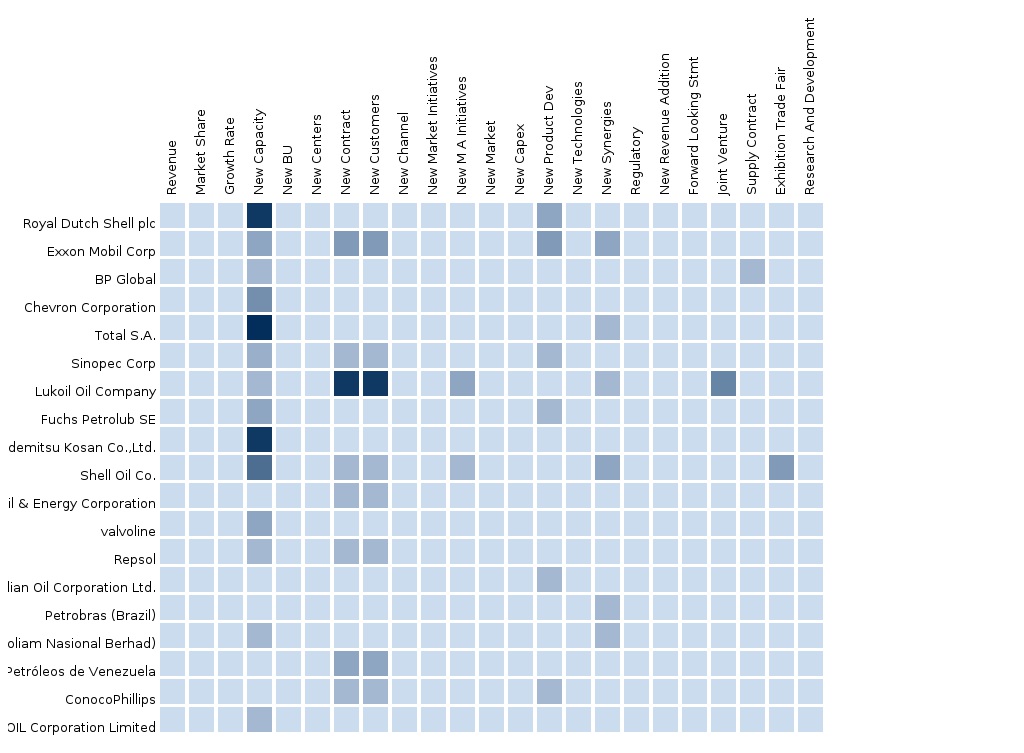
Competitive scenarios of the top players in the Asia-Pacific lubricants market has been discussed in detail. Leading players of this industry with their recent developments and other strategic industry activities are also covered in the report. The key players operational in the Asia-Pacific lubricants market are Royal Dutch Shell plc (The Netherlands), Exxon Mobil Corporation (U.S.), BP plc (U.K.), Chevron Corporation (U.S.), Total S.A. (France), PetroChina Company Limited (China), Sinopec Limited (China), and Idemitsu Kosan Co. Ltd. (Japan).
Scope of the report:
This research report categorizes the Asia-Pacific Lubricants market on the basis of applications, type, and geography along with forecasting volume, value, and analyzing trends in each of the sub-markets.
On the basis of application:
- Transportation
- Industrial Machinery & Equipment
On the basis of type:
- Mineral Oil Lubricants
- Synthetic Lubricants
- Bio-Based Lubricants
- Greases
Each application & type is described in detail in the report with volume and revenue forecasts for each application & type.
On the basis of country:
- China
- Japan
- India
- Thailand
- South Korea
- Australia & New Zealand
- Singapore
- Malaysia
- Taiwan
- Philippines
- Rest of Asia-Pacific
Table of Contents
1 Introduction
1.1 Objectives of the Study
1.2 Market Definition
1.3 Market Scope
1.3.1 Markets Covered
1.3.2 Years Considered in the Report
1.4 Currency and Pricing
1.5 Limitations
1.6 Stakeholders
2 Research Methodology
2.1 Market Size Estimation
2.2 Market Breakdown & Data Triangulation
2.3 Market Share Estimation
2.3.1 Key Insights
2.3.2 Assumptions
3 Executive Summary
4 Premium Insights
4.1 Attractive Opportunities in the Lubricants Market
4.2 Lubricants Market: Type Segments
4.3 Lubricants Market in Asia-Pacific
4.4 Lubricants Market Attractiveness
4.5 Lubricant Applications, By Region (2015)
5 Market Overview
5.1 Introduction
5.2 Market Segmentation
5.2.1 By Type
5.2.2 By Application
5.2.3 APAC, By Country
5.3 Market Dynamics
5.3.1 Drivers
5.3.1.1 Growing Automotive Industry in Asia-Pacific
5.3.1.2 Massive Industrial Growth in Asia-Pacific
5.3.1.3 Increased Consumer Awareness Coupled With Stringent Government Regulations Drives the Sales of Synthetic Lubricants
5.3.2 Restraints
5.3.2.1 Shift Toward Synthetic Lubricant Contracts the Demand For Mineral Oil Lubricant: Affecting the Overall Lubricant Market
5.3.2.2 High Prices of Synthetic & Bio-Based Lubricants Affects the Lubricants Market Growth
5.3.3 Opportunities
5.3.3.1 Bric Countries Are Expected to Be the Lucrative Markets
6 Industry Trends
6.1 Introduction
6.2 Value Chain Analysis
6.3 Porter’s Five Forces Analysis
6.3.1 Threat of New Entrants
6.3.2 Threat of Substitutes
6.3.3 Bargaining Power of Suppliers
6.3.4 Bargaining Power of Buyers
6.3.5 Intensity of Competitive Rivalry
7 Lubricants Market, By Type
7.1 Introduction
7.2 Market Size & Projection
7.2.1 Widespread Availability & Low Cost Drive the Consumption of Mineral Oil Lubricants
7.3 Mineral Oil Lubricants
7.4 Synthetic Lubricants
7.4.1 Asia-Pacific to Outpace North American Consumption
7.5 Bio-Based Lubricants
7.5.1 Biodegradable Nature of Bio-Based Lubricants to Drive the Demand
7.6 Greases
8 Lubricants Market, By Application
8.1 Introduction
8.2 Market Size & Projection
8.2.1 Growth in Automotive is Driving the Demand For Lubricants
8.3 Transportation
8.3.1 Passenger Vehicles Are the Largest Consumers of Lubricants in Transportation
8.4 Industrial Machinery & Equipment
8.4.1 Increased Manufacturing Activities in Asia-Pacific Encourages Growth in Lubricants Industry
9 Lubricants Market, By Country
9.1 Introduction
9.1.1 China: Largest Consumer of Lubricants With Growing Industrial Activities
9.2 Asia-Pacific
9.2.1 China
9.2.2 India
9.2.3 Japan
9.2.4 Taiwan
9.2.5 Thailand
9.2.6 Australia & New Zealand
9.2.7 Malaysia
9.2.8 South Korea
9.2.9 Singapore
9.2.10 Philippines
9.2.11 Rest of Asia-Pacific
10 Asia- Pacific Lubricants Market: Competitive Landscape
10.1 Expansions
10.2 New Product Development
10.3 Joint Ventures, Partnerships, and Collaborations
11 Asia Pacific Lubricants Market, By Company
11.1 Royal Dutch Shell Plc.
11.1.1 Overview
11.1.2 Key Financials
11.1.3 Product and Service Offerings
11.1.4 Related Developments
11.1.5 Swot Analysis
11.1.6 MMM View
11.2 Exxonmobil Corporation
11.2.1 Overview
11.2.2 Key Financials
11.2.3 Product and Service Offerings
11.2.4 Related Developments
11.2.5 MMM View
11.3 Bp Plc.
11.3.1 Overview
11.3.2 Key Financials
11.3.3 Product and Service Offerings
11.3.4 Related Developments
11.3.5 MMM View
11.4 Chevron Corporation
11.4.1 Overview
11.4.2 Key Financials
11.4.3 Product and Service Offerings
11.4.4 Related Developments
11.4.5 MMM View
11.5 Total S.A.
11.5.1 Overview
11.5.2 Key Financials
11.5.3 Product and Service Offerings
11.5.4 Related Developments
11.5.5 MMM View
11.6 Petrochina Company Limited
11.6.1 Overview
11.6.2 Key Financials
11.6.3 Product and Service Offerings
11.6.4 Related Developments
11.6.5 MMM View
11.7 Sinopec Limited
11.7.1 Overview
11.7.2 Key Financials
11.7.3 Product and Service Offerings
11.7.4 Related Developments
11.7.5 MMM View
11.8 Idemitsu Kosan Co. Ltd.
11.8.1 Overview
11.8.2 Key Financials
11.8.3 Product and Service Offerings
11.8.4 Related Developments
11.8.5 MMM View
12 Appendix
12.1 Related Reports
12.2 Customization Options
12.2.1 Asia Pacific Lubricants Market Types Matrix
12.2.2 Asia Pacific Lubricants Competitive Benchmarking
12.2.3 Asia Pacific Lubricants Market Vendor Landscaping
12.2.4 Asia Pacific Lubricants Market Data Tracker
12.2.5 Asia Pacific Lubricants Market Emerging Vendor Landscape
12.2.6 Asia Pacific Lubricants Market Channel Analysis
12.3 Introducing Rt: Real Time Market Intelligence
List of Tables
Table 1 Lubricants By Base Oil
Table 2 Asia-Pacific Lubricants Market, By Type, 2015–2020 (USD Mn)
Table 3 Mineral Oil Lubricants Market, By Country, 2013–2020 (USD Mn)
Table 4 Synthetic Lubricants Market, By Country, 2013–2020 (USD Mn)
Table 5 Bio-Based Lubricants Market, By Country, 2013–2020 (USD Mn)
Table 6 Greases Market , By Country, 2013–2020 (USD Mn)
Table 7 Lubricants Market Size, By Application, 2013–2020 (Kt)
Table 8 Lubricants in Transportation Market, By Type, 2013–2020 (Kt)
Table 9 Lubricants in Transportation Market, By Country, 2013–2020 (Kt)
Table 10 Lubricants in Industrial Machinery & Equipment Market, By Country, 2013–2020 (Kt)
Table 11 Lubricants Market, By Country, 2013–2020 (Kt)
Table 12 Lubricants Market Size, By Country, 2013–2020 (USD Million)
Table 13 Asia-Pacific: Lubricants Market, By Type, 2013–2020 (Kt)
Table 14 Asia-Pacific: Lubricants Market, By Application, 2013–2020 (Kt)
Table 15 China: Lubricants Market, By Type, 2013–2020 (Kt)
Table 16 China: Lubricants Market, By Application, 2013–2020 (Kt)
Table 17 India: Lubricants Market, By Type, 2013–2020 (Kt)
Table 18 India: Lubricants Market, By Application, 2013–2020 (Kt)
Table 19 Japan: Lubricants Market, By Type, 2013–2020 (Kt)
Table 20 Japan: Lubricants Market, By Application, 2013–2020 (Kt)
Table 21 Taiwan: Lubricants Market, By Type, 2013–2020 (Kt)
Table 22 Taiwan: Lubricants Market, By Application, 2013–2020 (Kt)
Table 23 Thailand: Lubricants Market, By Type, 2013–2020 (Kt)
Table 24 Thailand: Lubricants Market, By Application, 2013–2020 (Kt)
Table 25 Australia & New Zealand: Lubricants Market, By Type, 2013–2020 (Kt)
Table 26 Australia & New Zealand: Lubricants Market, By Application, 2013–2020 (Kt)
Table 27 Malaysia: Lubricants Market, By Type, 2013–2020 (Kt)
Table 28 Malaysia: Lubricants Market, By Application, 2013–2020 (Kt)
Table 29 South Korea: Lubricants Market, By Type, 2013–2020 (Kt)
Table 30 South Korea: Lubricants Market, By Application, 2013–2020 (Kt)
Table 31 Singapore: Lubricants Market, By Type, 2013–2020 (Kt)
Table 32 Singapore: Lubricants Market, By Application, 2013–2020 (Kt)
Table 33 Philippines: Lubricants Market, By Type, 2013–2020 (Kt)
Table 34 Philippines: Lubricants Market, By Application, 2013–2020 (Kt)
Table 35 Rest of Asia-Pacific: Lubricants Market, By Type, 2013–2020 (Kt)
Table 36 Rest of Asia-Pacific: Lubricants Market, By Application, 2013–2020 (Kt)
Table 37 Asia Pacific Lubricants Market: Expansions
Table 38 Asia Pacific Lubricants Market: New Product Development
Table 39 Asia Pacific Lubricants Market: Joint Ventures, Partnerships, and Collaborations
Table 40 Royal Dutch Shell Plc. : Key Financials, 2010-2014 (USD Billion)
Table 41 Exxonmobil Corporation : Key Financials, 2010-2014 (USD Billion)
Table 42 Bp Plc.: Key Financials, 2010-2014 (USD Billion)
Table 43 Chevron Corporation: Key Financials, 2010-2014 (USD Billion)
Table 44 Total S.A.: Key Financials, 2010-2014 (USD Billion)
Table 45 Petrochina Company Limited : Key Financials, 2010-2014 (USD Billion)
Table 46 Sinopec Limited: Key Financials, 2010-2014 (USD Billion)
Table 47 Idemitsu Kosan Co. Ltd.: Key Financials, 2010-2014 (USD Billion)
List of Figures
Figure 1 Asia-Pacific Lubricants Market
Figure 2 Market Size Estimation: Bottom-Up Approach
Figure 3 Market Size Estimation: Top-Down Approach
Figure 4 Break Down of Primary Interviews, By Company Type, Designation & Region
Figure 5 Key Data From Secondary Sources
Figure 6 Key Data From Primary Sources
Figure 7 Mineral Oil Lubricants Expected to Dominate the Lubricants Market, 2015 & 2020
Figure 8 Asia-Pacific to Register Highest Growth Rate, 2014
Figure 9 Growth in the Lubricants Market, (2015-2020)
Figure 10 Synthetic & Bio-Based Lubricants to Grow At the Fastest Rate
Figure 11 China Captures the Lion’s Share in the Asia-Pacific Lubricants Market
Figure 12 India & Philippines Are the Fastest Growing Lubricants Market
Figure 13 India to Register High Growth Rate
Figure 14 Lubricants Formulation
Figure 15 Lubricants Market Segmentation, By Type
Figure 16 Lubricants Market Segmentation, By Application
Figure 17 Lubricant Market Segmentation, By Country
Figure 18 Overview of the Forces Affecting the Lubricants Market
Figure 19 Market Impact Vis-À-Vis Increasing Use of Synthetic Lubricants
Figure 20 Value Chain Analysis For Lubricants
Figure 21 Porter’s Five Forces Analysis (2013)
Figure 22 Grease Expected Register the Highest Cagr Between 2015 and 2020
Figure 23 India to Drive the Asia-Pacific Mineral Oil Lubricants Market
Figure 24 High Performance Characteristics of Synthetic Lubricants to Drive the Market
Figure 25 China is the Biggest Contributor to the Bio-Based Lubricants Segment
Figure 26 India & China to Witness the Fastest Growth in Grease Segment Between 2015 and 2020
Figure 27 Transportation Segment Qualifies the Highest Consumption
Figure 28 Increasing Use of Different Modes of Transport Fuels the Demand of Lubricants
Figure 29 Regional Snapshot (2015– 2020) — Asia-Pacific is the Fastest Growing Lubricants Market
Figure 30 Synthetic Lubricants to Gradually Replace Mineral Oil Lubricants in Some Countries
Figure 31 Asia-Pacific Market Snapshot: China & India Are the Most Lucrative Markets
Figure 32 Asia-Pacific Lubricants Market: Company Share Analysis, 2014(%)
Figure 33 Asia-Pacific Lubricants Market: Country Wise Market Share
Figure 34 Royal Dutch Shell Plc. : Revenue Mix
Figure 35 Royal Dutch Shell Plc. : Swot Analysis
Figure 36 Exxonmobil Corporation : Revenue Mix
Figure 37 Exxonmobil Corporation : Swot Analysis
Figure 38 Bp Plc.: Revenue Mix
Figure 39 Bp Plc. : Swot Analysis
Figure 40 Chevron: Revenue Mix, 2014
Figure 41 Chevron Corporation : Swot Analysis
Figure 42 Total S.A.: Revenue Mix, 2014
Figure 43 Total S.A. : Swot Analysis
Figure 44 Petrochina Company Limited : Revenue Mix, 2014
Figure 45 Petrochina Company Limited : Swot Analysis
Figure 46 Sinopec Limited : Revenue Mix
Figure 47 Sinopec Limited: Swot Analysis
Figure 48 Idemitsu Kosan Co. Ltd.: Revenue Mix
Figure 49 Idemitsu Kosan Co. Ltd. : Swot Analysis
Lubricants are a mixture of base oils and additives, in which the additives help to enhance, add, or suppress properties of the base oil. They are usually manufactured in the liquid or semi-solid state and are utilized to reduce the friction between moving surfaces of machines and equipment. In addition, lubricants also help reduce wear and tear of machinery and prevent overheating and corrosion. The efficiency of machinery essentially depends on the lubricant and the method of application. Thus, lubricants play a vital role in the smooth functioning of machinery.
The Asia-Pacific lubricants market was estimated at USD 70,555.2 million in 2015, and is expected to reach USD 82, 968.9 million by 2020, at a CAGR of 3.3% from 2015 to 2020. The mineral lubricants segment dominated the Asia-Pacific lubricants market, and is estimated at USD 52,925.0 MN in 2015.
The Asia-Pacific lubricants market is segmented on the basis of type, application, and country. On the basis of type, the market includes mineral oil lubricants, synthetic lubricants, bio-based lubricants, and greases. The greases type segment is expected to grow at a highest CAGR of 3.5% from 2015 to 2020, and accounted for a market share of 4.3% in 2014. By application, the market is segmented into transportation and industrial machinery & equipment. The transportation application is further segmented into commercial vehicles, passenger vehicles, aviation, and marine. The commercial vehicles segment contributed the largest share of, having accounted for a share of 23.7% in 2014. However, the passenger vehicles segment is expected to grow at the highest CAGR of 3.5% from 2015 to 2020
Lubricants utilized in all the aforementioned applications are of different grades and have different technical specifications such as viscosity, index, and density. The use of lubricants in both the applications is crucial for high performance of vehicles and longer machine life.
The market in China was valued at USD 4,706.8 million in 2015, and is expected to reach USD 5,415.7 million by 2020, at a CAGR of 2.8% during the forecast period. The market in Japan is expected to grow at a CAGR of 3.2% from 2015 to 2020, to reach a value of USD 1,645.9 million. India and Philippines are expected to grow at a CAGR of 4.4% and 3.6%, respectively from 2015 to 2020. The transportation application segment dominated the Asia-Pacific lubricants market, having accounted for a share of 59.9% (in terms of value) in 2014.
The key players operational in the Asia-Pacific lubricants market are Royal Dutch Shell plc (The Netherlands), Exxon Mobil Corporation (U.S.), BP plc (U.K.), Chevron Corporation (U.S.), Total S.A. (France), PetroChina Company Limited (China), Sinopec Limited (China), and Idemitsu Kosan Co. Ltd. (Japan).
Please visit https://www.micromarketmonitor.com/custom-research-services.html to specify your custom Research Requirement


