

Asia-Pacific Image Sensor Market by Technology (CMOS, CCD and Contact Image Sensor) and by Application (Medical, Automotive, Defense & Aerospace, Consumer, Surveillance, Industrial and Others) and by Country - Analysis And Forecast to 2019
- Publish Date: May 2015


The APAC image sensor market was valued at $3.42 billion in 2014 and is expected to reach a value of $4.57 billion by 2019, at a CAGR of 5.9% during the forecast period of 2014 to 2019.
Image sensors have been around since the advent of digital cameras and image reproducing devices. It is a device that converts an optical image into an electronic signal. It is used mostly in digital cameras, camera in smartphones, and other imaging devices. CCD and CMOS are the latest technologically advanced image sensors that accomplish the task of capturing the light and converting them to electrical signals. APAC has emerged as a promising market for image sensors. With the transition from analog to digital systems gaining pace, APAC is expected to be the largest market for image sensors in the coming years.
CMOS, CCD, and Contact image sensors are the most widely used image sensors in the market. CCD and CMOS comprise the latest, technologically advanced image sensors. The low cost of CMOS technology and lower power consumption have helped CMOS imagers in gradually overtaking the CCDs in the image sensor market. CMOS accounted for the highest revenues in the APAC image sensor market, among technologies, in 2014, and is expected to grow at a CAGR of 5.9% from 2014 to 2019.
The report also provides an extensive competitive landscape of the companies operating in this market. The market players in the APAC image sensor market include Sony (Japan), Samsung Electronics (South Korea), Aptina Imaging Corporation (U.S.), Toshiba Corporation (Japan), and Omnivision Technologies (U.S.), among others, who have contributed significantly to the image sensor technology and its further development in the APAC region.
Customization Options:
Along with the market data, customize the MMM assessments to meet your company’s specific needs. Customize to get comprehensive industry standards and deep dive analysis of the following parameters:
Technological Data
- Region-wise end-user adoption rate analysis of the technology (CMOS, CCD, contact image sensors)
- Technology matrix, which gives a detailed comparison of various technologies (CMOS, CCD, Contact image sensors), mapped at country and sub-segment level
- Upcoming development in the technology (company and country-wise)
Price Trend Analysis
- Average Selling Price (ASP) analysis of image sensors with respect to different applications, at country level
- Analysis of material cost, processing cost , and assembly cost incurred in making an image sensor
Data from Key Players
- Key revenue pockets for the manufacturing and suppliers
- Various firms’ opinions about the upcoming market and trends
- Qualitative inputs on macroeconomic indicators and growth strategies of the market players
Shipment Data
- Volume-based market analysis of image sensors used for consumer applications
Country Level Data Analysis
- Country-level data for top countries in the image sensor market
- Country-specific data indicating the growth opportunities in different regions
Trend Analysis of Application
- Application matrix, which gives a detailed comparison of the application portfolio of each company in APAC
- Application matrix. which gives a detailed comparison of the application portfolio based on different technologies
Table of Contents
1 Introduction (Page No. - 9)
1.1 Objectives of the Study
1.2 Market Definition and Scope
1.3 Stakeholders
2 Research Methodology (Page No. - 11)
2.1 Integrated Ecosystem of the Image Sensor Market
2.2 Arriving at the Asia-Pacific Image Sensor Market Size
2.2.1 Top-Down Approach
2.2.2 Bottom-Up Approach
2.2.3 Demand Side Approach
2.2.4 Macro Indicator Based Approach
2.3 Assumptions
3 Executive Summary (Page No. - 18)
4 Market Overview (Page No. - 20)
4.1 Introduction
4.2 Market Drivers and Inhibitors
4.3 Key Market Dynamics
4.4 Demand-Side Analysis
5 Asia-Pacific Image Sensor Market, By Technology (Page No. - 26)
5.1 Introduction
5.2 Asia-Pacific Image Sensor Market, Technology Comparison With Parent Market
5.3 Asia-Pacific Cmos Image Sensor Market, By Country
5.4 Asia-Pacific Ccd Image Sensor Market, By Country
5.5 Asia-Pacific Contact Image Sensor Market, By Country
6 Asia-Pacific Image Sensor Market, By Application (Page No. - 32)
6.1 Introduction
6.2 Asia-Pacific Image Sensor Market, By Medical Application
6.2.1 Asia-Pacific Image Sensor Market, By Endoscopy Application
6.2.1.1 Asia-Pacific Image Sensor Market, By Rigid Endoscopy Application
6.2.1.2 Asia-Pacific Image Sensor Market By Flexible Endoscopy Application
6.2.2 Asia-Pacific Image Sensor Market, By Digital Radiology
6.2.3 Asia-Pacific Image Sensor Market, By Ophthalmology Application
6.3 Asia-Pacific Image Sensor Market in Automotive Application
6.4 Asia-Pacific Image Sensor Market in Defense & Aerospace Application
6.4.1 Asia-Pacific Image Sensor Market in Visible Spectrum Sensors
6.5 Asia-Pacific Image Sensor in Consumer Application
6.6 Asia-Pacific Image Sensor in Industrial Application
6.6.1 Asia-Pacific Image Sensor in Industrial Application, By Scan Type
7 Asia-Pacific Image Sensor Market, By Country (Page No. - 48)
7.1 Introduction
7.2 India Image Sensor Market
7.2.1 India Image Sensor Market, By Application
7.2.2 India Image Sensor Market, By Technology
7.3 China Image Sensor Market
7.3.1 China Image Sensor Market, By Application
7.3.2 China Image Sensor Market, By Technology
7.4 Japan Image Sensor Market
7.4.1 Japan Image Sensor Market, By Application
7.4.2 Japan Image Sensor Market, By Technology
7.5 South Korea Image Sensor Market
7.5.1 South Korea Image Sensor Market, By Application
7.5.2 South Korea Image Sensor Market, By Technology
7.6 Taiwan Image Sensor Market
7.6.1 Taiwan Image Sensor Market, By Application
7.6.2 Taiwan Image Sensor Market, By Technology
8 Asia-Pacific Image Sensor Market Competitive Landscape (Page No. - 68)
8.1 Asia-Pacific Image Sensor Market: Company Share Analysis
8.2 Company Presence in Image Sensor Market, By Technology
8.3 New Product Development
8.4 Mergers & Acquisitions
8.5 Agreements, Partnerships, Joint Ventures, and Collaborations
9 Asia-Pacific Image Sensor Market, By Company (Page No. - 73)
9.1 Omnivision Technologies Ltd.
9.1.1 Company Overview
9.1.2 Product and Services Offerings
9.1.3 Key Financials
9.1.4 MMM Analysis
9.1.5 Related Developments
9.2 Aptina Imaging Corporation
9.2.1 Company Overview
9.2.2 Product and Services Offerings
9.2.3 Key Financials
9.2.4 MMM Analysis
9.2.5 Related Developments
9.3 Samsung Electronics
9.3.1 Company Overview
9.3.2 Product and Services Offerings
9.3.3 Key Financials
9.3.4 MMM Analysis
9.3.5 Related Developments
9.4 Sony Corporation
9.4.1 Company Overview
9.4.2 Product and Services Offerings
9.4.3 Key Financials
9.4.4 MMM Analysis
9.4.5 Related Developments
9.5 Toshiba Corporation
9.5.1 Company Overview
9.5.2 Product and Services Offerings
9.5.3 Key Financials
9.5.4 MMM Analysis
9.5.5 Related Developments
10 Appendix (Page No. - 90)
10.1 Customization Options
10.1.1 Product Portfolio Analysis
10.1.2 Country Level Data Analysis
10.1.3 Product Comparison of Various Competitors
10.1.4 Trade Analysis
10.2 Related Reports
10.3 Introducing RT: Real Time Market Intelligence
10.3.1 RT Snapshots
List of Tables (49 Tables)
Table 1 Asia-Pacific Image Sensor Market Size, By Application, 2014 (USD MN)
Table 2 Asia Pacific R&D Expenditure, 2012–2013 (USD MN)
Table 3 Asia-Pacific Image Sensor Market: Comparison With Parent Market, 2013–2019 (USD ’000)
Table 4 Asia-Pacific Image Sensor Market: Drivers and Inhibitors
Table 5 Asia-Pacific Image Sensor Market: By Application, 2013–2019 (USD ‘000)
Table 6 Asia-Pacific Image Sensor Market, Technology By Geography, 2014 (USD '000)
Table 7 Asia-Pacific Image Sensor Market: By Application, 2013–2019 (USD MN)
Table 8 Asia-Pacific Image Sensor Market, By Technology, 2013–2019 (USD ‘000)
Table 9 Asia-Pacific Image Sensor Market: Comparison With Parent Market, 2013–2019 (USD‘000)
Table 10 Asia-Pacific Cmos Image Sensor Market, By Country, 2013–2019 (USD ‘000)
Table 11 Asia-Pacific Ccd Image Sensor Market, By Country, 2013–2019 (USD ‘000)
Table 12 Asia-Pacific Contact Image Sensor Market, By Country, 2013–2019 (USD’000)
Table 13 Asia-Pacific Image Sensor Market, By Application, 2013–2019 (USD ‘000)
Table 14 Asia-Pacific Image Sensor Market, By Medical Appication, 2013-2019 (USD ‘000)
Table 15 Asia-Pacific Image Sensor, By Endoscopy Application 2013–2019 (USD ‘000)
Table 16 Asia-Pacific Image Sensor Market, By Rigid Endoscopy Application, 2013–2019 (USD‘000)
Table 17 Asia-Pacific Image Sensor Market, By Flexible Endoscopy Application, 2013–2019 (USD ‘000)
Table 18 Asia-Pacific Image Sensor Market, By Digital Radiology 2013–2019 (USD‘000)
Table 19 Asia-Pacific Image Sensor Market, By Ophthalmology Application, 2013–2019 (USD ‘000)
Table 20 Asia-Pacific Image Sensor in Automotive Application, 2013–2019 (USD‘000)
Table 21 Asia-Pacific Image Sensor Market in Defense & Aerospace Application, 2013–2019 (USD‘000)
Table 22 Asia-Pacific Image Sensor in Visible Spectrum Sensor, 2013–2019 (USD ‘000)
Table 23 Asia-Pacific Image Sensor in Consumer Application, 2013–2019 (USD‘000)
Table 24 Asia-Pacific Image Sensor in Industrial Application, 2013–2019 (USD‘000)
Table 25 Asia-Pacific Image Sensor in Industrial Application, By Scan Type, 2013–2019 (USD‘000)
Table 26 Asia-Pacific Image Sensor Market, By Country, 2014–2019 (USD‘000)
Table 27 India Image Sensor Market, By Application, 2013–2019 (USD ‘000)
Table 28 India Image Sensor Market, By Technology, 2013–2019 (USD ‘000)
Table 29 China Image Sensor Market, By Application, 2013–2019 (USD ‘000)
Table 30 China Image Sensor Market, By Technology, 2013–2019 (USD ‘000)
Table 31 Japan Image Sensor Market, By Application, 2013–2019 (USD ‘000)
Table 32 Japan Image Sensor Market, By Technology, 2013–2019 (USD ‘000)
Table 33 South Korea Image Sensor Market, By Application, 2013–2019 (USD ‘000)
Table 34 Soth Korea Image Sensor Market, By Technology, 2013–2019 (USD ‘000)
Table 35 Taiwan Image Sensor Market, By Application, 2013–2019 (USD ‘000)
Table 36 Taiwan Image Sensor Market, By Technology, 2013–2019 (USD ‘000)
Table 37 Image Sensor Market: Company Share Analysis, 2013 (%)
Table 38 Asia-Pacific Image Sensor Market : New Product Development and Launches
Table 39 Image Sensor Market: Mergers & Acquisitions
Table 40 Image Sensor Market: Collaborations
Table 41 Omnivision Technologies, Lts: Operating Data,2009–2013 (USD ‘000)
Table 42 Samsung Electronics: Annual Revenue, By Business Segment, 2009–2013 (USD‘000)
Table 43 Samsung Electronics: Annual Revenue, By Geographic Region, 2009–2013 (USD‘000)
Table 44 Samsung Electronics: Operating Data (USD‘000)
Table 45 Sony Corporation: Annual Revenue, By Business Segment, 2009–2013 (USD‘000)
Table 46 Sony Corporations: Annual Revenue, By Geographic Region, 2009–2013 (USD‘000)
Table 47 Sony Corporations: Operating Data (USD‘000)
Table 48 Toshiba Corporation: Annual Revenue, By Business Segment, 2009–2013 (USD ’000)
Table 49 Toshiba Corporations: Operating Data (USD‘000)
List of Figures (59 Figures)
Figure 1 Asia-Pacific Image Sensor Market: Segmentation & Coverage
Figure 2 Image Sensor Market: Integrated Ecosystem
Figure 3 Research Methodology
Figure 4 Top-Down Approach
Figure 5 Bottom-Up Approach
Figure 6 Demand-Side Approach
Figure 7 Macro Indicator Based Approachr&D Expenditure
Figure 8 Asia-Pacific Image Sensor Market Snapshot
Figure 9 Image Sensor Market: Growth Aspects
Figure 10 Image Sensor Market: Comparison With Parent Market
Figure 11 Asia-Pacific Image Sensor Market, By Application, 2014 & 2019
Figure 12 Asia-Pacific Image Sensor Market, Technology By Geography, 2014 (USD '000)
Figure 13 Demand-Side Analysis
Figure 14 Asia-Pacific Image Sensor Market, By Technology, 2014 & 2019 (USD ‘000)
Figure 15 Asia-Pacific Image Sensor Market: Comparison With Parent Market, 2013–2019 (USD ‘000)
Figure 16 Asia-Pacific Cmos Image Sensor Market, By Country, 2013–2019 (USD‘000)
Figure 17 Asia-Pacific Ccd Image Sensor Market, By Country, 2013–2019 (USD’000)
Figure 18 Asia-Pacific Contact Image Sensor Market, By Country, 2013–2019 (USD‘000)
Figure 19 Asia-Pacific Image Sensor Market, By Application, 2014 & 2019 (USD ‘000)
Figure 20 Asia-Pacific Image Sensor Market, By Medical Application, 2013–2019 (USD’000)
Figure 21 Asia-Pacific Image Sensor Market, By Endoscopy Application,2013-2019 (USD’000)
Figure 22 Asia-Pacific Image Sensor Market, By Rigid Endoscopy Application,2013–2019 (USD‘000)
Figure 23 Asia-Pacific Image Sensor Market, By Flexible Endoscopy Application,2013–2019 (USD ‘000)
Figure 24 Asia-Pacific Image Sensor Market, By Digital Radiology 2013–2019 (USD ‘000)
Figure 25 Asia-Pacific Image Sensor Market, By Ophthalmology Application,2013–2019 (USD‘000)
Figure 26 Asia-Pacific Image Sensor Market in Automotive Application,2013–2019 (USD‘000)
Figure 27 Asia-Pacific Image Sensor Market in Defense & Aerospace Application, 2013–2019 (USD ‘000)
Figure 28 Asia-Pacific Image Sensor in Visible Spectrum Sensors, 2013–2019 (USD‘000)
Figure 29 Asia-Pacific Image Sensor in Consumer Application, 2013–2019 (USD‘000)
Figure 30 Asia-Pacific Image Sensor in Industrial Application, 2013–2019 (USD‘000)
Figure 31 Asia-Pacific Image Sensor in Industrial Application, By Scan Type, 2013–2019 (USD ‘000)
Figure 32 Asia-Pacific Image Sensor Market: Growth Analysis, By Country, 2014–2019 (USD ‘000)
Figure 33 India Image Sensor Market Overview, 2014 & 2019 (%)
Figure 34 India Market Image Sensor Market, By Application, 2013–2019(USD‘000)
Figure 35 India Image Sensor Market: Application Snapshot
Figure 36 India Image Sensor Market, By Technology, 2013–2019 (Usd’000 )
Figure 37 India Image Sensor Market: Technology Snapshot
Figure 38 China Image Sensor Market Overview, 2014 & 2019 (%)
Figure 39 China Image Sensor Market, By Application, 2013–2019 (USD ‘000)
Figure 40 China Image Sensor Market: Application Snapshot
Figure 41 China Image Sensor Market, By Technology, 2013–2019 (USD ‘000)
Figure 42 China Image Sensor Market: Technology Snapshot
Figure 43 Japan Image Sensor Market Overview, 2014 & 2019 (%)
Figure 44 Japan Image Sensor Market, By Application, 2013–2019 (USD ‘000)
Figure 45 Japan Image Sensor Market: Application Snapshot
Figure 46 Japan Image Sensor Market, By Technology, 2013–2019 (USD ‘000)
Figure 47 Japan Image Sensor Market: Technology Snapshot
Figure 48 South Korea Image Sensor Market Overview, 2014 & 2019 (%)
Figure 49 South Korea Image Sensor Market, By Application, 2013–2019 (USD ‘000)
Figure 50 South Korea Image Sensor Market: Application Snapshot
Figure 51 South Korea Image Sensor Market, By Technology, 2013–2019 (USD ‘000)
Figure 52 South Korea Image Sensor Market: Technology Snapshot
Figure 53 Taiwan Image Sensor Market Overview, 2014 & 2019 (%)
Figure 54 Taiwan Image Sensor Market, By Application, 2013–2019 (USD ‘000)
Figure 55 Taiwan Image Sensor Market: Application Snapshot
Figure 56 Taiwan Image Sensor Market, By Technology, 2013–2019 (USD ‘000)
Figure 57 Taiwan Image Sensor Market: Technology Snapshot
Figure 58 Asia-Pacific Image Sensor Market: Company Share Analysis, 2013 (%)
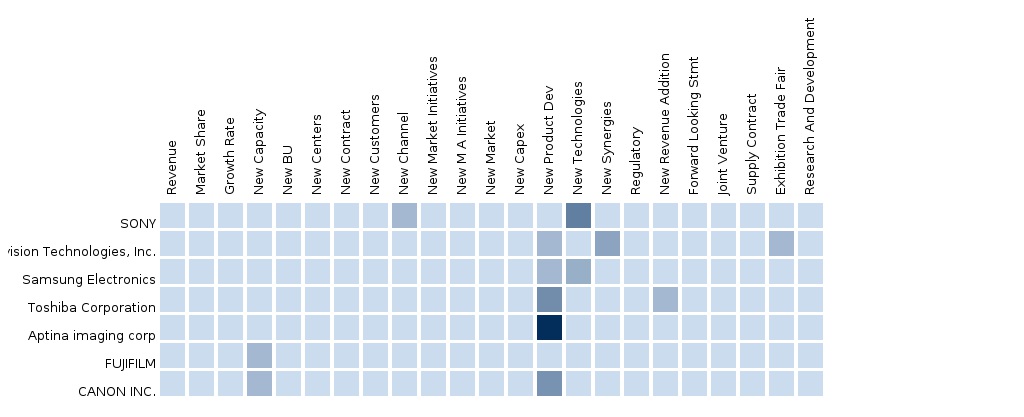
Figure 59 Image Sensor: Company Product Coverage, By Technology, 2013
The APAC image sensor market was valued at $3.42 billion in 2014 and is expected to reach a value of $4.57 billion by 2019, at a CAGR of 5.9% during the forecast period of 2014 to 2019. An image sensor is a device used to convert the optical image presented by lens into an electrical signal, which is mostly used in digital cameras, camera modules, and other imaging devices. It consists of millions of photodiodes and act as an image receiver in digital imaging equipment. It is widely being used in digital cameras, camera modules, and other imaging devices. Previously, there used to be analog sensors such as video tubes, which are currently being replaced by mostly CCD (Charge-Coupled Device) and CMOS (Complementary Metal Oxide Semiconductor) image sensors. The increasing trend of photography in youth is fuelling the growth of the image sensor market.
This study has been undertaken to understand the market dynamics in the area of image sensors, current revenue generated by image sensors, and the future forecast for the same. This study has been conducted to identify the key applications and geographies with a huge growth potential in the coming years. The total image sensor shipment and its average selling price have been analyzed, in order to arrive at the final market size for image sensors. Furthermore, the revenue of image sensors has also been analysed by clubbing the revenue of the top market players involved in the development of image sensors. This has been further verified with the help of discussions with the key market players.
Apart from the multiple areas of application that image sensors possess, there are other emerging applications areas such as medical imaging, POV (Point of view) cameras, UAV (Unmanned Aerial Vehicle) cameras, digital radiology, and factory automation. Thus, due to the presence of key players in APAC such as Omnivision, Aptina, and Samsung, the image sensors market has a great potential for growth in this region.
China accounted for the largest share of the APAC image sensor market and was valued at $1.63 billion in 2014. Its market size is expected to grow at a CAGR of 7.1% from 2014 to 2019, to reach a value of $2.30 billion by 2019. India, China, Japan, South Korea, and Taiwan are the leading countries in the APAC image sensor market.
APAC accounts for the largest share in the global image sensor market. This is mainly because most of the sensor manufacturers are located in the APAC region. Recently, Sony Corp. (Japan) announced that it is planning to offer image sensors for automotive cameras and is aiming to tap 50% of the automotive image sensor market. A number of companies are entering the market for smart cars. Google is working with Japanese automakers, including Honda Motor, to develop on-board systems and has been conducting research on technology for self-driving vehicles, on its own. The annual production of smart cars is expected to reach 100 million vehicles by 2025. (Source: Nikkei Asian Review). This would drive the demand for image sensors in the automotive segment.
The market players located in APAC such as, Sony (Japan), Samsung Electronics (South Korea), Aptina Imaging Corporation (U.S.), Toshiba Corporation (Japan) and Omnivision Technologies (U.S.) have contributed significantly to image sensor technology and its further development in the APAC region. The competition in the image sensors market in the APAC region is high, with manufacturers constantly striving to outperform their rivals with respect to pixel size, pixel count, resolution, and performance.
Please visit https://www.micromarketmonitor.com/custom-research-services.html to specify your custom Research Requirement


